Effectiveness of EFQM Model Implementation: a survey on Iranian automotive after-sale service companies
Behrouz Sharifi Moghaddam1, Abrisham Rashidzadeh Davan1, Morteza Musakhani1, Daryush Gholamzadeh2
1 Department of Management, Qazvin Branch, Islamic Azad University
2 Department of Management, Tehran Central Branch, Islamic Azad University
Abstract
It is nearly a decade that Iranian companies attempt to obtain European foundation for quality management (EFQM) organizational excellence award with guidance of public sector, spending enormous financial cost and utilization of human resources. Authors’ experiences, of an expert or consultant in implementing this pattern in several companies have motivated them to perform a research about the effectiveness of EFQM pattern in Iranian companies. In this regard, automotive after-sales service companies that engaged in achieving the EFQM award have been chosen as the study population. To evaluate the effectiveness of this pattern, several dimensions of organization based on research literature, patterns and theories were translated into operational and measurable indicators. Questionnaires completed by a chosen group of employees and managers were used for data collection. Research hypotheses were tested by the comparison of a coupled mean before and after the implementation of the EFQM model. Results suggest that the effectiveness of EFQM model implementation in Iranian companies is very low only in some dimensions.
Keywords: European foundation for quality management; Organizational Effectiveness; Organizational Excellence Award; EFQM; Automotive after sale services.
1 Introduction
Human beings consider themselves worthy of growth and excellence from ancient time and to obtain this they have benchmarked the best ones. In this way, in metropolitan areas some organizations in private or public sectors have been moved towards benchmarking due to feelings of needs or responsibility or other aims. To direct other organizations, they started documenting processes and politics. In this case, they have designed and developed some patterns. In some cases, these models have faced global attention and many organizations in public and private sectors, from other countries, have adopted these patterns and have deployed their implementation. The European foundation for quality management (EFQM) model is one of these quality patterns. The important issue to implement and benchmark these patterns is their appropriateness with culture and texture of countries and organizations that want to implement them in a new situation, because there are fundamental cultural and legal differences between them and organizations and countries who designed these patterns. In this regard, the noticeable issue is the effectiveness of these patterns implementation in such organizations.
It has been nearly a decade since EFQM pattern has been introduced to Iranian organizations and the support of the Ministry of “Industry, Mine and trade” to promote it as a model of quality management and also activities and support of organizations such as “Standard and Industrial research organization” and “promotion of industries organization” of Iran has made EFQM a known pattern for every organization. In this field, quality competitions have also been held and every year many organizations attend to these competitions to be assessed by an outer assessor and obtain quality awards. However, the effectiveness of these patterns is in doubt. Implementing these patterns demands much time and energy and requires many hours to learn about them.
Advocates globally represent EFQM as a reliable pattern. Many Iranian experts believe that establishing this pattern in Iranian companies will help them to success. The authors of this article are experts and consultants of establishing EFQM model and have witnessed the struggle of some companies in this way. This paper investigates the effectiveness of establishing EFQM model in automotive after-sales service companies.
This paper is organized as follows: Section 2 reviews organizational effectiveness and EFQM pattern literature; research model and methodology are described in section 3; the results of this study are explained in section 4 And; section 5 presents conclusion and suggestions.
2 Literature review
Organizational effectiveness
Understanding organizational goals is a yardstick in terms of understanding the effectiveness of organization. Organizational goals must show the essence of its existence and what the organization is trying to achieve.
Organizational Effectiveness means a degree of success in achieving goals. It has general meaning and implicitly comprises many factors, including inside the organization and its departments (Amiri et Sakaki, 2005). To determine organizational effectiveness, the degree of achieving goals will be judged, whether they are operational or official goals. Generally speaking, it is not easy to judge organizational effectiveness. Organizations involve various activities and are dispersed in different points. These organizations follow various goals, and reach different results (some are desirable and some are not) (Amiran, 2001). To determine the functionality of an organization many measures and methods are presented and each one introduces a different measure to evaluate organizational effectiveness.
Modern approaches to effectiveness evaluation
-
Beneficiary parties’ satisfaction approach
-
Competing values approach
it is possible to join several activities of an organization regarding beneficiary parties including staff, creditors, company owners, etc. it is possible that one of beneficiary parties came from out of the organization which has effect on the organization’s performance. In beneficiary parties’ satisfaction approach, which is also called Constituency Approach, the level of satisfaction of these beneficiary parties is considered as an indicator to evaluate organizational performance. Each beneficiary party has its own method to evaluate the effectiveness of an organization because each has its own interests in the organization. Investigation should be conducted on the parties in order to find out whether the organizations have successful performance on their view point or not. For the first time the beneficiary parties satisfaction approach, which included 97 small organizations, was performed in Texas. Seven beneficiary parties were selected to evaluate the effectiveness of the organization. The parties and indicators that evaluate organizational effectiveness are as below (table 1):
Table 1. Beneficiary parties and their effectiveness indicators
| Beneficiary party | Effectiveness indicator |
|---|---|
| 1.Company owners | Financial turnover |
| 2.Staffs | Satisfaction, staff and management motivation |
| 3.Customers | Product and service quality |
| 4.Creditors | Creditability |
| 5.Society | Role of the company in society development |
| 6.Raw material suppliers | Satisfying deals |
| 7.Government | Obeying rules and regulations |
The conducted research on parties reveals that a small organization cannot simultaneously satisfy all the parties involved. For example, in the organization, staffs are highly satisfied but other parties are not. However, if all seven indicators are taken into account (not one indicator), the effectiveness of an organization is evaluated accurately. Comprehensive results are obtained from investigating total organizational performance. Indicators of performance and organizational goals are determined by top and middle managers. Two researchers, Robert Quinn and John Rothrbaugh, mixed different indicators used by managers and researchers and introduced a new approach called Competing values approach. To implement this approach, a group of professionals provided a comprehensive list of performance indicators and scored them. The following effectiveness indicators were presented, considered as managers competing values in organizations.
Effectiveness valued models
Open System Model
It shows the attention of external elements and flexible structure. Progress and resource management are the first goals of management.
Internal process model
It shows the values that are in line with internal factors and structural controls. The first result of implementing this model is creating stable organizational environment which preserves itself in a logical pattern.
Human Resources Pattern
It is comprised of values which are used in a flexible structure and in internal affairs of an organization. To implement this model, management focuses on human resources development and facilitates their progress and freedom of actions. The margin goals that management wants to perform are: unity, improving spirit, and providing training opportunity for them. Organizations using this model think more about their personnel and their improvement.
Rational goal model
Managerial values show structural control and focus on external factors. The main goals in management are productivity, efficiency and profit. Organizations try to achieve margin goals through a controlled system. The margin goals which facilitate the path to main goals are internal programming and goal-making for the organization. These are tools for rational goal management (Daft, 2005).
In this article, a modern approach has been selected to evaluate organizational effectiveness, regarding research process and attitude. This approach will be discussed later and its method is based on satisfying different parties who are considered as “dimensions” here.
European Foundation for Quality Management (EFQM)
Fundamental Values and concepts
The organizational excellence model is a systematic framework aimed at evaluating organizations’ performances in two areas of enablers and the results of these enablers. The achievements of this model include strength points of the organization and organizational scopes areas that can be improved and, to achieve improvements, it suggests a list of prioritized programs (Pike et Barnes, 2001).
According to Total Quality Management (TQM), eight fundamental values and concepts are as follows: result orientation, customer orientation, leadership and constancy of purpose, management by processes and facts, development and participation of staff, continuous learning, improvement and innovation, partnership development and social responsibility of the organization. These eight fundamental values and concepts build the main basis for planning and implementing of systems. To understand the organizations performances, criterions that have a close relation to the above values and concepts, should be used. These criterions should reflect the achievement of eight fundamental concepts and the success level of an organization in achieving results.
Criterions
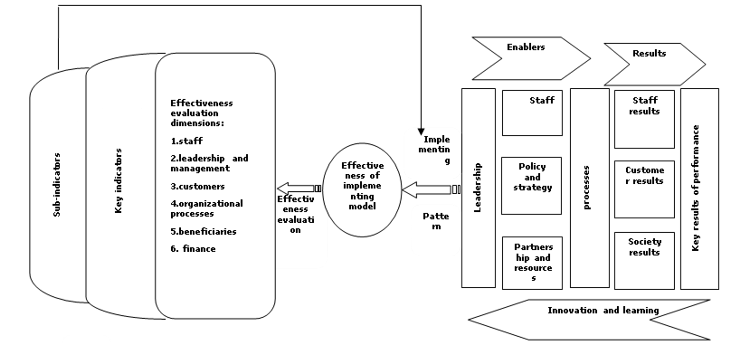
The fundamental pattern, on which the national productivity and organizational excellence award is based, has nine criterions. Five of them are “enablers” and the rest are “results”. Enablers are: leadership, policy and strategy, staff, partnership and resources, and processes. Results are: customer results, staff results, society results, and key results of the enabler’s criterions performance. The “enablers” criterions cover what an organization does and the “result” criterions cover what an organization gains. “Results” come out from the implementation of “enablers” and “enablers” are developed by the feedback from the “results”. Innovation and learning improve enablers and enabler’s development improves the results.
Research Issue
One of the important issues for Iranian companies is their ranking, in compared to other companies. This issue has forced them to obtain various standard certificates and awards. The “Iranian studies and Productivity of Human Resources” Institute has started to award EFQM award since 2003. Achieving the EFQM award became one of the great concerns of companies over the years. It is noticeable that, according to this institute, recent statistics show that nearly 400 companies have applied for this award. Existing Problems to achieve these awards are: barriers and costs of implementations, spending much time to establish data base of the audit and also utilizing actual and potential human and financial resources. They are leading factors to investigate this issue. Another important factor is the appropriateness of this model with the context of Iranian companies. Companies often participate in competitions without any knowledge in terms of their results and effectiveness and most of the times they cannot see and feel the improvements of the implementation of this model. In fact, perhaps they cannot achieve the expected results of this model. Considering these, this study examines the effectiveness of implementing the EFQM model in Iranian organizations (automotive after-sale service companies) that are participating to achieve this award and it wants to study improvements and effectiveness for achieving this award with a focus on objectives, criterions and logic of this model.
Research Hypotheses
Hypothesis 1. Implementing EFQM model affected companies’ performances in terms of staff dimension.
Hypothesis 2. Implementing EFQM model affected companies’ performances in terms of leadership and management dimension.
Hypothesis 3. Implementing EFQM model affected companies’ performances in terms of customers’ dimension.
Hypothesis 4. Implementing EFQM model affected companies’ performances in terms of organizational processes dimension.
Hypothesis 5. Implementing EFQM model affected companies’ performances in terms of beneficiaries’ dimension.
Hypothesis 6. Implementing EFQM model affected companies’ performances in terms of finance dimension.
3 Research model and methodology
Statistical population
Employees and managers of Iranian automotive after-sales service companies who have participated in various courses to receive the organizational excellence award (EFQM) are the statistical population of this study: 1. Mazda yadak Company, 2. Rena Company (Saipa Diesel Sales and Services), 3. Saipa yadak, 4. ISACO, 5.ShahabYar, 6. Pars Khodro technical services.
Determination of sample size
Considering that this issue has not been investigated so far, there is no initial estimate of society’s standard deviation. To determine sample size, we use this Cochran formula n ≥  and we show the sample size with n, the statistic z (α / 2) equal to 1.96, estimated standard deviation σ and sampling error ε is equal to 0.05. At First, a preliminary sample of the population to calculate and estimate the standard deviation of the population with a confidence level of 95% and 0.05 Error, to determine the sample size was chosen (Azar et Momeni, 2005). In this study, we divided the volume of population in the sample size to determine the sampling interval. Then we chose a random number so that it was smaller than or equal to the sampling interval (Moghimi, 2001).
The formula , (N) shows the total population of employees and managers of 6 companies and percent sample of each company was determined on the basis of population of employees in each company. This research was carried out in 2011.
and we show the sample size with n, the statistic z (α / 2) equal to 1.96, estimated standard deviation σ and sampling error ε is equal to 0.05. At First, a preliminary sample of the population to calculate and estimate the standard deviation of the population with a confidence level of 95% and 0.05 Error, to determine the sample size was chosen (Azar et Momeni, 2005). In this study, we divided the volume of population in the sample size to determine the sampling interval. Then we chose a random number so that it was smaller than or equal to the sampling interval (Moghimi, 2001).
The formula , (N) shows the total population of employees and managers of 6 companies and percent sample of each company was determined on the basis of population of employees in each company. This research was carried out in 2011.
Statistical Sample
After collecting a sample of 40, the standard deviation of 0.37 obtained and the value of n for the community of employees were chosen equal to 220 and for the community of managers. After collecting an initial sample of 10 and 5 and estimating the standard deviation for the respective amount of 0.018 and 0.05, the population of managers obtained about 50 (for managers questionnaires) and 25 (for interviewees).
Reasons for selecting this statistical population
-
Wide competence of the listed companies to receive excellence awards
-
Companies backgrounds in establishing the EFQM model
-
Achieving at least one of these awards by the listed companies
Measure
In this study, questionnaires and documents were used to collect and analyze the datum. Three types of questionnaires were designed for this research:
1: Staff Questionnaire; 2: Managers Questionnaire; 3: Pre-designed questionnaire or interview questions.
The staff questionnaire includes 50 questions and its indicators are:
1: Participation; 2: rewards; 3: Equal opportunities; 4: Job promotion; 5: Welfare facilities; 6: Authority delegation; 7: Safety and health; 8: Salaries and wages; 9.: Communicating with managers and staff; 10: Job Training; 11: Commitments; 12: Responsibility; 13: Altruism; 14: Virtue of citizenship; 15: Chivalry and patience and; 16: Respectfulness.
In the beneficiaries’ dimension, employees were asked in the case of the following indicators:
1: Environmental standards; 2: Regulations; 3: Social Responsibilities.
And in staff dimension: indicators about recruitment, desertion/absenteeism, displacement, labor productivity and accidents were measured (Ockland, 2005).
The managers’ questionnaire includes 35 questions and the following indicators:
1: Staff Communications; 2: Appreciation of staff; 3: Contact with people outside the organization; 4: Information; 5: Organizational speaker’s roll and accountability for organization programs: 6; Head of Organizational information; 7: Innovation/creativity/entrepreneurship; 8: Problem solver; 9: Negotiator.
In beneficiaries’ dimension, managers were asked about the following indicators: 1: Environmental standards; 2: Regulations; 3: Social responsibilities and;
In a pre-designed questionnaire with 40 questions, to interview with managers, and collect documents about: customers, organizational processes, beneficiaries, and finance dimensions, following the measured indicators:
1: Rapid and appropriate customers response time; 2: The number of complaints; 3: Measuring customer satisfaction; 4: Timely delivery of services; 5: Position of the company's services among other competitors, 6: Costs of services for customers; 7: Time of processes; 8: Cost of processes; 9: Controlling and monitoring processes; 10: Evaluating Processes; 11: Obligations towards partners; 12: Amounts of Investment and credit; 13: Obligations towards suppliers; 14: Investment and credit; 15: Obligations towards shareholders; 16: Communication with shareholders; 17: Information and transparency with stakeholders; 18: Environmental standards; 19: Regulations; 20: Social responsibilities; 21: Reducing fixed and variable costs; 22: The savings in energy consumption; 23: Income; 24: Liquidity; 25: Supplying sources; 26: Technology; 27: Information and Knowledge; 28: Development of buildings and equipment; 29: Interest in the management and leadership dimension (Bou-Llusar et al., 2009).
It is necessary to explain that all dimensions and indicators were analyzed in separate databases.
The reliability and validity of questionnaires
To determine the validity of questionnaires, many pundits, experts, consultants and professors were asked and after taking a poll and fixing defects, questionnaires were created and distributed.
Cronbach's alpha was used to assess the reliability of questionnaires. Cronbach's alpha received 0.911 for staff questionnaires, 0.944 for managers’ questionnaires and finally 0.911 for interview questions.
Conceptual model
Conceptual model (figure 2), based on research studies and the use of standards, values and the EFQM fundamental concepts are presented and have six dimensions:
- Staff; 2. Leadership and Management; 3. Customers; 4. Organizational processes; 5. Beneficiaries or partnersand; 6. Finance. The indicators and sub-indicators of these dimensions were extracted and analyzed (Ockland, 2005; Pike et Barnes, 2001).
Figure 1. Conceptual model
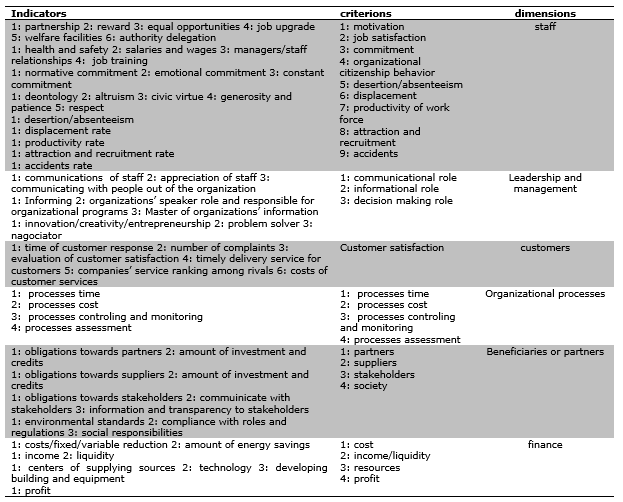
Operational model
A great number of scientific studies and resources on effectiveness and EFQM pattern (more than 50 books, articles and patterns) were studied. All of the evaluation indicators and models were studied and 120 indicators were selected. Finally, with focus on experts’ viewpoints, effectiveness models and the EFQM model, 25 key indicators were extracted and introduced. The detailed description is presented in table 2 (Najmi et Hosseini, 2009; Ockland, 2005).
Table 2. Operational model
4 RESULTS
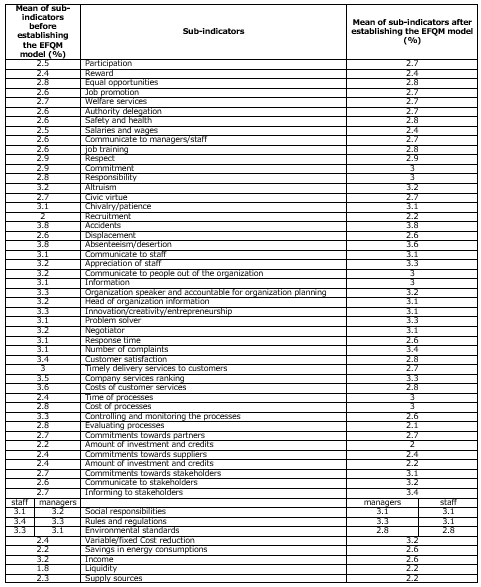
According to Table 3, in results of sub-indicators, the indicator of participation before establishment has growth 5%; however, reward indicators, equal opportunities, and welfare do not show any changes and authority delegation indicators have shown a little difference in terms of growth of 1 or 2 percent. That is the reason for small changes in terms of the job satisfaction indicator after establishment. After the implementation of the model, indicators of salary and wages and respect were decreased and the training indicator is the only one that grows 3 percent.
The main indicator of commitment increased 2 percent, compared to previous measures. And also, the indicator of organizational citizenship behavior is likewise and has minor differences.
The comparison of the main recruitment indicators has shown growth of about 4 percent; on the other hand, the indicator of absenteeism and desertion has reduced in about 4 percent and it shows that companies could not hold their staff and they had to recruit many new employees, equal to the number of their absent employees.
One of the issues that are greatly emphasized in terms of EFQM pattern is the indicator of accidents, and, although companies spent a lot of money in establishing standards, laws and regulations, it has not shown any significant growth in comparison with the previous implementation of the EFQM pattern. The results suggest that differences in the staff dimension before and after establishment had improved only 1% and it is likely that: 1. the model has not enough effectiveness; 2. There is a deviation in the evaluation process and; 3. The available data to assess organization are not true.
In the leadership and management dimension the indicator of "managers’ communications with the staff" was reduced and "communicating to people outside the organization" presented a small growth. Sub-indicators of "informational role" had grown a little. In the sub-indicators of decision making dimension, the indicator of "innovation and creativity" shows a 4% growth while the indicator of "solving issues and problems", which is one of the main managerial tasks, had shown a reduction of 4% and this shows lack of staff participation in the organizational decision making, or it shows that authority delegation is not appropriate. Thus, in the management and leadership dimension, there was no difference between before and after establishing the EFQM model.
Although the indicator of "response time" has a significant growth, the number of complaints in terms of customers dimension, was increased by approximately six percent, and it is related to other factors, including the external and mediator variables, such as: production and pricing of cars in the mother factories. Satisfaction measuring tools show significant growth of 12%. All companies admit that they are in the better ranking in comparison to the model implemented previously and perhaps it is due to the lack of correct information about other competitors. In this way, we can refer to the high costs that companies have to provide services for customers, to compete with other companies and to pay attention to view points of mother companies’ top managers and customers.
In the organizational processes dimension, "despite the processes improvement, monitoring and multiple assessments the indicator of "time of processes is increased. However, the aim was time reduction, and it also results in an increase of 4% cost to carry out processes. For example, in the training process, managers mentioned that a lot of money was spend and expected results have not been obtained. It can be mentioned that, the lack of proper planning for processes is a reason of failure and the processes and their assessment should be reviewed seriously.
In the beneficiary’s dimension, results show that companies were not committed to their partners and suppliers and even this indicator decreased a little in terms of percentage in comparison to a moment before the implementation of the model. As to their commitments to employees and society, its percentage increased a little and it shows that companies had a lot of activities in case of society indicators. The indicator of "environmental standards" shows the highest growth in comparison to other sub-indicators.
In finance dimension, companies’ costs were increased when compared to a moment before establishing the model. Most of costs refer to the development of building, equipment and technology units. Here, the most important issue is the reduction of profits in comparison to a time prior to the establishment and to the role of mediating variables and this should not be ignored.
Table 3. Results of research sub-indicators
Studying the effectiveness of the main indicators and selected dimensions
The status of employees after the settlement of EFQM pattern, in comparison to before, is not much different; rather, it is almost identical. It seems to promote organizational excellence and service to human resources that is a critical component to the improvement of the model, to the level of motivation, satisfaction and commitment. Organizational citizenship behavior and other indicators have not changed significantly and even in some indicators there is a significant reduction.
Management status as compared with before the establishment of EFQM pattern is not different and it seems to promote organizational excellence. The leadership of human resources was not effective either. The results of the indicators and also studying hypothesis 2 are proof to lack of success and effectiveness in this dimension.
The status of customers after the settlement of the EFQM pattern is going to be better and improved. However, it should certainly be noted that the relative improvement is because of spending a high price and additional time and energy that their productivity should be determined and this requires a research in this field.
Companies were somewhat successful to utilize assessment tools to know about and gain customers need. However, the number of complaints is more increased than before, and it is because of customers’ expectations that may occur after achieving excellence awards by companies.
Results suggest that the statuses of organizational processes have improved in comparison to before. However, it should be noted that the relative improvement is because of spending a high price, time and energy; therefore, their results should be searched in terms of increased profits and better and faster service should be provided to customers. It should be noted that organizational processes in terms of controlling, monitoring and evaluating are in better condition than before implementing the model.
The status of beneficiaries compared to before the settlement of EFQM pattern is improved. The largest utility is in society indicator, because company executives and employees have a greater consensus about it and they aim to influence people’s viewpoints towards their growth.
Results suggest that companies’ financial positions are not suitable in compared to before establishing the EFQM model and it may have suffered due to a great loss of profits. In spite of other variables, such as economic sanctions and the lack of financial resources that may be involved, the results of the main indicators and dimensions are presented in tables 4 and 5.
Table 4. Results of the main indicators
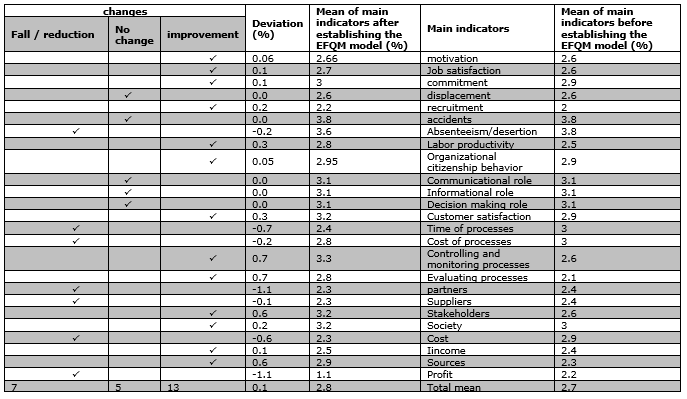
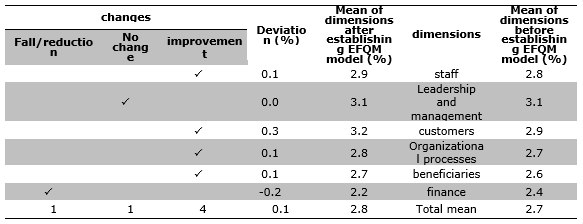
Table 5. Results of dimensions
Effectiveness of companies’ different scopes
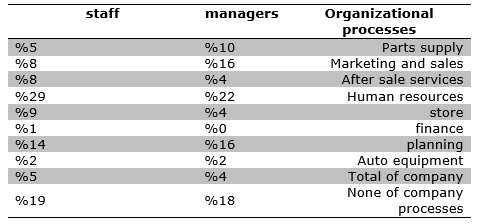
Table 6 shows that 29% of employees admit that the highest effectiveness resulted from the establishment of the EFQM pattern was in the human resources scope and the lowest effectiveness rate of 1 percent was occurred in the financial scope. Also, 14 percent have agreed that the EFQM pattern influenced planning scope. Managers as well as employees admit that, effectiveness rate in human resource management scope is 22 percent; in the financial scope it is 0 percent and 16 percent in planning scope and this indicates that managers and employees agree in these scopes. Results show that this model could not have a significant impact on other scopes. Perhaps 19 percent of employees and 18 percent of executives believed that this pattern has no effect in all scopes and processes of the company. This should be noted that before the establishment of EFQM pattern, necessary changes in terms of organizational culture should occur.
Table 6. Results of effectiveness of implementing EFQM model in companies’ different scopes
Review and analysis of research hypotheses
Hypothesis 1. Implementing the EFQM model affected companies’ performances in terms of staff dimension.
Results indicate that the first hypothesis is supported as compared mean test rejected equality of means of companies’ performances in staff dimension before and after establishing EFQM pattern (p<0.05). It can be claimed that implementing this model improved companies’ performances in terms of staff dimension because the average company’s performances after establishing this model is higher than before.
Hypothesis 2. Implementing the EFQM model affected companies’ performances in terms of leadership and management dimension.
Results indicate that the second hypothesis is rejected as the compared mean test does not reject equality of means of companies’ performances in the leadership and management dimension before and after establishing EFQM pattern (p>0.05). It can be claimed that implementing this model does not affect companies’ performances in the leadership and management dimension and the difference between means were due to sampling error.
Hypothesis 3. Implementing the EFQM model affected companies’ performances in customers’ dimension.
Results indicate that the first hypothesis is supported as the compared mean test rejected equality of means of companies’ performances in customers dimension before and after establishing EFQM pattern (p<0.05). It can be claimed that implementing this model improved companies’ performances in the customers dimension because the average company’s performances is higher than before after establishing this model.
Hypothesis 4. Implementing the EFQM model affected companies’ performances in the organizational processes dimension.
Results indicate that the first hypothesis is supported as the compared mean test rejected equality of means of companiess’ performances in the organizational processes dimension before and after establishing EFQM pattern (p<0.05). It can be claimed that implementing this model improved companies’ performances in the organizational processes dimension because the average company’s performances is higher than before after establishing this model.
Hypothesis 5. Implementing the EFQM model affected companies’ performances in the beneficiaries’ dimension.
Results indicate that the first hypothesis is supported as the compared mean test rejected equality of means of companies’ performances in the beneficiaries dimension before and after establishing EFQM pattern (p<0.05). It can be claimed that implementing this model improved companies’ performances in the beneficiaries dimension because the average company’s performances is higher than before after establishing this model.
Hypothesis 6. Implementing the EFQM model affected companies’ performances in the finance dimension.
Results indicate that the first hypothesis is supported as the compared mean test rejected equality of means of companies’ performances in the finance dimension before and after establishing EFQM pattern (p<0.05). It can be claimed that implementing this model decreased companies’ performances in the finance dimension because the average company’s performances is lower than before after establishing this model. Results of hypothesis tests are presented in table 7.
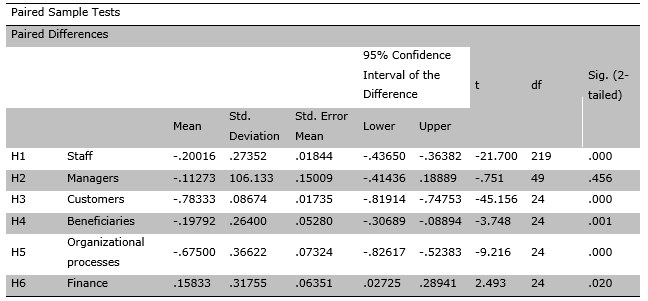
Table 7. Results of hypothesis tests
5 Conclusions
Nowadays, old after-sales service systems cannot respond for the growing needs of customers in goods and services. Software, systems, sophisticated machineries and modern tools, show that human knowledge moves to specialization and maturity very quickly. Old methods and processes of after-sale services do not have essential power to support this expanding movement. Today organizations need big changes. In this direction, although implementing EFQM pattern can be effective, companies should have the essential basis of human resources and administrations and also criterions of quality patterns should be appropriate to the country’s local and organizational culture.
Implementing these patterns with emphasis on gaining native pattern appropriateness to the organizational culture of the Iranian companies can bring positive achievements. It is essential to notice that mission statement and activities of the studied organizations presented services in nature and the effect of performance improvement and its quality can be seen in the customer satisfaction indicator in retail and trade services, so that the improvement of this indicator will have a direct impact on improving the indicator of companies’ profitability.
Research suggestions
In this section, suggestions which are directly related to this research are presented:
• Managers comprehensive support to implement these patterns
• Stable management and supervision
• Identifying and removing non-valued processes
• Identifying and improving valued processes
• Improving employees’ levels and skills
• Creating basis for development including the implementation of accurate human resources processes
• Gaining awards to improve employees’ motivation and companies’ fame
• Increasing speed and accuracy of services
• Reducing personnel costs by identifying costs sources
• Facilitating organizational communication with beneficiaries
• Increasing processes accuracy
• Changing organizational culture and attitude of staff and executives
• Getting feedback from the staff and involving them in organizational administration
• Organizations’ participation to transform the EFQM pattern into a native pattern
• Accurate planning to implement pattern
• Data documenting
References
Amiran, H. (2001) Familiarity with the methods of measuring efficiency and effectiveness of quality systems. Tehran: Quality makers consultants publication.
Amiri, M. et Sakaki, M. (2005) Performance Evaluation Guide, based on the EFQM Excellence Model using Radar Logic. Tehran: Department of Management Publication.
Azar, A. et Momeni, M. (2005) Statistics and its application in the management. Tehran: Samt.
Bou-Llusar, J. C., Escrig-Tena, A. B., Roca-Puig, V., Beltrán-Martín I. (2009) An empirical assessment of the EFQM Excellence
Model: Evaluation as a TQM framework relative to the MBNQA Model. Journal of Operations Management, Vol. 27, No. 1, pp. 1-22.
Daft, R. L. (2005) Organizational theory and design. Tehran: Cultural studies office.
Moghimi, S. M. (2001) Organization and management. Tehran: Termeh.
Najmi, M. et Hosseini, S. (2009) EFQM excellence model, from idea to practice. Tehran: Institute of human resources and productivity studies.
Ockland, J. (2005) Total organizational excellence: Achieving world class performance. Tehran: Godakhtar industries development and renovation.
Pike, J. et Barnes, R. (2001) Total quality management in practice. Tehran: Amirkabir technical university publication.