An inquiry into the productivity of the Indian pharmaceutical industry: application of data envelopment analysis
Umang Gupta Kumar Gupta1; Rohit Kapoor1
1 Indian Institute of Management
Abstract
Pharmaceutical industry is an important and significant industry in India. The common practice by experts, would-be investors and stakeholders of a pharmaceutical firm is to observe the year-end or quarterly financial figures of a firm and then use them to assess the firm’s future growth and competitive standing against rivals. However, over the past few years, there is a strange environment in which paid consultants and scamsters are making false and conflicting claims in terms of the performance and future growth of the companies. The researchers, however, have attempted, by means of Data Envelopment Analysis (DEA), to get past all this by benchmarking the companies based on the conversion from input to outputs. The advantage of using DEA is that, by simply using the figures from the financial reports, it brings a more rigorous quantitative analysis to make a comparison of the peers with the best virtual firm in their neighborhood. The technique itself may suggest measures for improvement. It is illustrated in the analysis by observing the slacks and targets about various companies of the pharmaceutical sector, i.e., decision making units (DMU).
Keywords: DEA; input-output; Pharmaceutical.
1 Introduction
Industry perspective
The pharmaceutical industry has been one of the success stories of India. The reasons are many, including the fact that good quality and essential drugs are now available at affordable prices to the vast population of the country, which is not so affluent. The Indian pharmaceutical companies are also competing with some of the best names in the global market. The industry is capital-intensive and intellectual in nature and is in the front rank of India's science-based industries. India's pharmaceutical industry is currently the 3rd largest in the world in terms of volume and the 14th in terms of value. The reason for this lower value share lays in the fact that, in India, the cost of drugs ranges from 5% to 50% less as compared to the developed countries. The March 2012 estimates peg sales from pharmaceuticals to go from US$ 11 billion currently to US$ 74 billion by 2020. the increasing population of the higher-income group in the country will open a potential US$ 8 billion market by 2015*. Besides this, the report said that the domestic pharmaceutical market is likely to reach $20 billion by 2015, making India a lucrative destination for clinical trials for global giants.
The accelerated growth over the years has been fuelled by exports to more than 200 countries with a sizeable share in the advanced regulated markets of US and Western Europe. 40% of the world's active ingredient requirement is met by India. Pharmaceutical industry in India ranks very high in terms of technology, quality and range of manufactured medicines. Many different medicine varieties are now made domestically by Indian industries. The industry has made significant progress in terms of the creation of required infrastructure, meeting global needs for the supply of quality medicines and active pharmaceutical ingredients (APIs), as also entering into the highly opportune area of contract research and manufacturing (CRAM) and clinical trials. Export of pharmaceutical products from India showed a compounded annual growth rate (CAGR) of 21.25% during three consecutive years, ending 2008-09, but grew only by 13% in 2009-10 [1].
India tops the world in exporting generic medicines worth of US$11 billion. According to a report published by PricewaterhouseCoopers (PwC) in April 2010, India will join the league of top 10 global pharmaceutical markets in terms of sales by 2020 with the total value reaching US$ 50 billion. The sector is estimated to have created so far 4.2 million employment opportunities with more than 20,000 registered units. Despite the fragmentation and price competition, the leading 250 pharmaceutical companies control 70% of the market with the leader holding nearly 7% of the market share. India currently exports drug intermediates, APIs, Finished Dosage Formulations (FDFs), bio-pharmaceuticals and clinical services to various parts of the world. High quality medicines at attractive prices can easily be found in India and, because of this cost of medical treatment, it is now promoting medical tourism. Apart from all that, an increase in the demand of special drugs and the niche demand for Ayurvedic drugs is also expected to rise with the current union. Tourism Minister Subodh Kant Sahai recently announcing desire to double the number of tourists by promoting medical and wellness tourism.
Threats and challenges
Competing pharmaceutical companies have several similar bio-equivalent products in the same market, manufactured at facilities that have been approved by the highest regulatory authorities. All of them are focused on the same markets, resulting in price decrease (therefore price sensitivity is tested) and margins get eroded. The challenges are greater for those Indian manufacturers who have similar production facilities. It is also common to find managers with similar talents and experiences in the industry.
Policy Attractiveness
FDI up to 100% is permitted for the manufacture of drugs and pharmaceuticals with some restrictions [2]. The Patents Act, 2005 (Amendment to The Patents Act, 1970), introduces product patent regime for food, chemical and pharmaceutical products and made it TRIPs compliant. It has helped in making the environment favorable for MNCs to operate in India. Consolidation is likely in the fragmented Pharmaceutical industry due to recent legislation and policy updates. Good Manufacturing Practices (GMP) outlined in Schedule M to the Drugs and Cosmetics Rules are also being revised. Manufacturing units are required to comply with the WHO and international standards of production [3].
Given the perspectives, threats and challenges and policy attractiveness of pharmaceutical sector, it is worthwhile to study different companies and analyze them. This will help practicing managers and investors to benchmark companies. Within a firm, decision makers will also need some targets in terms of inputs and outputs, which are well-defined and set the pace and direction of their subsequent decisions.
2 Objective
An attempt to effectively evaluate the Pharmaceutical sector by focusing on input-output relationship
The current available reports on pharmaceutical sector seem to be lacking in terms of the focus on the input and output relationship of the companies that they study. However this is also an important parameter to judge success and failure of Pharmaceutical firms over the years (Majumdar, 1994).
Issues with current benchmarking methods such as financial multiples/ratios
The finance multiples/ratios approach is focused on taking performance of a firm on a particular date. There is a tendency to come up with better numbers so as to get the preference of investors and stakeholders both inside and outside the firm. In the process, many financial jargons may take shape and structure with several layers of falsified information. It results into confusion among the investors and they may not be able to take appropriate decisions. For the decision makers in the firms, it is also a challenge to get a well-defined target so that they can channelize their efforts operationally. DEA, on the other hand, finds out the performance level of the firm by converting inputs into outputs. The factors (both input and output) that make the firm efficient do get known in the process. This helps the decision makers in the inefficient firms in setting the targets for their managers.
3 Methodology
Firms to Include
The common practice followed while selecting firms was to see whether they had an overall market capitalization above the median for all the firms for whom the data was available. As for the records of Sectoral Companies on Economic Times intelligence group (ETIG), as of Jun 25, 2012 the firms that did not have a minimum market capitalization of 1000 crore rupees were rejected. Also, firms without records for financial year 2010-11 on Capitaline [4] were rejected.
Figures Used
The various inputs and output headings were taken from Capitaline database and Economic Times intelligence group report available online.
Period of study
The data was collected for the period 2010-11 from the various data sources as mentioned above. The above period for the study that was chosen as the latest financial results for the year 2011-2012 was not available.
Data Envelopment Analysis (DEA)
DEA is a linear programming technique that produces a best practices frontier composed of efficient DMUs. (Farrell, 1957) attempted to measure production efficiency in a single input and output model. Its work was further extended to multi input and output models by Charnes et al. (1978), who coined the term DEA. This technique involves the use of linear programming to solve a set of inter-related problems to determine the relative efficiency of DMUs. Hence the first DEA model was developed by Charnes et al. (1978). A DMU is efficient if there exists no other DMU or linear combination of DMUs that produces the same vector of output with a smaller vector of inputs (in the input-oriented model) or produces a larger vector of outputs with the same vector of inputs (in the output-oriented model).
DEA has several desirable features that make it preferable to other performance measurement techniques such as traditional ratio analysis and Stochastic Frontier Analysis. First, being non parametric in nature, DEA does not require the specification of an a priori, well-defined functional form for the particular production process being analyzed. This “flexibility” makes it particularly useful when it is impossible to determine the mode in which a set of resources (inputs) are employed in combination to realize a multiplicity of products (outputs). Second, DEA permits the simultaneous management of more than one input and output because of its capacity to maximize the relationship between a "virtual" output and a “virtual” input; appropriately weighted sums of the vectors of inputs and outputs typical of pharmaceutical activity. Third, depending on the particular model selected, DEA can distinguish technical inefficiency from scale and scope inefficiency, since each firm is compared to a homogeneous peer group in terms of product size and mix. DEA has proven to be a popular technique for performance analysis in general. Charnes et al. (1978) define efficiency by reference to the orientation selected: (i) output orientated model, a DMU is not efficient if we can change outputs without increasing inputs or decreasing any other output; and (ii) input orientated model; a DMU is inefficient when we can decrease inputs without increasing other inputs and without decreasing any output. The pharmaceutical sector, in this regard, has a series of characteristics that make it particularly suitable for study through DEA: Its multi-input and multi-output nature, the non-linearity of its input-output relationships, the non-physical nature of some fundamental resources and products, and the impossibility of drawing on market prices for some of them. Charnes et al. (1978) suggested an input oriented model under the assumption of constant return to scale. Let us take N DMUs (Decision making units), whose efficiency has to be compared. Let kth be the reference DMU and its efficiency can be found by solving the following CCR model (Charnes, Cooper 1962; Charnes etal., 1978; Coelli, 1996):
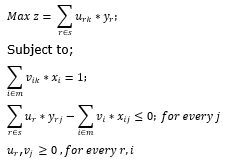
This model aims at deriving the values of the weights, that is, vi and ur (rєs being the total number of outputs), i.e. the input and output weights of the n DMUs in such a manner so that the efficiency of the kth DMU is a maximized subject to the condition that the efficiency measure for other DMUs with same weights are less than or equal to one.
If the efficiency score comes out to be 1, then the firm is said to be efficient and lies on the efficiency frontier. Otherwise the firm is relatively inefficient. In order to find the efficiency score for other firms, such mathematical model has to be formulated separately for each firm. Banker et al. (1984) proposed that this basic CRS model can be extended to variable returns to scale, i.e. VRS model by adding the convexity constraint to it, as shown below, where the convexity constraint variable is unrestricted and declared free of the non-negativity constraint.
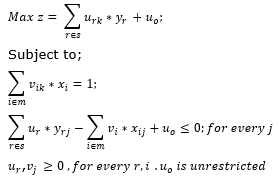
This paper uses the BCC VRS model to analyze the performance of the Indian Pharmaceutical Companies. Building on the ideas of Farrell (1957), here Charnes et al. (1978) applies linear programming to estimate an empirical production technology frontier for the first time.
Inputs and Outputs
We are using the following Outputs and Inputs for comparing different firms:
| Outputs | Inputs |
|---|---|
| Sales Turnover | Employee Cost |
| Excise Duty | Other Manufacturing Expenses |
| Net Sales | Selling & Administration Expenses |
| Other Income | Miscellaneous Expenses |
4 Empirical analysis
There is an attempt here to analyze the relative efficiencies of the top pharmaceutical companies of India for the year 2010-11. Below are the findings of the empirical analysis where we have used the BCC VRS DEA model with multi stage calculation of slacks.
Efficiency Summary
The findings of the data envelopment analysis given in Exhibit 1 suggest that there are 14 and 19 firms out of the 26 selected which are lying on the efficient frontier and have the optimal utilization of resources by the constant returns to scale and variable returns to scale efficiencies respectively. This means that, under the more realistic assumption of VRS, 5 firms that had CRS inefficiencies shifted on the efficient frontier. We can also observe the scale efficiencies. From the research of the literature done by prior investigators we know that a unit is scale efficient when any change in its size of operations will lead to undesirable change in its efficiency. The scale efficiency can be estimated from the CRS efficiency by dividing it with the VRS efficiency. The closer the firm is to 1, i.e. the highest permissible efficiency, the lesser is the scope for improvement by changes in the scale of the operations of the firm. Hence the firm must improve its technical efficiency in order to improve its overall VRS efficiency. Technical efficiency can be improved by a review in terms of the technology that the supposed virtual firm is using and how far we can go to adopt the technology that the firms constituting the virtual firm are using. Dual scores given by DEA also guides us to understand how much of each firm’s contribution to technology we can consider, which means that it will give the managers direction to understand how much of each firm to study and try to match its new implementation with the peer firm. Peer firms have been explained in more detail in section 6.3 from Exhibit 2. The dual scores are available for the inefficient firms upon solving the DEA linear program. Attention Directing has been attempted in the paper when DEA solutions were intended as a guide to managerial actions (e.g. goal setting) or policy making. It is important to recognize that the calculated improvements in terms of input and/or outputs are indicative of potential performance increases by the DMUs located below the efficient frontiers. In a sense, the DMU-specific solutions should be used as an attention directing device.
Summary of Input Targets
The Exhibit 2 has the changed and suggested levels for Inputs. The decision makers of the firm can take the input targets as suggestions to scale up or scale down their specific size. This can help the firm get closer to a maximum permissible scale efficiency of 1. This is because, although these are very similar firms, they still operate on different technologies; nevertheless they provide a starting point and give a basic idea for the direction and extent of change required to achieve operational efficiency.
Summary of Peers
According to the DEA technique it is possible for a pharmaceutical firm (DMU) to become efficient if it achieves exceptionally better results in terms of one output, but performs below average in terms of other outputs. An easy way to test these kinds of efficient units is by identifying the peers for inefficient units. As for the understanding of the researchers the term peers is used in the context that, if the inefficient DMU was to scale up or scale down its inputs, according to the suggestions, then it can come in the vicinity of the virtual firm and hence be considered “an equal” or a “peer” to the constituent firms in its neighborhood. If the unit is genuinely efficient, it is expected that there are some inefficient units in its vicinity so that it is considered a peer for these inefficient units. However if the unit is not a peer for any efficient unit, its best performance is questionable. See Exhibit 3.
5 Discussions and Conclusion
The efficiencies of the companies that we have tried to compare and contrast in this paper present interesting facts. The DMUs that are performing well show inefficiencies and the not-so-well-performing DMUs show higher inefficiencies that can be attributed to the fact that efficiencies change over time (Talluri, 2000). By “doing well” the researchers mean in terms of performance against competitors in their respective markets (i.e., market capitalization) and not in the conversion of inputs to outputs, which DEA is concerned with. This is attributable in part to the fact that a firm’s performance is governed by both the interactions with micro and macro environment and also on the relationship that it develops with its supply chain partners. This fact is key to a good performance as the recent news report highlight the importance of marketing representatives’ influence on the drugs that are prescribed by the doctors.
There is also evidence both from the analysis and outside sources, which suggest that the benefits of technological improvement are decreasing (Boldrin, Levin, 2005). They suggest that the technology operated by the pharmaceutical industry – the manufacturing method, used to make medicines and provide them to ultimate consumer, meet the conditions of constant returns to scale. That is, the cost of the hundredth batch of medicine is about the same as that of the first.
So the old assumption that a new technology platform for testing drugs will simplify the process and bring long-term benefits to the pharmaceutical industry has now lost its validity. Hence the policy suggestions that would help the industry to gain global dominance are that, apart from the FDI cap removal, they can provide tax benefits on R&D because the benefits provided by them are decreasing. Exports need to be more stressed.
The analysis can also be used by investors and venture capitalists and the like to select which firms to invest in.
6 Scope for further research
Alternative Methodology and Selection of Firms
The alternative approach could have been to select firms that are in the same risk class of the top firms. However, in that case, it would have been hard to find firms, since it would require a thorough analysis of the firms’ fundamentals to come up in case they were put in the same risk buckets or not.
Accounting figures and practices
The researchers have tried as far as possible to maintain similarity of the figures used. All facts were taken from recognized authentic sources. However, for the lack of uniform measurements (e.g. financial year ending in March for some and December for others) and different accounting assumptions taken, there would be some acceptable deviation from the actual figure. However, as our technique does not take into account the production function used to convert inputs into outputs, the effects of variations are reduced, since more than half the companies are from bulk pharmaceutical companies’ sector or from the mass generic drugs sector of India.
Alternative formulations of DEA
The formulation used by the researchers is well-recognized and time tested. There are certain variables we have not looked at. A solution for that is to complement the current analysis with a model to take in consideration returns to scale and uncertainty.
7 Exhibits
Exhibit. 1
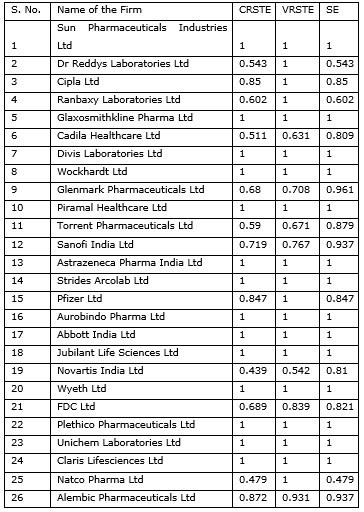
Note: CRSTE = TECHNICAL EFFICIENCY FROM CRS DEA; VRSTE = TECHNICAL EFFICIENCY FROM VRS DEA; SCALE = SCALE EFFICIENCY = CRSTE/VRSTE’
Exhibit. 2
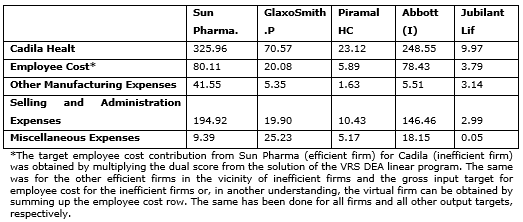
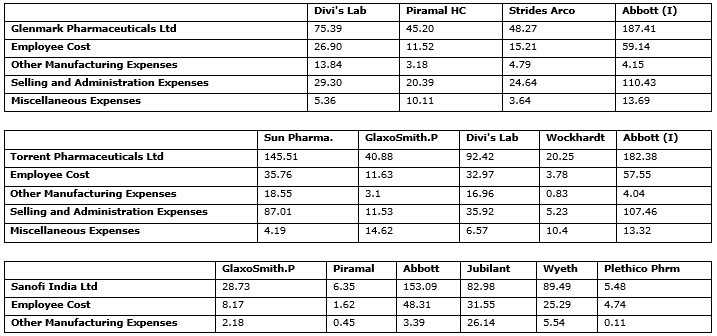
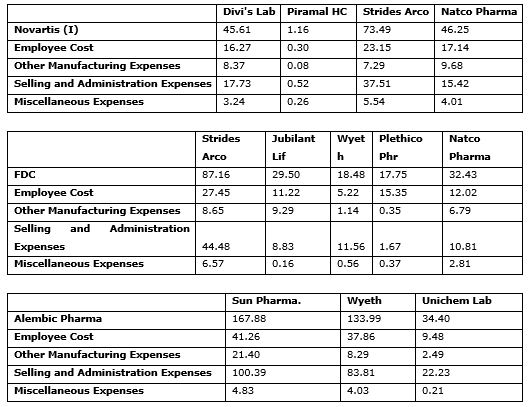
Exhibit. 3
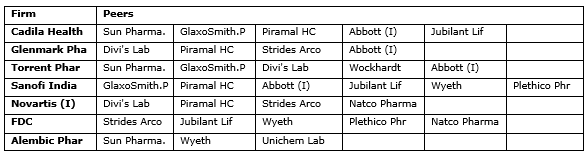
Exhibit. 4
The Input data for chosen firms from our secondary data sources
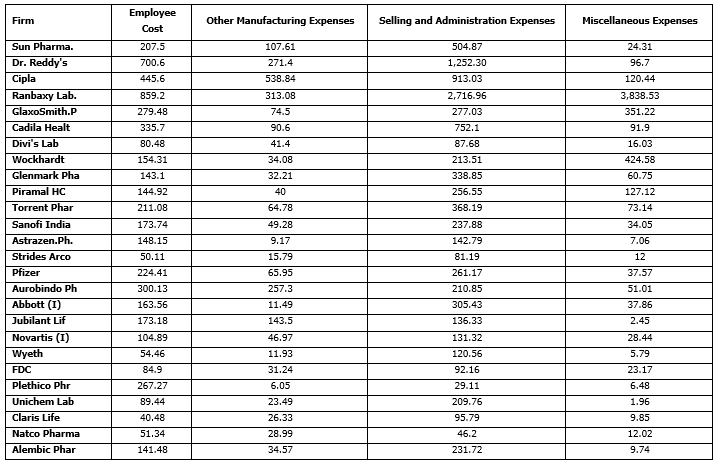
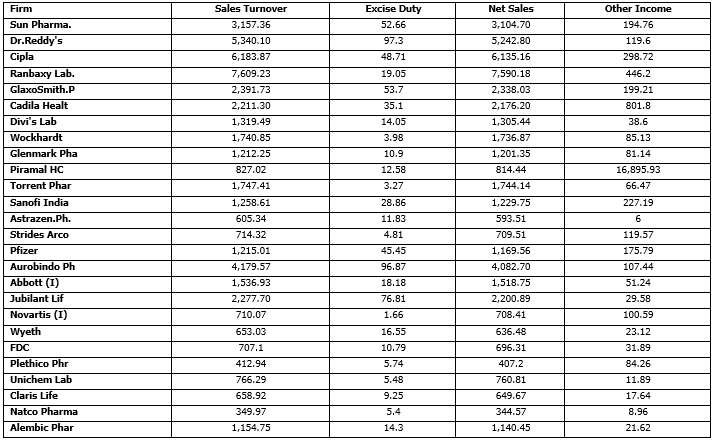
Exhibit. 5
The Output data for chosen firms from our secondary data sources
References
Majumdar, SK. (1994), “Assessing firms capabilities—theory and measurement—a study of Indian pharmaceutical industry”. Economic and Political Review, Vol. 29, No. 22, pp. 83-89.
Farrell, M.J. (1957), “The measurement of productive efficiency”, Journal of Royal Statistical Society, Vol. 120; No. 3, pp. 253-281.
Charnes, A., Cooper, W.W., Rhodes, E. (1978), “Measuring the efficiency of decision-making units”, European Journal of Operations Research, Vol. 2, pp. 429-444.
Charnes, A., Cooper, W.W. (1962), Programming with linear fractional functionals, Naval Research Logistics Quarterly, Vol. 9, pp. 181-185.
Coelli, T. (1996), “A guide to DEAP version 2.1: A data envelopment analysis computer program”. CEPA working paper 96/08. Banker, R., Charnes, A., Cooper, W.W. (1984), Some models for estimating technical and scale inefficiencies in data envelopment analysis, Management Science 30, 1078-1092.
Talluri, S. (2000), Data Envelopment Analysis: Models and Extensions Data Envelopment Analysis. Decision Line, May. Boldrin, M., Levine, D. K. (2005), Against Intellectual Monopoly, disponível em: http://levine.sscnet.ucla.edu/general/intellectual/against.htm (Acesso em 03 May. 2015)
[1] Facts and figures correspond to as reported in annual reports of GlaxoSmithKline, Ranbaxy, Cipla (2009-10 and 2010-11) and Asia-Pacific Business & Technology report in October 2011 and Corporate catalyst India 2012 report.
[2] Provided the activity does not attract compulsory licensing or involve the use of recombinant DNA technology and specific cell/tissue targeted formulations.
[3] The TRIPS agreement of the WTO is also noteworthy for being mentioned here as the Doha declaration 2001, President's Emergency Plan for AIDS Relief (PEPFAR) 2003, and subsequent revisions of the agreement have led to changes in the role patents played in maintaining high drug costs, export of drugs and drugs for dealing with public health crisis.
[4] http://www.capitaline.com is a reputed online database.