Classification of R&D infrastructure models in basic business incubators technology in the state of Paraná
Izabel Cristina Zattar1; Gilberto Passos Lima1; Vanessa Ishikawa Rasoto2; Vítor Felipe e Silva de Oliveira Nery1
1 Universidade Federal do Paraná
2 Universidade Tecnológica Federal do Paraná
Abstract
Support for the development of new technology-based business is a major challenge in Brazil. One reason is the change of the paradigm of an economy based on supply of commodities to an economy of developing and offering technology. In this environment, business incubators are presented as a key player in this process. However, incubators lack of infrastructure available for the technological development of products, as entrepreneurs begin to demand something beyond basic infrastructure. This article aims to classify research and development infrastructure models, based on the degree of importance earned by entrepreneurs belonging to incubators of technology-based companies in the state of Parana. An extensive literature review identified seven research infrastructure development models and discrete manufacturing products. These models were then classified by their features and practices. Following, a hierarchy was built, using the Analytic Hierarchy Process (AHP). Based on this hierarchy, an electronic questionnaire was designed and it was applied to 115 entrepreneurs belonging to 15 incubators of technology-based company, all located in the state of Parana. The responses were used for the construction of the weights of criteria based on the characteristics and analyzed practices. Finally, seven models were classified according to the AHP, providing incubator managers with the best options of laboratory models, according to the characteristics and needs.
Keywords: Analytical Hierarchical Process; Incubators; Research and Development.
1 Introduction to parks and technological incubators
The construction of environments that expand the possibilities to innovate and favor the development of this culture is part of the political agendas of developed countries, such as the United States of America (Salermo et Kubota, 2008) and (Nascimento, 2011). Among these environments are technology centers, business incubators, pre-incubators and regional innovation systems (SRI). Pre-incubators are environments commonly located in universities that provide support to new entrepreneurs to build a study of technical and economic viability of the business, business plan, marketing and strategic planning and, in some cases, support for the development and teste of prototypes.
Pre-incubators, incubators and Technology Parks have the same goals: to encourage the creation of companies that are closer to university and the market and to stimulate entrepreneurship (Sahut, 2014) and the creation of new products and services (Nascimento, 2011). Business incubators (Pereira et al., 2010) have the vital role of enabling research and the development of new products, serving as instruments of support and strengthening of innovation systems of which it is part. However, these issues happen at different stages of business development. The first occurs in its design; the second at birth and in the early years of the company and; the third in the maturing of the enterprise.
Therefore, similar to an incubator, a Technology Park is a real estate developed to house both innovative companies directed to the market and science and technology institutions, whose missions are related to the production and sharing of knowledge (Horácio, 2008). According to Annerstedt et Haselmayer (2004), the first, second and third generations can also be grouped in Technology Parks. The first and second generation parks constitute an extension of universities, housing companies created from research projects conducted there and; for the second generation incubators, decision making under the projects that will there joining considers targeting the market. The third generation encompasses the concepts of the previous two generations, being managed by professional experts in support of innovation. To consolidate the relationship between the generation of knowledge and these environments favorable to the creation of new businesses, some research infrastructure and development models are presented below.
2 Infrastructure of R&D models
This paper intends to deepen the study on seven of the models mentioned above. The models were selected according to the availability of information and publications available. The analysis was carried out in laboratories of companies, university laboratories and research institutes, laboratories providers of R & D services, remote laboratories, virtual laboratory, multi-user laboratory and the FabLab concept of the Massachusetts Institute of Technology (MIT).
In order to identify key R&D infrastructure characteristics, models used worldwide, own laboratories, universities laboratory and research institutes, laboratories that are service providers, remote, virtual, FabLab and multi-user are presented below (Table 1).
Table 1. Model laboratories identified in the literature
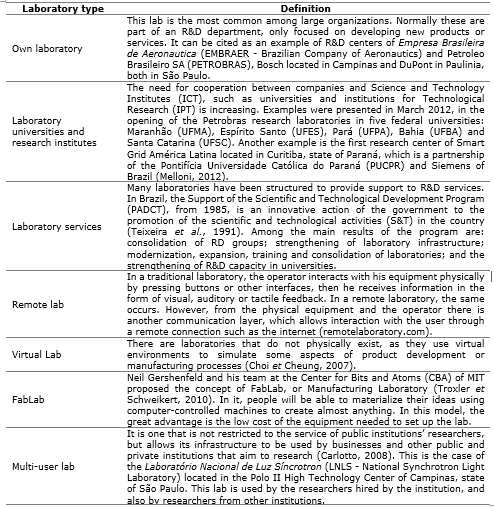
Source: The authors
The common factor between the selected models is the fact that its R&D activities are carried out in laboratories. Thus, an R&D laboratory is a place with the infrastructure necessary to carry out R&D scientifically. This infrastructure can vary according to the purpose of the lab, but according to the National Academy of Sciences of the United States (NAS, 2000), a successful laboratory is one that offers: flexible and efficient laboratories; security to its employees; it is compatible with neighboring environments; it has support of the local community and government agencies and; it is built seeking cost efficiency.
3 Innovation system in Paraná state
Through a documentary survey it has been identified research and development institutions of Paraná, belonging to the Cadastro de Informações Institucionais (CADI – Institutional Information Register) of the Lattes Platform, of the Conselho Nacional de Desenvolvimento Científico e Tecnológico (CNPq, 2012 – National Council for Scientific and Technological Development) and the list of Higher Education Institutions and Registered Courses (EMEC, 2012) of the Ministério da Educação (MEC – Ministry of Education). This survey was used to focus on the present work in those institutions that are most active in research and development.
Then the incubators of technology-based companies, also located in the state of Parana, were presented. Table 2 presents the main institutions of the state of Paraná R & D.
Table 2. Leading R&D institutions of the state of Paraná
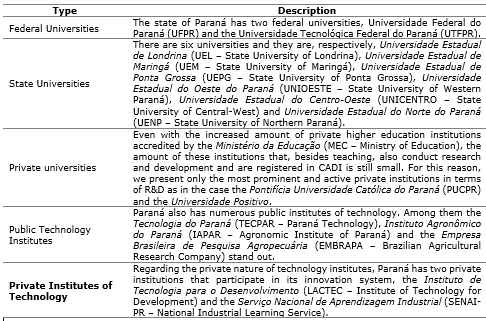
Source: The authors
Some of the incubators were unrelated for not having, at the time of survey, companies that meet the search criteria, i.e. technology-based companies excluding those unrelated to the discrete manufacturing, such as agricultural, biological and computer-programing technology.
4 Incubators technology of Paraná
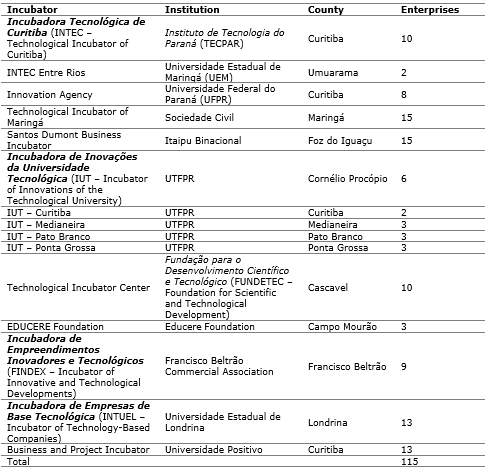
We present below a summary of the Technological Incubators located in the state of Paraná. Some of them were not included in this study because they have no business with the characteristics set out in the restrictions of work, that is, technology companies whose products are classified into the discrete manufacturing. Table 3 shows the incubators, supporting institutions, municipality and the number of companies invited to participate.
Table 3. Summary of the relationship of the incubators surveyed
5 Analytic hierarchy process (AHP) method
The AHP has been applied and studied in various situations where quantitative and qualitative parameters are necessary in the decision-making process. The AHP (Grimaldi et Crivelli, 2009), (Ho et al., 2010), (Lee, 2010), (Tramarico et al., 2015) and (Zhu et Xu, 2014) was created in the 1970s by the mathematician Thomas L. Saaty, and was popularized in the resolution of complex multi-criteria problems. The methodology allows troubleshooting via prioritization of possible alternatives (Saaty, 1991) and (Saaty, 2005). It is an analytical methodology, following a decomposition strategy of a complex problem in p minus complex according to a hierarchical structure.
The decision making using AHP is divided into four stages (Saaty, 2005):
-
Definition of the problem and the type of knowledge needed to solve it as objective already presented in the first chapter.
-
Structuring the hierarchy of the top decision-making process with the aim to make a decision by typically subdividing the alternatives from the intermediate levels to the lowest level.
-
Construction of the headquarters of peer comparison using the top element to compare the elements in the level immediately below.
-
Use the priorities obtained from the comparisons to consider the priorities of the elements immediately below, for all the elements of the structure, from top to bottom, to obtain the priorities of the lowest levels.
The validation structure (Hierarchical) can be performed in many ways. The authors suggested the participation of a group of people with knowledge on the subject in order to assess whether it is logical and complete.
6 Methods
a) Calculation of the population and sample. The state of Paraná has 15 technology-based incubators, and there are approximately 115 businesses that cater to the scope outlined in this research. Using the formula for sample size calculation with a confidence level of 95% (Z = 1.96); estimated standard deviation of the population during the test with the methodology equal to 4; population size of 115 companies and admitted sampling error of 2, the estimated sample size is 13 companies to be surveyed by a questionnaire.
b) Hierarchy of classification requirements of laboratories models. The development process of the methodology adopted in this scientific work began on the construction of the hierarchy, Figure 3. It was drawn from the research and development laboratory models studied in the literature. At the top of the hierarchy lies the purpose of analysis, in this case, the R&D infrastructure to be evaluated. The second and third levels compose the decision criteria and are formed by the competence, means of access, outcomes and cost/benefit, which will be discussed below. These criteria have been identified based on the laboratory model surveyed.
• Skills: it refers to the support staff to the lab. These can be the result of cooperation with universities and research institutes, that is, where there is any doubt or question, it is sent to one of these institutions to collaborate in solving the specific problem of the entrepreneur. It may also be available through a network of laboratories; thus, when a problem arises, anetwork of cooperation with other laboratories can be accessed to resolve it. Or, a competency may be available in the laboratory. In this case, employees are hired or linked to the laboratory without the need to consult external expertise.
• Access: addresses how the laboratory is used. In this case, it can be shared exclusively, remotely or virtually. The shared laboratory is as the name defines a laboratory that is shared among users, usually with concurrent use. On the contrary, the exclusive laboratory is aimed for the private use of the entrepreneurial team, not being shared by others during the same period. The laboratory can also provide remote access to machines and equipment, allowing its operation through the World Wide Web. Virtual access, in turn, enables entrepreneurs to plan, design or test the manufacture of their products in a virtual environment using computer programs designed specifically for this purpose. The same laboratory model may exhibit more than one type of access, as for example, the university laboratory.
• Results of the use of a laboratory: these can become sensitive or may be disclosed between users and employees thereof. In this sense, the dissemination of results among users can contribute to the development of other products, allowing avoiding design errors that may occur on other occasions. The confidentiality of information, on the other hand, does not permit disclosure of the peers’ results, keeping knowledge a secret, thus, not contributing to other projects. Laboratories of universities usually publish their research results, and, private laboratories tend to keep their research secret to obtain protection by filing patents.
• R&D Infrastructure: it can be classified according to its cost/benefit. The cost is related to the amount paid to use the infrastructure. The benefit is represented by the quality of results. In this work, the quality of the results and the cost were considered directly proportional. Figure 1 shows the hierarchy proposed. This hierarchy was represented horizontally for optimal viewing. Thus, the goal located at the top of the hierarchy is represented to the left side of Figure. On the right, there is the alternative structure; in this case, R&D infrastructure models. Finally, in the center, the criteria and sub-criteria in order to connect alternatives.
Figure 1. Hierarchy of classification requirements of laboratory models
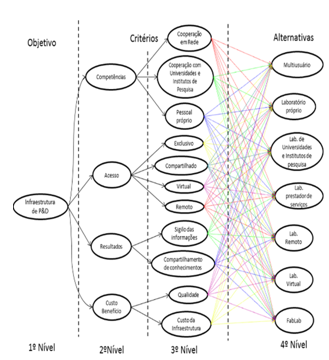
Source: The authors
The methodology chosen for the data collection was the questionnaire, and the three steps for its development were the project, the first version’s definition and review, pretest and final editing. After detecting problems with the interpretation and the original questionnaire format, it was decided that, in the final version, the questions would be asked individually for each feature of the hierarchy, using a scale of 1 to 9, allowing parity comparisons where reason can vary from 9/1 to 1/9. The options were: none, minimum, small, large and absolute. Each of them has been considered with a corresponding weight as described in Table 4.
Table 4. Options and Weights
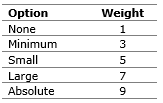
Source: The authors
By proceeding in this manner, it is believed that the questionnaire respondents were more intuitive, eliminating the problem of consistency indices greater than 0.1 for this part of the weights calculation. Still, in relation to calculating the weights used, are the geometric mean of the different responses to the same question, following the methodology. As the construction of the priority matrix is based on the ratios of the responses, there is also no change in the result, as the geometric average of the ratio is equal to the ratio of geometric means.
7 Results
The calculation of the parity matrix comparison was performed for each of the hierarchical levels, by dividing the geometric mean value obtained for a question by another. The following is the calculation of the peer comparison matrix for the issues Q0, Q1, Q2 and Q3, Equation 1. Only for this matrix it was necessary to reverse the position between Q1 and Q2 in rows and columns, then, to organize the questionnaire, the order of the questions was reversed. With this reversal, the matrices may be multiplied while maintaining the order of the criteria and results.
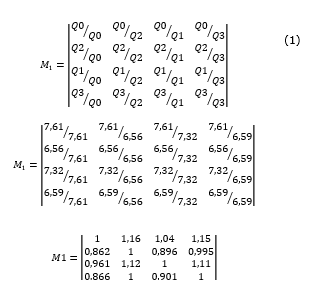
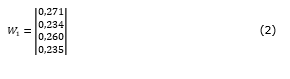
The corresponding eigenvector of the matrix M1 is calculated and shown in Equation 2.
In the same way, it was calculated from the respective arrays of parity compared to "Skills", "access", "Results" and "cost/benefit"; thus, this is the third level. With all the calculations and procedures, we came to the results shown in Table 5.
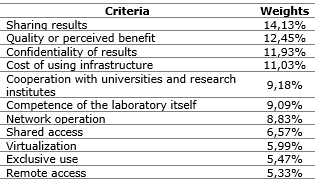
Table 5. Weights of the criteria of the third level of the hierarchy, sorted in descending order.
Source: The authors
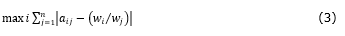
Following, the weights of the alternatives were calculated and this was the fourth level of the hierarchy. Unlike the questionnaire, it was decided not to use the weights of the answers, but to fill the comparison matrices directly with the values that can range from 1/9 to 9 as AHP (Saaty, 1991) method. As a result, some matrices showed consistency ratio (CR) above the value considered as a limit of 0.1 (Saaty, 2005). For those cases where the reason of consistency is big enough and justifies a review of judgments, two methods are suggested (Saaty, 2005). The first is the simple review of results with the largest absolute differences | a_ij- (w_i/w_j) |. The second alternative is to successively review the judgments by deviation from the quadratic root average using the ij lines and wi/wj. In this second option, one obtains the highest difference, according to Equation 3:
After finding the position where ij is the maximum, replace it with the value of reason, Equation 4:
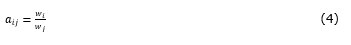
In this case, no matter if it occurs, this value exceeds 9. Repeat this procedure until consistency.
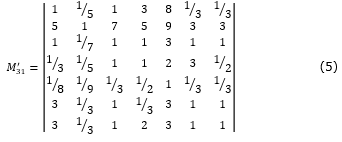
Based on the summary of the identification of the criteria in the researched laboratory models and part of the hierarchical structure presented above, the peer comparison matrix was filled up for the policy of cooperation with universities and research institutes. The order of representation of rows and columns is: own lab, university lab, laboratory services providers, remote lab, virtual lab, FabLab and multi-user laboratory. Thus, the following matrix was obtained. Equation 5.
Once the matrix is filled, calculate the eigenvector W_31 and the eigenvalue equation λ_max 6 for the value of the consistency index (CI) and the consistency ratio (CR), considering n = 7 and RI = 1.32. Equation 6.
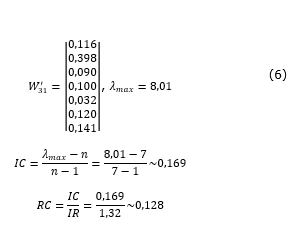
In this case, the value of RC is above the threshold of 0.1. Thus, it becomes necessary to apply the correct algorithm that allows comparisons parity matrix obtained with another RC≤0,1. After applying the algorithm, a new matrix is obtained, equation 7; as well as new values for vector self and self-worth, Equation 7.
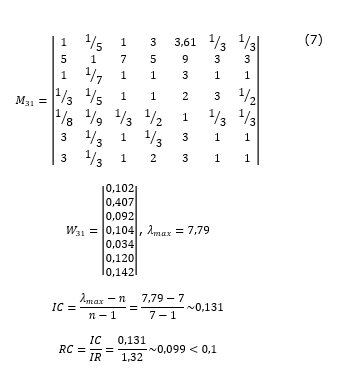
It is observed that, in this case, only the fifth column element in the first row has changed, indicating that the algorithm was applied only once, which is enough to obtain a value of RC≤0,1. There is also no need to maintain the reciprocity in order to apply to the array algorithm (Saaty, 1991). The same process was repeated for the other elements of the hierarchy to obtain all weight vectors of the alternatives for each criterion.
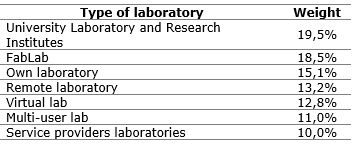
After calculating the weights of each criterion, in this case, characteristics and practices of laboratory models, it proceeds multiplying these vectors by the vectors of the immediately upper levels in the hierarchical structure. The results of the classification of research and development laboratory models are shown in Table 6 in descending order.
Table 6. Weights of hierarchy alternatives, sorted in descending order.
The last step of the process proposed in the research methodology for the AHP is a sensitivity analysis of the result. In the case of AHP, these values represent which of the criteria is more sensitive to changes that can lead to alteration in the results, i.e. reversing the order of any element due to the variation in their weights.
The method used in this paper is the one proposed by (Triantaphyllou et Sánchez, 1997). In this method, based on the criteria matrix (W_2) of the alternative matrix (M_3) and a results array (W_3), calculate the sensitivity of criteria. The results are shown in Table 7.
Table 7. The sensitivity of the calculation criteria of income, presented in descending order
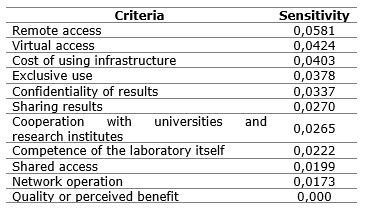
Looking at the results, the most sensitive criterion that may change the outcome is remote access. On the other hand, it is less likely to change the quality criterion or perceived benefit. This does not mean a limit that will change the result above; it only indicates a ratio relationship between the criteria that allows the classification of its sensitivity.
Therefore, among the most important criteria, in the opinion of entrepreneurs who responded to the questionnaires, there are two opposite issues: the sharing of the results in the first place with 14.13% and the confidentiality of results in the third place with 11.93%. Likewise, the quality (12.45%) and costs (11.03%) with opposite characteristics are the second and fourth positions in terms of importance for entrepreneurs.
It was also possible to calculate the sensitivity coefficients for the criteria used. The most sensitive laboratory type to change the criteria, i.e. one that can change the order of the result of the classification of alternative laboratory models is remote access. Moreover, the criterion that is less likely to change the order of the results is quality or perceived benefit. Thus, by increasing the weight of quality, all models will have their weight increased accordingly. However, as the vector sum of the weights of items must be equal to unity to increase the weight of quality criteria, some other criterion or criteria will have their values changed, thus changing the numerical result.
8 Conclusions
The objective of this research work has been achieved: it was possible to classify the laboratory models (own enterprises, universities and research institutes, contractors, remote, virtual, FabLab and multiuser) of the R&D infrastructure, objects of this study and the AHP method. This method proved to be effective in terms of supporting decision-making on issues that can be represented by a hierarchical structure. The model also allows its expansion, since it required the inclusion of yet another model of the R&D infrastructure that will not have to redo the entire analysis; only re-evaluate arrays of parity comparisons of the third level including the new model. The calculation does not have to be redone where inclusion is another criterion; only those branches of the hierarchy are influenced by it.
Thus, the AHP not only permits analysis of the problem, but also allows maintenance with very little effort. This characteristic is important when the variations of the parameters of the problems occur in short cycles.
Based on the opinions of entrepreneurs who participated in the survey and characteristics of each model taken as alternatives, the model that is best suited for operation in an incubator for technology-based companies is the laboratory of universities and institutes of technology. This classification is justified due to the factors presented earlier in the classification of criteria, where cooperation with universities and competence of own staff has great weight in this classification. Another factor is the cost of using the infrastructure, where public financing of facilities of laboratories and research institutes is significant.
A second option is the laboratory model created by MIT, the FabLab. This model has been applied in several countries and has been the subject of case studies found in the references presented in this paper. The strength of this model is the cost of its infrastructure, which tends to be cheaper than the R&D edge infrastructure and the competence accessed through its network of laboratories.
On the other hand, the models less attractive to entrepreneurs of technology-based business incubators are solely those service providers. The main weight that contributes to this low rate was the sharing of the results, which in laboratory services is negligible, leaving aggregate knowledge in the research and development process. While it is important for research work in universities, the multi-user laboratory model has little relevance to entrepreneurs’ incubated companies.
As limitations of the study may be pointed out, while the minimum sample number of thirteen questionnaires have been reached, the size of the population and the sample allowed do not use socioeconomic data to stratify the responses, obtaining partial results by state region; therefore, it can be a suggestion for future work.
References
Annerstedt, J., Haselmayer, S. (2004), “Third generation science parks. Why do the science parks go urban within the globalizing economy?”, paper presented at the XXI IASP World Conference on Science and Technology Parks, Bergamo, Italy.
Carlotto, M.C. (2008), Ciência como instituição e como prática: A mudança do regime disciplinar/estatal de produção e difusão do conhecimento científico no Brasil vista a partir do Laboratório Nacional de Luz Síncrotron, Dissertação de Mestrado em Sociologia, Universidade de São Paulo, São Paulo, SP.
Choi, S.H., Cheung, H.H. (2007), “Multi-material virtual prototyping for product development and biomedical”, Computers in Industry, Vol.58 No.5, pp. 438-452.
Grimaldi, M., Crivelli, L. (2009), “Intangible asset contribution to company performance: the "hierarchical assessment index", VINE, Vol.39 No.1, pp. 40-54.
Ho, W., Dey, P. K. and Lockström, M. (2011), “Strategic sourcing: a combined QFD and AHP approach in manufacturing”, Supply Chain Management: An International Journal, Vol.16 No.6, pp. 446-461.
Horácio, F. (2008), O Desafio de Implantar Parques Tecnológicos – Parte 3, Instituto Inovação, Rio de Janeiro, RJ.
Lee, S.H. (2010), “Using fuzzy AHP to develop intellectual capital evaluation model for assessing their performance contribution in a university”, Expert Systems with Applications, Vol.37 No.7, pp. 4941-4947.
MIT - Massachusetts Institute of Technology. http://web.mit.edu/. Access: 14th November, 2016.
Melloni, E. (2012), Parceria para desenvolver as redes inteligentes. Revista Valor Econômico. June and July.
NAS - National Academy of Sciences. (2000), “Laboratory Design, Construction, and Renovation: Participants, Process, and Product”, Washington, DC, USA.
Nascimento, D. E. (2011), Ambientes e dinâmicas de cooperação para inovação, 1 ed., Aymará Educação – UTFPR, Curitiba, PR.
Pereira, M.F., Assakawa, M., Uchida, K.K. and Oshita, M.G. (2010), “Incubadoras de empresas de base tecnológica como indutora das atividades econômicas regionais”, A Economia em Revista, Vol.18 No.2, pp. 185 – 196.
Remotelaboratory.com. Remote Laboratory http://remotelaboratory.com/about-remote-labs.html. Access: 13th November, 2016.
Saaty, T. L. (1991), Método de análise hierárquica. McGraw-Hill, Makron, India.
Saaty, T. (2005), “The analytic Hierarchy and analytic network process for the measurement of intangible criteria and for decision-making”, in Figueira, J et al. (Ed.), Multiple Criteria Decision Analysis: State Of The Art Surveys, Kluwer Academic Publishers, Boston/Dordrecht/London, pp. 345-405.
Sahut, J.-M. (2014), “Innovation, R&D and entrepreneurship”, Technological Forecasting and Social Change, Vol.88, pp. 287-289.
Salermo, M. S. and Kubota, L. (2008), “Políticas de Incentivo a Inovação Tecnológica no Brasil”, in De Negri, J.A. et Kubota, L. (Ed.), Estado e Inovação, IPEA, Brasília, pp. 13-66.
Teixeira, F.L.C. and Rappel, E. (1991), “PADCT: uma alternativa de gestão financeira para C&T”, Revista de Administração, Vol. 26 No.4, pp. 113-118.
Tramarico, C.L., Mizuno, D., Salomon, V.A.P. and Marins, F.A.S. (2015), “Analytic hierarchy process and supply chain management: a bibliometric study”, Procedia Computer Science, Vol.55, pp. 441-450.
Triantaphyllou, E. and Sánchez, A.A. (1997), “Sensitivity Analysis Approach for Some Deterministic Multi-Criteria Decision Making Methods”, Decision Sciences, Vol.28 No.1, pp. 151-194.
Troxler, P. and Schweikert, S. (2010), “Developing a Business Model for Concurrent Enterprising at the Fab Lab”, paper presented at the 16th International Conference on Concurrent Enterprising, Lugano, Switzerland, 8-11 March 2010.
Zhu, B. and Xu, Z. (2014), “Analytic hierarchy process-hesitant group decision making”, European Journal of Operational Research, Vol.239 No.3, pp. 794-801.