University of Sao Paulo – USP, São Paulo, São Paulo, Brazil.
Goal: to describe the current configuration of digital music distribution, and to give an overview of the business practices adopted by digital music outlets.
Design/Methodology/Approach: Longitudinal study using descriptive statistics and cluster analysis on two datasets collected in 2011 and 2018.
Results: Three clusters were identified in 2011: paid download, music streaming, and video streaming. Data shows that, in 2018, although streaming was the predominant technical mode, many outlets still applied the paid download business model (BM), and that cluster presented the highest survival rate. Large outlets used streaming, but the specialized ones still adhered to download, and catalog specialization and consumer behavior are the explaining factors.
Limitations of the investigation: Data was gathered from 70 digital outlets operating in two major digital markets, USA and UK, but some large ones, such as Korea and Japan, were not analyzed.
Practical implications: While a dominant technology prevails on mass markets, old technologies can still be adopted in niche markets, due to market limitations and consumer behavior. Thus, even in concentrated markets, small competitors can benefit from exploring segments with special needs that are not addressed by large players.
Originality/Value: There are few quantitative studies and longitudinal analyses on digital music business models.
Keywords: Creative industries, digital music, distribution
Recorded music was the first content business to be severely impacted by digital distribution (Lee et al., 2011; Moreau, 2013; Peitz and Waelbroeck, 2006), started by unauthorized peer-to-peer (P2P) networks (Beekhuyzen et al., 2015; Liebowitz, 2005), which distribute phonograms for free. Incumbents have faced three waves of disruptive innovations (Urbinati et al., 2019), and after facing a somber scenario and years of downturn, global music revenues started to show recovery since 2015, and digital music, which has steadily grown its share in global revenues since 2004, accounted for 54% of worldwide sales in 2016 (IFPI, 2017, 2018b).
Digital technology has changed the recorded music value chain: from vertically integrated conglomerates that dominated production resources and distribution channels, it has become a network of producers and distributors. On the content production side, it is comprised of big traditional companies (Majors) and small independent firms (Indies), independent artists, recording studios and specialized service providers. On the digital distribution side, it is now composed by content aggregators and digital outlets (Nakano and Fleury, 2017), with Apple Music and Spotify as the leading firms (Ipsos Connect, 2016).
During the initial years, file download was the dominant technical solution for distribution, but streaming now accounts for 70% of the digital market (IFPI, 2018a), well above the 50% threshold that the literature has used to consider a technology as the dominant alternative (Anderson & Tushman, 1990). Industry representatives asserted that the dominance of streaming over download is not just a matter of technology choice but a shift in the perceived value by users: file download is related to ownership, while streaming is related to access (IFPI, 2016). Thus, it is not just a matter of technology, but an association to the digital music outlets' business models (BM) (Chesbrough and Rosenbloom, 2002; Chi Chang, 2006) about how they use technology to deliver value to users.
In fact, digital music has been a testing ground for online business models and practices since the early 2000s (Choi and Perez, 2007; Naveed et al., 2017), and technical delivery modes have been tested together with several alternatives for pricing and revenue generation: price per downloaded unit, flat fee and unlimited file download, free streaming with advertising, flat fee streaming subscription, double pricing: free (with advertising or limited access) or paid premium access, etc. The technical delivery mode, together with the revenue source, has been often cited by practitioners as a key component of digital music outlets’ BMs. For instance, Agini (2012) cited as digital music BMs: pay per download, free music plus advertising and “all you can eat” subscription services (usually applying streaming), while the International Federation of the Phonographic Industry (IFPI) listed five different BMs in the digital music market: file download, subscription services, mobile market, cloud computing, and music video services (IFPI, 2012).
The literature has devoted attention to studying the effects of unauthorized file distribution, but not much to how digital outlets have evolved their business models and which ones have survived. Thus, this paper aims at two simple goals: to describe the current configuration of digital music distribution and to give an overview on the business practices adopted by digital music outlets. This can help not only those involved in the music business, but also other content businesses to define and develop their business models. To achieve the stated goals, a longitudinal study with two datasets collected in 2011 and 2018 was performed. In the first data collection, data from 70 digital music outlets was gathered from their websites, and a cluster analysis identified three business models: paid music download (28 outlets), free video streaming (17 outlets), and paid music streaming (25 outlets).
In 2018, data was collected from the same 70 digital outlets, to understand how they have evolved during the period. It was found that 36 outlets (51% of the first sample) were discontinued during the period, and 14 (20%) made changes in their business model. Interestingly, despite the fact that streaming is currently the preferred technical mode for music consumption, the largest group (16 outlets) still applies the paid download BM as in 2011, and this cluster presents the highest survival rate. Thus, although streaming is the dominant technology in market share, it is not the most adopted one in the sample. Large outlets use streaming, but specialized ones (e.g. classical music and electronic music) still adhere to download: catalog specialization and consumer behavior in specific market segments explain the fact. While the market has evolved towards a dominant solution for mass consumption, niches sustain outlets that provide for users’ specific needs. Thus, although the mass market is dominated by a few powerful players, there is room for companies that find market opportunities and explore niche markets.
The concept of BM has become hugely popular, both among practitioners and academics. It is a representation of how firms create and deliver value (Björkdahl, 2009); it connects technological development and value creation by articulating and providing information on how technology delivers value to customers. BMs identify target market segments, estimate revenues, costs and profits, and describe the structure and operating elements of a firm’s value chain (Chesbrough and Rosenbloom, 2002; Teece, 2010).
The term BM has been used in three different ways. First, as a framework that details the firm’s target customers and competitors, its products or services, and its activities and resources (Hedman and Kalling, 2003). It is usually translated into a synthetic, stylized report containing “structural templates on how a focal firm transacts with customers, partners and vendors” (Casadesus-Masanell and Ricart, 2010, p. 203), which are usually depicted in diagrams and worksheets.
Second, a BM is used to express a theme, i.e. an overall pattern that connects the technology, operational practices and market elements of a firm’s strategy (Zott and Amit, 2007). That usage results in typologies, broad categories that highlight strategic choices and specific business features that distinguish between firm groups. For instance, Zott and Amit (2007) have defined BMs as “design themes,” by which they mean broad categories that distinguish between value propositions.
Third, the term “BM” has also been used as a broad concept to express decisions and actions related to value delivery and profit making. An example is (Choi and Perez, 2007) the analysis on the impact of Internet and P2P networks on the phonographic industry. They have argued that P2P networks challenge incumbents’ business models, but, at the same time, P2P networks also have created opportunities for both new and incumbent firms to explore new revenue and profit-generating models, i.e. new BMs.
For 75 years, recording companies ruled the phonographic industry applying a simple logic: revenues were generated by format sales. However, from the late 1990s, digital technology has severely challenged that practice and their dominance. Although digital technology has been used in recording and production since the 1980s, it has only changed the music business when it started to be applied in distribution (Nakano and Fleury, 2017). Large scale digital music distribution was initially unauthorized, performed by file sharing in P2P networks, which threatened recording companies’ revenues: there was no need to buy a physical format to enjoy a phonogram or to borrow one to make a home copy; one could simply download it, for free, from the Internet.
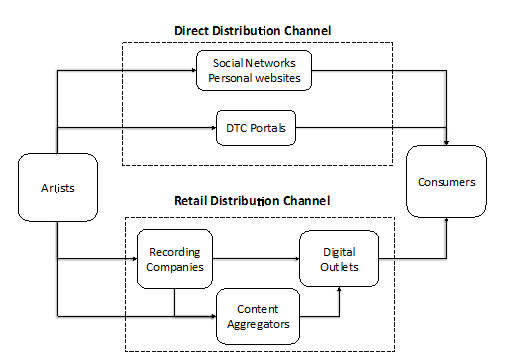
On the authorized side, digital music can be distributed directly from producers (artists) to consumers, using personal websites, social networks (Zhang, 2011), or “direct to fans” and “direct to consumer” (DTC) portals, which provide the service for a fee. It can also be distributed by digital outlets, which source phonograms from recording companies or content aggregators: large recording companies provide their releases directly to digital outlets, while musicians and small recording companies usually employ intermediaries (aggregators). These firms act as middlemen, gathering recordings from several producers, executing contracts to clear copyrights, and assembling bundles of songs to deliver to digital outlets. From one side, aggregators save transaction costs for retailers who do not need to handle a large number of singers, bands and labels; and on the other side, they provide market access to producers, especially independent artists. Figure 1 depicts the two main digital music authorized distribution channels: the retail and the direct channel.
Figure 1. Distribution channels in the digital music business
Source: author
Since the early 2000s, several business and revenue-collecting practices have been tested in the direct and the retail channels. With respect to the direct channel, the underlying belief has been that the music industry should undergo a profound transformation and that artists should be able to interact with their fans without constraints or control by recording companies. Free distribution through social networks such as YouTube and SoundCloud has also been used, usually to gain visibility, increase promotion and attract consumers to live presentations. In the case of social networks, not only artists, but also fans can upload music in the network.
The retail distribution channel also uses free distribution (usually combined with advertising) and file download charging unit prices, along with the subscription to file downloading or streaming services. Price discrimination is a frequent market strategy. Examples include providing users with free access to limited content while charging a fee to access full services, or charging different subscription prices for regular users and avid users. These outlets employ different technical delivery modes, namely, file downloads, audio streaming, and video streaming. Finally, mobility has also affected digital music market: smartphones allow not only the storage and playback of music files but also access to audio and video streaming.
Despite the early skepticism, digital sales on the retail channel have been growing continuously since 2004. The turning point was the launch of Apple’s iTunes Music Store in April 2003, as authorized outlets that existed at that time, such as Rhapsody and Pressplay, did not succeed in attracting customers. In contrast, the iTunes Music Store sold one million tracks in its first week and the digital share of the phonographic industry’s total revenues subsequently increased from zero to 56% from 2004 to 2018, reaching 5.2 billion dollars (IFPI, 2018a). Despite this fact, there is little information on how digital music BMs have evolved over time. Understanding this can illuminate the best practices and support other content businesses, such as literature and video, as music has been a testing ground for digital technology application in the creative industries.
To understand how digital music BMs have evolved, a two-phase quantitative research design was conducted: the first data collection and analysis was performed in 2011, the second, in 2018. In both phases, data on digital music outlets was collected from their websites and other sources. An initial sample of 70 outlets was selected in 2011, according to the following steps: since 2004, IFPI (the global body that congregates the largest phonographic companies and national associations) publishes an annual report on the digital music market, the Digital Music Report (now Global Music Report). From 2004 to 2011, except for 2009, reports contained a list of authorized digital outlets in several countries (Table 1 depicts the number of outlets in the IFPI reports during that period). All digital outlets operating in the USA and UK, listed from 2005 to 2011, were selected (although not all of them were actually based on the USA or UK).
In the 6-year period, 81 different stores from the two countries were cited, 73 of which were active at the time of the first data collection. Among the 73 outlets, two were found to be the same site with minor differences in the UK and US interfaces, another was a white label with no proprietary outlet, and one went out of business during the data collection period. Thus, the original sample was reduced to 70 digital outlets (9.2% of the total number in 2011). Five of the sampled outlets distribute only music from independent recording companies, 15 distribute specific music genres, and the remaining 50 are generalist outlets.
Table 1. Total number of online outlets in IFPI reports
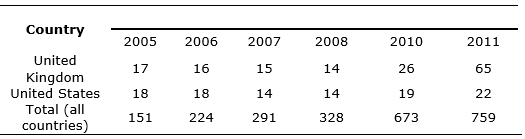
Source: IFPI reports
The BM encompasses the value proposition of a firm, its target market, overall cost structure, the revenue-collecting system, and its position in the value chain (Chesbrough and Rosenbloom, 2002; Teece, 2010; Magretta, 2002). A BM also defines resource supply sources, the choice between outsourcing or in-house operations, and the choice of distribution channels (Björkdahl, 2009). Thus, the BM articulates: (a) the Value Proposition (what is delivered and why it is valuable); (b) the Market Segment (who the customer is); (c) the main Cost and Profit estimates (how profit is produced); and (d) the firm’s Value Chain (where it is located).
During the period 2004-2011, IFPI reports described and analyzed digital music BMs. These texts evolved from the descriptions of a few outlets in 2004 to more sophisticated analyses of market trends and emerging practices in digital distribution. Those texts on digital outlets were analyzed to identify BM variables, words and phrases were collected, interpreted and reduced to elements. For example, the first report (2004) states: “Business models offering both subscription and à-la-carte options with a range of single track downloads, album downloads, track streaming and customized streaming services are thriving in the US and now growing in Europe” (IFPI 2004 p.7). From this quote, two elements were extracted: the technical delivery mode (download and streaming) and the revenue-collecting system or revenue model (subscription and à-la-carte). Because words and meanings evolve over time, effort was made to follow the constant comparison method (Glaser and Strauss, 1967): after the first extraction of an element, its meaning was verified on other reports.
Moreover, some elements were not clearly stated in the IFPI reports, but are cited in other texts or implied on the reports. For example, some outlets required the installation of a client program, i.e. a piece of software that manages the communication to outlet central servers. In addition, some outlets had software or hardware restrictions due to technical incompatibility. Both elements could be considered by users as a nuisance, and thus, client program installation and software restrictions were considered elements that affect costumer perception. After the identification of elements, they were related to the BM constructs, according to their nature. The final list, containing 16 elements, their values, and the corresponding BM constructs is provided in Table 2.
Table 2. BM Constructs and Elements
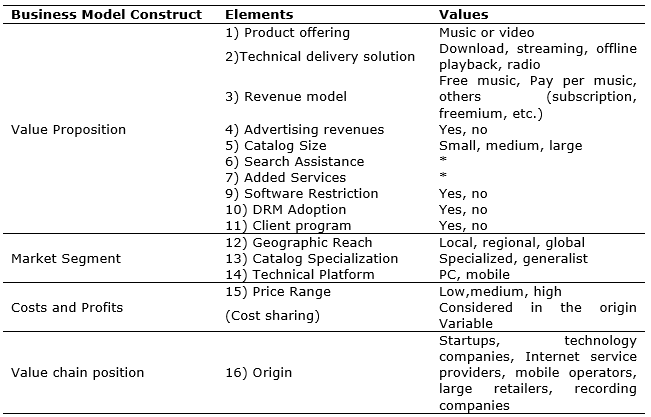
Source: author
To test BM constructs, the 16 elements listed on Table 2 were operationalized into variables. Ten elements—product offering, technical delivery mode, revenue model, software restriction, DRM adoption, geographic reach, catalog specialization, technical platform, client program, and revenue source—were converted into dummy variables according to the number of possible values.
To measure catalog size and pricing, three and four-point scales were developed. Catalog sizes were divided into small (up to 5,000 songs), medium (from 5,000 to 15,000 songs) and large (more than 15,000 songs). Price was measured according to the revenue model of the store: for instance, for pay per music stores, prices of the top ten downloaded songs of 2011 or, when those songs were not available, the store’s top ten downloaded songs were collected and a four-point price scale was developed for each revenue model. After the scales were developed, each variable was converted, according to the scale, into three or four dummy variables.
To assess the origin of the outlet, the typology proposed by Christensen (1993) was adapted: forward integrators, related technology, revenue generators, startups, and vertically integrated outlets. “Forward integrators” refers to companies that formerly performed upstream processes and started outlets to get closer to consumers and explore their current customer base (e.g. technology companies, such as Microsoft and Apple). “Related technology” refers to companies that dominate a technology base and use it to explore the music market (e.g. retailers, such as Amazon MP3). “Vertically integrated” companies perform all the functions of the production chain, from the production of content to its distribution (e.g. recording companies, such as Sony and Warner, which started Vevo). “Startups” are companies created to explore a new market. “Revenue generators” refers to companies that start a new music service using their current technology and customer base to enhance revenues (e.g. mobile operators and Internet Service Providers, such as AOL and Univision).
For search assistance and added services, composite ratio scales measuring the relative number of features presented by each outlet were built. For instance, for search assistance, four features were observed: search engines and suggestion mechanisms availability, publication of user reviews or ratings, top chart publication and playlist availability. The value of the variable was calculated as the percentage of features each outlet offers.
In 2011, data on each digital outlet was collected, resulting in a dataset containing 980 data records. A two-step analysis was performed: first, a cluster analysis on Boolean variables and then an ANOVA analysis on non-Boolean variables to assess whether there was any significant difference between the clusters from the first analysis (there were, in the variable set, only two non-Boolean variables: search assistance and added features).
The hierarchical cluster analysis on the Boolean variables, using Euclidian distance and the Ward method generated three groups, with 28, 17 and 27 outlets. Figure 2 depicts the resulting dendrogram. The ANOVA tests on the non-Boolean variables (Table 3) did not result in significant differences among groups (at 10% significance); thus, those variables were not considered relevant for cluster formation.
Figure 2. Dendrogram
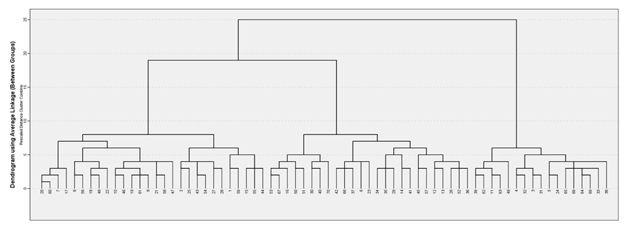
Source: author
Table 3. ANOVA results for non-Boolean variables

Source: author
Table 4. Chi-Square results for Variables
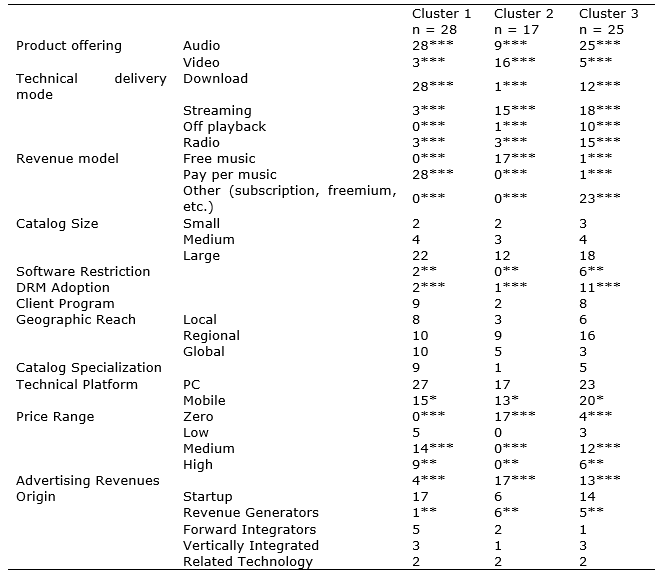
Source: author
Chi-square tests were conducted on each variable to analyze its relevance. Table 4 shows the results and the counts of each variable in the three groups. They showed that product offering, technical delivery mode, revenue model, software restriction, DRM adoption, and revenue source were relevant variables to differentiate clusters. Price range was significant on three of the four scale points, and origin was only relevant to one point. Catalog size, client program installation, geographical reach, catalog specialization and technical platform were not relevant. Thus, results suggested that there was a hierarchy of variables: some were primary, whereas others were derived or secondary variables.
Cluster 1: Pay per music Download (Download)
This group was composed by 28 outlets (40% of the sample). It was characterized by outlets that offered audio downloads using the pay per music revenue model. Only four of the outlets used advertising, and none of them offered free music. One outlet also offered audio streaming, and two outlets offered video streaming, and most of the outlets offered audio files that could be used on different devices. The members of this cluster adapted the old business model of selling singles and albums to the digital market, offering convenience and a large catalog. Among the outlets in this cluster were iTunes, Amazon MP3, and eMusic.
Cluster 2: Free Video Streaming (Video)
There were 17 stores in this cluster (24% of the sample). The majority of them—16 outlets—offered videos, and half of them also offered audio files. The most distinctive characteristic of this cluster was using advertising revenues to offset the zero price tag: all outlets in this cluster practiced the "free music and advertising" model. The predominant technical delivery mode was streaming; only one offered download. YouTube and Vevo were part of this cluster and one-third of the outlets were revenue generators, i.e. units of ISPs, portals, mobile operators, etc.
Cluster 3: Audio subscription and alternative revenue models (Streaming and Radio)
This group was composed by 25 outlets (36% of the sample); all stores offered audio files; only five of them also offered music videos. All technical delivery modes were present in this cluster, but streaming (72%) and web radio (60%) were the most common. The distinctive characteristic of this cluster was its revenue model: 23 outlets used subscription and its variants, and only one used a pay per music model. Half of the outlets also generated revenues from advertising, suggesting the use of the Freemium model or the advertising-and-subscription model. This group also had the highest number of outlets employing DRM and software restrictions. Spotify, Deezer and Rdio were part of this cluster.
In 2018, the websites of all 70 outlets were visited again, and data on the significant variables were verified for changes. Groups found in 2011 were analyzed to verify how outlets have evolved in their business practices. The overall survival rate is 49%, that is, 36 outlets have closed in the period, and there is variation between clusters: The download group presents the highest survival rate, 57%, followed by Streaming and Video groups, 48% and 41%, respectively. This is an interesting result: despite download, the preferred technical delivery mode in 2011 has lost its position to streaming, and the outlets in the streaming and radio group presented higher fragility. Moreover, the Download group, together with Video, presented a smaller number of outlets that had their business models modified, 14 and 13%, while 28% of the outlets in the Streaming group have adjusted their BMs (Table 5). The Download group is the most stable and resilient cluster, showing the lowest mortality and BM variation.
Table 5. Clusters and Surviving Outlet Numbers in 2018

Source: author
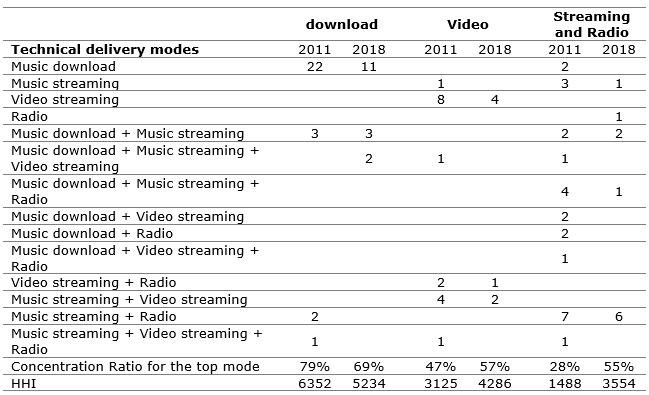
The outlets in each cluster offered and still offer different combinations of technical delivery modes. To assess whether the concentration on delivery modes has increased, two measures were calculated: the concentration ratio for the most used mode and the Herfindahl-Hirschman index (HHI) for each group and data collection year (The concentration ratio and the HHI are measures of market concentration. The Concentration ratio for the top mode is the percentage of the outlets that use it, the HHI for a monopoly is 10.000, and for a perfectly competitive market, it is zero. The HHIs above 2500 are considered to represent highly concentrated markets). The analysis shows that groups are very concentrated in one mode: the download group was the most concentrated and remains as such, although it slightly decreased its concentration from 2011 to 2018, and video and streaming and radio groups have concentrated sharply on few technical modes (Table 6).
Table 6. Technical Delivery Modes per Group
Source: author
During the period 2011-2018, the music market underwent significant change. After years of downfall, global sales started to recover in 2015, and have kept their upward momentum for the last three years. From 2004 to 2017, digital music share grew from zero to 54% (IFPI, 2018b), and after years of uncertainty, industry representatives sound optimistic. Interestingly, while the first impact was negative, another technology, blockchain, may disrupt the current scenario in favor of the producers (Arcos, 2018).
On the technical side. download, used by P2P networks and iTunes, the digital version of the traditional physical format purchase, was dominant in 2011, but has been overtaken by streaming, as fast internet connections became more reliable and ubiquitous. According to the IFPI report, streaming represented 70% of global digital sales in 2017.
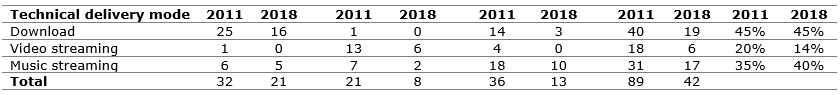
However, despite that dominance, most digital outlets still offer file download as the technical mode, usually combined to other ones: while large outlets such as Apple Music and Spotify use streaming, small outlets still use download. From 2011 to 2018, although the number of outlets in the observed sample has been divided by two, the proportion of outlets offering music download has not decreased, while video streaming has lost share to music streaming (see Table 7). The download group has been the most resilient and stable cluster, presenting higher survival and lower change rates.
Table 7. Number of Outlets Offering Technical Modes
Source: author (some outlets offer more than one technical delivery mode)
Catalog specialization is one factor to explain the fact: the download group has the highest number of specialized outlets (50%), their proportion in the video and streaming-radio groups are 14% and 36%, and among the 36 closed outlets, only two were specialized. Classical, electronic and dance music are the most frequent genres among specialized outlets, and the choice for download is related to customer preference. Classical music consumers are usually middle aged (Fernandez-Blanco et al., 2016) and a survey commissioned by the IFPI found that streaming is growing strongly among users under 25 years old (Ipsos Connect, 2016). For electronic and dance music, there is a specific market need: outlets provide content for DJs, who need music files to prepare their performances, and five among the eight specialized outlets offer content directed to the practicing communities of those genres.
BMs translate how businesses deliver value to their clients, and they have to be tailor made: while streaming became the preferred technical mode for most of the consumers, specific markets have supported the use of download, and several outlets serve those niche segments. In the same way, as Digital music distribution is evolving towards an oligopoly with a competitive fringe: a few large outlets serving the mass market and several specialized providers distributing to niche markets with specific requests, and in those segments, download is still the preferred technical delivery mode. This indicates that, although competition in mass market is intense, there are opportunities to be explored in niche markets, were specific consumer demand is not fulfilled by large outlets.
It is also interesting to note that there is no dominant platform, which can be explained by two factors. First, the existence of two ecosystems, Android and iOS, in the mobile market: despite the fact that large outlets, such as Spotify and Pandora, are present in both, in the iOS ecosystem, Apple’s streaming service benefits from the leader advantage of its download system, and it has been successful in keeping its position against its contenders (Verto, 2018). Thus, incompatible ecosystems have prevented the emergence of one dominant player to date.
The second factor concerns to the existence of digital intermediaries. Although digital music outlets are two-sided platforms (Hagiu, 2009; Rochet and Tirole, 2003; Rysman, 2009) that connect a producer network to a consumer network, they actually do not deal directly with each other: the producer side is mediated by a small number of agents called content aggregators, who deliver artists’ tunes to digital outlets. While the three majors negotiate directly with platforms on behalf of their cast of artists, small recording studios and independent artists make use of content aggregators to do the same. Both majors and aggregators’ strategy is to place their tunes on all digital platforms, to increase users’ probability of finding their artists’ tunes. Thus, in the digital music market, producer multihoming, i.e. the use of more than one platform (Doganoglu and Wright, 2006; Landsman and Stremersch, 2011) is the norm: early attempts by the majors to have exclusive outlets for their artists were rejected by consumers, who considered a nuisance to have to look into different sites to source their preferred tunes. Unlike other digital platforms, which need to attract both sides, music outlets actually deal only with the consumer side of the market, while majors and content aggregators deal with the producer side. As a result, the marginal cost to acquire one new tune is near zero for platforms, as intermediaries provide them, and for consumers, all platforms provide the same catalogs, thus the switching costs are low.
Therefore, in the digital music market there are two ecosystems, and a two-tiered structure where producers multihome without costs, which has prevented the emergence of one dominant player. Moreover, the market is also divided into a large mass segment of popular music and several small segments, because, as music genres are not perfect substitutes, they attract audiences with specific tastes and demands, thus creating niche markets that are targeted by specialized providers.
Findings also show that theory has overlooked the role of intermediaries such as content aggregators. They make multihoming easy and costless for producers, lowering switching costs for consumers. They provide opportunities for new contenders to quickly set their producer network, which became an incentive to new ventures, especially for those that have access to a network of consumers, like mobile operators and equipment manufacturers. Further studies can verify those findings in more online distribution value chains, such as video and film, and in different countries, to assess whether markets and business models present similar patterns.
Agini, S. (2012), Future Music Business Models: A Response. Available at http://dottedmusic.com/2012/audio-streaming/future-music-business-models-a-response/, [Accessed May 31, 2013]
Anderson, P. and Tushman, M. L. (1990), "Technological Discontinuities and Dominant Designs: A Cyclical Model of Technological Change", Administrative Science Quarterly, Vol. 35, No. 4, 604-633. https://doi.org/10.2307/2393511
Arcos, L. C. (2018), "The blockchain technology on the music industry", Brazilian Journal of Operations & Production Management, Vol. 15, No. 3, pp. 439–443. https://doi.org/10.14488/bjopm.2018.v15.n3.a11
Beekhuyzen, J., von Hellens, L., Nielsen, S. (2015), "Illuminating the underground: The reality of unauthorised file sharing", Information Systems Journal, Vol. 25, No. 3, pp. 171–192. https://doi.org/10.1111/isj.12069
Björkdahl, J. (2009), "Technology cross-fertilization and the business model: The case of integrating ICTs in mechanical engineering products", Research Policy, Vol. 38, No. 9, pp. 1468–1477. https://doi.org/10.1016/j.respol.2009.07.006
Casadesus-Masanell, R., Ricart, J. E. (2010), "From Strategy to Business Models and onto Tactics", Long Range Planning, Vol. 43, No. 2–3, pp. 195–215. https://doi.org/10.1016/j.lrp.2010.01.004
Chesbrough, H., Rosenbloom, R. S. (2002), "The role of the business model in capturing value from innovation : evidence from Xerox Corporation’s technology spin-off companies", Industrial and Corporate Change, Vol. 11, No. 3, pp. 529–555.
Chi Chang, C. (2006), "Business models for open access journals publishing", Online Information Review, Vol. 30, No. 6, pp. 699–713. https://doi.org/10.1108/14684520610716171
Choi, D. Y., Perez, A. (2007), "Online piracy, innovation, and legitimate business models", Technovation, Vol. 27, No. 4, pp. 168–178. https://doi.org/10.1016/j.technovation.2006.09.004
Christensen, C. M. (1993), "A History of The Rigid Disk Drive Industry : Commercial and Technological Turbulence", Business History Review, Vol. 67, No. 4, pp. 531–588.
Doganoglu, T., & Wright, J. (2006), "Multihoming and compatibility", International Journal of Industrial Organization, Vol. 24, No. 1, pp. 45–67. https://doi.org/10.1016/j.ijindorg.2005.07.004
Fernandez-Blanco, V., Perez-Villadoniga, M. J., Prieto-Rodriguez, J. (2016), Looking into the Profile of Music Audiences (ACEI Working Papers No. AWP-08-2016), Retrieved from http://www.culturaleconomics.org/awp/AWP-08-2016.pdf
Glaser, B., Strauss, A. (1967), The Discovery of Grounded Theory, Aldine, Chicago.
Hagiu. (2009), "Two-Sided Platforms: Product Variety and Pricing Structures", Journal of Economics & Management Strategy, Vol. 18, No. 4, pp. 1011–1043.
Hedman, J., Kalling, T. (2003), "The business model concept: theoretical underpinnings and empirical illustrations", European Journal of Information Systems, Vol. 12, No. 1, pp. 49–59. https://doi.org/10.1057/palgrave.ejis.3000446
International Federation of the Phonographic Industry - IFPI (2004). IFPI Online Music Report 2004. London.
International Federation of the Phonographic Industry - IFPI (2012). Digital Music Report 2012. London.
International Federation of the Phonographic Industry - IFPI (2016). Global Music Report 2016: State of the Industry. Global Music Report. Retrieved from http://www.ifpi.org/downloads/GMR2016.pdf
International Federation of the Phonographic Industry - IFPI (2017). Global Music Report 2017. Global Music Report. Retrieved from http://www.ifpi.org/downloads/GMR2017.pdf
International Federation of the Phonographic Industry - IFPI (2018a). Global Music Report 2018: State of the Industry. London.
International Federation of the Phonographic Industry - IFPI (2018b). Global Music Report 2018. Retrieved from http://www.ifpi.org/downloads/GMR2018.pdf
Ipsos Connect. (2016). Music Consumer Insight Report 2016. London.
Landsman, V., Stremersch, S. (2011), "Multihoming in Two-Sided Markets: An Empirical Inquiry in the Video Game Console Industry", Journal of Marketing, Vol. 75, No. 6, pp. 39–54. https://doi.org/10.1509/jmkg.75.6.39
Lee, D., Park, J. Y., Kim, J. et al. (2011), "Understanding music sharing behaviour on social network services", Online Information Review, Vol. 35, No. 5, pp. 716–723. https://doi.org/10.1108/14684521111176462
Liebowitz, S. J. (2005), "Pitfalls in Measuring the Impact of File-sharing on the Sound Recording Market", CESifo Economic Studies, Vol. 51, No. 2–3, pp. 435–473. https://doi.org/10.1093/cesifo/51.2-3.435
Magretta, J. (2002), "Why Business Models Matter", Harvard Business Review, May, pp. 3–8.
Moreau, F. (2013), "The disruptive nature of digitization: The case of the recorded music industry", International Journal of Arts Management, Vol. 15, No. 2, pp. 18–31.
Nakano, D., Fleury, A. (2017), "Recorded music supply network reconfiguration : the dual effect of digital technology", International Journal of Manufacturing Technology and Management, Vol. 31, No. 1/2/3, pp. 153-175.
Naveed, K., Watanabe, C., Neittaanmäki, P. (2017), "Co-evolution between streaming and live music leads a way to the sustainable growth of music industry – Lessons from the US experiences", Technology in Society, Vol. 50, pp. 1–19. https://doi.org/10.1016/j.techsoc.2017.03.005
Peitz, M., Waelbroeck, P. (2006), "Piracy of digital products: A critical review of the theoretical literature", Information Economics and Policy, Vol. 18, No. 4, pp. 449–476. https://doi.org/10.1016/j.infoecopol.2006.06.005
Rochet, J., Tirole, J. (2003), "Two-sided markets", Journal of the European Economic Association, Vol. 1, No. 4, pp. 990–1029.
Rysman, M. (2009), "The Economics of Two-Sided Markets", Journal of Economic Perspectives, Vol. 23, No. 3, pp. 125–143.
Teece, D. J. (2010), "Business Models, Business Strategy and Innovation", Long Range Planning, Vol. 43, No. 2–3, pp. 172–194. https://doi.org/10.1016/j.lrp.2009.07.003
Urbinati, A., Chiaroni, D., Chiesa, V., et al. (2019), "How Incumbents Manage Waves of Disruptive Innovations: An Exploratory Analysis of the Global Music Industry", International Journal of Innovation and Technology Management, Vol. 16, No. 1. https://doi.org/10.1142/s0219877019500068
Verto. (2018). Music Streaming Services.
Zhang, N. (2011), "The role of Web 2.0 applications on niche culture diffusion: An empirical study on the influence of online forums on fans of rock music", Online Information Review, Vol. 35, No. 5, pp. 734–746. https://doi.org/10.1108/14684521111176471
Zott, C., Amit, R. (2007), "Business Model Design and the Performance of Entrepreneurial Firms", Organization Science, Vol. 18, No. 2, pp. 181–199. https://doi.org/10.1287/orsc.1060.0232
Received: 17 May 2019
Approved: 14 Oct 2019
DOI: 10.14488/BJOPM.2019.v16.n4.a4
How to cite: Nakano, D. (2019), “Digital music, online outlets and their business models”, Brazilian Journal of Operations & Production Management, Vol. 16, No. 4, pp. 581-591, available from: https://bjopm.emnuvens.com.br/bjopm/article/view/858 (access year month day).