São Paulo State University – Unesp, São José dos Campos, São Paulo, Brazil.
University of the Pacific, Lima, Peru.
University of the Pacific, Lima, Peru.
Goals: This study focuses on assessing disaster risks in a typical inmegacity in Latin America. The baseline focuses on the logistics characteristics of the last mile, the vulnerability of buildings and the mobility of pedestrians.
Design / Methodology / Approach: A risk assessment procedure is developed using logistic metrics through a methodology that captures the most relevant urban information within a square kilometer, and two complementary methods that provide support to obtain metrics associated with the occurrence of disasters.
Results: The results show that the majority of blocks in the analyzed area have levels of precautionary risk due to their high level of store density, structure’s vulnerability, pedestrian movement and freight flow.
Limitations of the research: The main limitations for the data collection were the insecurity, the level of informality and the chaos presented in the studied area.
Practical implications: The main findings allow decision makers to know the most vulnerable areas of the place and, thus, propose recommendations for public policies based on urban knowledge. In addition, the proposed method can be taken as a reference to be applied to other zones of similar characteristics.
Originality / Value: This research develops a methodology that evaluates the risks and mitigates the impact on a specific unstudied commercial area, combining three existing methodologies to correctly asses risk on certain zones. This work is an extension of the work of Huivin et al. (2020); the added value is that it provides deeper literature reviewing that help decision-makers and researchers to know the actual state of the art.
Keywords: urban logistics, pedestrian mobility, humanitarian logistics, risk supply chain.
Human beings create, develop, and define artificial environments with a combination of both social and natural environments, also known as cities; using varied density patterns (Fernández, 1996), such as the number of stores per km², the dimension of the loading and unloading areas, the number of deliveries per hour, the average number of vehicles and disruptions per hour (Massachusetts Institute of Technology, 2018). At the same time, another environment exists; the natural one, which is made up of living and nonliving beings, that inhabit the planet, interacting with humans in a different manner. Balance and imbalance compete for the use of generated resources and are in permanent relationship (Fernández, 1996).
The distribution of the population is related to the patterns of settlement and dispersion within a country or region. The Instituto Nacional de Estadística e informática del Perú (INEI) is based on two quantitative criteria to delimit the boundary between urban areas and rural areas. All urban areas consist of one hundred homes grouped contiguously, except for district capitals and populated centers with two thousand or more inhabitants, where their homes are grouped contiguously, forming blocks and streets. The rural areas do not have more than a hundred dwellings grouped together as well as population centers with less than two hundred thousand inhabitants that have scattered housing (INEI, 2018a).
In 1960, the urban population represented 33.62% and it increased to 54.82% in 2017 (Banco Mundial, 2018a). On the other hand, the rural population decreased from 66.38% to 45.17% in 2017 (Banco Mundial, 2018b); in the same way, in the year 2050, an urban population of 68% is estimated (United Nations, 2018). Some of the rural population features are low population density and limited access to basic services, and they can be interpreted as vulnerable socio-ecological systems (Adger, 2000; Wilson et al., 2013).
The environment is deteriorating due to the use of space and the generation of imbalances, leading cause of events, such as air and water pollution, deforestation, riverbeds, and seas alteration from urban and rural populations, which have an impact on society (Fernández 1996). Several natural phenomena are generated as part of this change process, such as rains, temperature increase, melting glaciers, among others; as well as traffic, transportation, and pollution in urban areas.
There are two types of disasters, natural and human-caused, defined as sudden or foreseeable calamitous events that transform the functioning of a community, causing human, material, economic or environmental losses; overgrowing the capacity to address the situation with their own resources. Catastrophic events, which are caused by natural processes of the earth or nature, are known as natural disasters. The impact of a disaster is measured in economic loss, the loss of human lives, as well as the capacity to recover from them. For their part, natural disasters are categorized into five subgroups: biological, geophysical, meteorological, hydrological and climatological; it includes disasters such as earthquakes, droughts, floods, forest fires, among others resources (Leiras et al., 2014). Conversely, disasters that are generated by the action of men are known as anthropogenic disasters and are categorized into three subgroups: industrial accidents, transport accidents, and various types of accidents. In relation to the last one, there is a range of types of disasters caused by certain human activities, such as explosions, fires, oil spills, radiation, and air accidents, among others (World Bank, 2011). On the other hand, anthropogenic disasters, also cataloged as technological, are defined as those that are the product of intention, negligence, human error, failures or defects of technological applications. Among the most common are urban fires, chemical spills, pipe leaks, explosions, attacks and accidents (INEI, 2018b).
Worldwide, in 2017 there were 330 natural disasters in total, at least 20% more than the average of 275 occurrences from 2000 to 2016. That year experienced one of the highest economic losses generated by natural disasters, worth US $ 353 billion. Approximately 10,000 deaths from natural disasters occurred, with more deaths from these than in 2016 and 86% below the 2000 average. The most serious catastrophe was a massive landslide in Sierra Leone, causing the death of 1,100 people (Aon, 2018).
In Peru, during 2016, the number of emergencies at the national level grew by 19.6% due to natural phenomena and 19.1% due to man-induced phenomena, compared to 2015. The main causes of natural phenomena were the low temperatures, droughts, and intense rains; and urban and industrial fires caused by human activity (INEI, 2018b). Equally, around 80% of the population lives in urban areas, Lima concentrates 32% of the population and 45% of the country's internal product (Banco Mundial, 2016). This study focuses on Gamarra, located in the district of La Victoria, with 173,630 inhabitants (INEI, 2018c). It is considered to be a hazard area due to its urban characteristics, its large commercial proportion and the density of people during a common day. According to the INEI, there are more than 31,737 establishments, 71,484 people who work and offer a high number of services, supplies and other products related to the textile industry, including clothing and fashion at national and international levels, as well as other economic activities. Net sales in 2016 were USD 2,005 million and the expected daily visit of consumers was between 300,000 and 500,000 people (INEI, 2017). Regarding the profile of the people who attend Gamarra, 2,204,212 trips are made weekly. The most visited time is between 9 am and 11 am and most of its visitors are men, between 30 and 39 years old, from the A/B socioeconomic sector, who work in the area (MTC, 2018). The number of people could indicate a high density in the area, which generates threats, vulnerabilities and scenarios of adverse events or hazards.
Urban planners take into account location, distance, direction, orientation, linkage, and patterns (Herold et al., 2005); these are concepts defined quantitatively by metrics that evaluate the spatial configuration and the local attributes of the urban form (Angel et al., 2011). Likewise, disasters are a social phenomenon; and a key factor to overcome adversity is the resilience of communities (Holguín-Veras et al., 2012). In order to identify and measure a hazard as well as the exposure and vulnerability of people from certain areas, diverse tools used and studies are available to take into consideration. To determine danger to the inhabitants by means of indicators as the average speed of a pedestrian and the number of disruptions, the pedestrian mobility study is used. The Last Mile is a study that measures the level of exposure (Merchan and Lee, 2014; Merchan et al., 2015) of people in the final stage in a humanitarian crisis, in which the help resources are delivered; it proposes a framework, that establishes a baseline for the definition of geographic scale, centrality, and logistics-oriented metrics in order to establish urban logistics policies and metrics in one square kilometer (km²) as a suitable size for typifying a subarea in Lima with shop inventory, roads and regulations, delivery operations, disruptions, and traffic. Likewise, it is possible to quantify the degree of the population’s vulnerability located in certain areas, by using some current tools. In this research, the seismic vulnerability study of La Victoria City Hall was used in order to identify critical structures, and their status and location.
The basis for establishing future humanitarian logistics action plans, starting from founding social commitments in schools, churches, warehouses, government spaces, in order to engage the most vulnerable zones in the study area is to perform a risk assessment based on logistic metrics and apply them to the commercial area of Gamarra through methodologies within an appropriate context, which is the aim of this study. In this research, information was collected from such area; the relevant metrics were selected to improve a procedure that determines the risk level of every block in the focus area. These metrics also characterize “the block” inside a visual map and generate a set of introductory references for public policy in the zone and thus be able to minimize possible negative impacts.
The remainder of the article is organized as follows: first, the literature review is presented, then the methodology is described; after that, the calculation of the numerical values for all the metrics applied in the methodology is presented, the results are described below, a discussion of the research’s findings is presented, and, finally, the conclusions are exposed.
The risk of disaster has been studied by various authors. Carreño et al. (2007) proposed a risk management index to measure its effectiveness and performance, providing a quantitative measure based on qualitative objectives or benchmarks that must be met. Chan (2015) analyzed the effectiveness of Malaysia's flood disaster management system, considering risk identification, emergency preparedness, institutional capacity development, risk mitigation, and disaster risk financing. Likewise, Dodman et al. (2017) presented an analysis of both African urbanism and urban change. They show how those factors influence exposure to hazards and they contributed to the vulnerability of individuals, households and communities. Satterthwaite (2017) studied the scale of change in cities and the development challenge facing urban spaces in sub-Saharan Africa, as well as the potential implications of risk. Similarly, Mili et al. (2018) proposed a holistic model of utility to assess earthquake risk and determine priorities for risk reduction and management in urban spaces, which estimates the earthquake risk in each urban area, considering the hazard, vulnerability and response. Finally, Potter et al. (2018) presented the results of an online survey conducted to the public of New Zealand, in 2015, testing the influence of severe weather alerts on risk perceptions.
The grouping of hazards’ severity and regularity, the number of people, as well as resources exposed to hazards, and their susceptibility to being affected "(Risk = Hazard x Exposure x Vulnerability)" , is well known as the risk of a disaster (UNISDR 2015). Mitigation, preparedness, response, and recovery are the developed phases of disaster risk management that are defined by some authors (Altay and Green, 2006; Van Wassenhove, 2006; Holguín-Veras et al., 2013; Kaynak and Tuğer, 2014; Hoyos et al., 2015; Diedrichs et al., 2016). With the use of these four phases, an analysis of hazards, risks and future trends could be performed. In order to give an effective response, the main aim is to comprehend the risk of a disaster, strengthen its governance and increase preparedness.
A human phenomenon or activity that can cause loss of life or facilities and services, damage to environment or to properties, health impacts, social and economic interruptions, is well known as a hazard (World Bank, 2011). The mental or physical vulnerability means characteristics of a person or group in terms of their capacity to anticipate a hazard or human-caused disaster, cope with it, resist to it, and recover from its impact. A vulnerable population is made up of those who are able to reduce that source of vulnerability or minimize the risk of losses. On another note, the influence degree of danger is also known as exposure (World Bank, 2011), and its level varies with regard to its social group, sex, ethnic origin or another entity, age, among other factors (International Federation of Red Cross and Red Crescent Societies, 2018).
In a similar way, the risk of disaster has been included in the last mile study. Shah (2006) analyzed the scope of strategies formulated to reduce the risk of earthquakes in developing societies. Taubenböck et al. (2009) studied the integration of various scientific disciplines to contribute to an early warning system against disasters by combining flood models, analysis of urban morphology, population assessment, socioeconomic analysis of the population, and evacuation models. Additionally, Djalante and Thomalla (2012) studied how to apply past experiences in the implementation of disaster risk reduction activities to develop effective and appropriate climate change adaptation programs in Indonesia. Also, Taubenböck et al. (2013) presented an approach to transform the knowledge of a scientific study about the identification of risks into recommendations to carry out risk reduction strategies; this research integrates key findings with the experiences of an eyewitness in a prior risk event.
In the same way, recognizing the present risks and evaluating them, depending on their relative importance, is crucial for disaster preparedness. Faizal and Palaniappan (2014) present a framework based on the SCOR model presented by Chopra and Meindl (2017), prioritizing the existing risks by using the Failure Mode Effect Analysis (FMEA), which uses parameters, such as probability scenarios, impact, and the potential strategy to reduce the problem (Stamatis, 2003). On the other hand, Greiving et al. (2006) emphasize the importance that current risk assessment models must take into account all risks related to specific areas and need to determine their significance. For this, the authors perform a comparison between existing approaches, concluding that the existing literature considers subjective metrics rather than more objective ones. For this, Fritsche (2016) states that the logistic metrics in question should belong to one of the five inter-functional groups: information systems, sourcing, warehousing and transportation, inventory and production, and managerial level, in order to minimize the impact and frequency of disruptions in supply chains.
For urban logistics, risk assessment methods have become important benchmarks in recent years. Gonzalez-Feliu and Morana (2014) define a grid of indicators to measure the sustainable performance of urban pooling systems, combining an analysis of key performance indicators and a decision support methodology. They identified the main indicators that evaluate the sustainability of a given suburban area, such as service rate (influenced by satisfactory deliveries, or optimal delivery time), loading rates, among others, which are the main problems in today urban flows (Merchan, 2015). Because of this, many models that consider vulnerability have been developed. Simple simulation cases, such as those of Pearson and Gray (2001), or Kennan et al., (2009), or more complex multi-agents simulations regarding the interaction of stakeholders (Jiao et al., 2006) have begun to be more considered due to the need for transport chains to be more resilient (Taniguchi and Yamada, 2010).
On the other hand, the masses of pedestrians, which are studied in the present research for the determination of risk, have been studied for more than four decades (Oeding, 1963; Navin and Wheeler, 1969; O'Flaherty and Parkinson, 1972; Weidmann, 1993). Traditionally, the studies related to their mobility were applied during direct observation, photographs, films, and behavioral investigations (Hill, 1984; Batty, 1997) as evaluation methods. Maeda et al. (2009) proposed a method to create mobility scenarios of pedestrian flows, which focuses on the reproduction of the pedestrians’ behavior in sections of the city, shopping centers, etc. Vogt et al. (2012) developed a mobility model to understand the movement patterns of pedestrians in urban areas and Solmaz and Turgut (2015) presented a model of pedestrian mobility in theme park disasters, focusing on the scenario of evacuation.
More recently, pedestrian flows have been taken into consideration regarding the urban logistic decision-making process (Merchán et al., 2015). For this purpose, the existing literature presents, in many cases, opposing views of how sustainable urbanism compares the more traditional visions. One example of this is the research of Turón et al. (2017), which highlights the benefits and importance of more “pedestrian-friendly” cities, remarking the good practices implemented in different study cases. Wasson et al. (2017) present a methodology related to the prediction of pedestrian flows, given their current position and speed, which could help simulating possible scenarios for urban transport, helping decision makers in the process.
The square kilometer methodology helps characterizing the inmegacity of Gamarra, following the past work applied to Madrid, Bogota, Shanghai or Mexico D.F (Merchán, 2015; Merchán et al., 2015), while the pedestrian mobility methodology is a layer focused on the risk of the pedestrian in a crisis situation (Holguín-Veras et al., 2012, 2013). By combining both methodologies, a new specific characterization based on humanitarian logistics is presented. This approach can contribute to improve or reformulate the proposed public policies in order to reduce the pain and damages in a humanitarian crisis.
The urban characterization was realized over the collection of logistical data of the area through observations of the study area, and the segments that compose it. For this, the squared kilometer methodology was applied, proposed by Merchan (2015). With this framework the zone of interest is divided by representative segments, in which data collection and analysis is carried out. The proposal states that for a correct observation, it is necessary to identify and register the existing retail business, as well as routes and regulations. Thus, the following characterization forms are used
The second phase of the methodology consists of characterizing more variable factors, such as disruptions, the number of deliveries, and traffic count. For the purpose of the research, the following forms were considered appropriate:
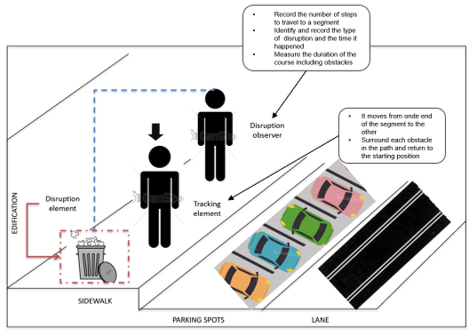
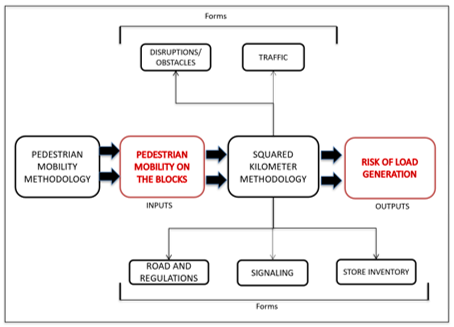
The pedestrian mobility framework was used to calculate and evaluate the risk of a determined zone given their urban flows. Their density per block and average speed was identified by using analytical tools, such as the Endomondo application. This characterization, along with the pedestrian mobility analysis, releases performance metrics and indicators that were grouped to assess the risk of load generation on the study zone, evidenced in Figure 1.
Figure 1. Square kilometer and pedestrian mobility framework
Source: Author’s own elaboration.
With the found variables to assess the risk, it is needed to identify the sources of vulnerability per block for the study zone. For this, sources of vulnerability data were found at The National Institute of Civil Defense (Instituto Nacional de Defensa Civil - INDECI for its acronyms in Spanish) and La Victoria City Hall. The vulnerability level considers the exposure of people and the infrastructure characteristics per block. Table 1 presents the building evaluation criteria:
Table 1. Evaluation criteria for buildings per block of La Victoria City Hall
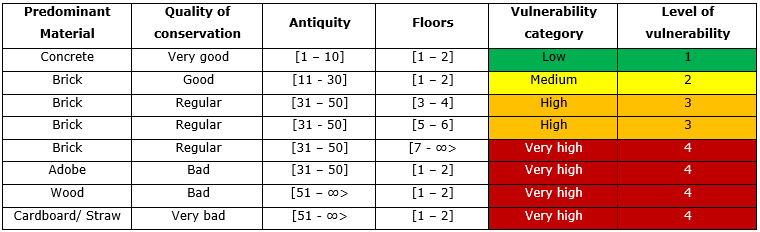
Source: Author’s own elaboration.
Regarding a well-known criterion, as shown on table 2, each studio provides data, which is qualified, using a detailed score that goes from 1 to 4. The result of each variable was weighted, considering the same weight, which is 20%, to obtain the index of each block.
Table 2. Evaluation criteria
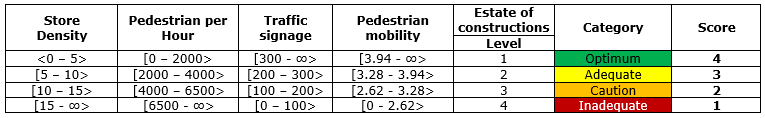
Source: Author’s own elaboration.
Since the methodology is applied to Gamarra, Peru, a range of specific numerical data will be considered to qualify the results of each variable, and it will be able to interpret them in an appropriate way to the real context.
When all the blocks have their results of metrics, then the weighting of the results in a representative number is carried out to evaluate the risk in each block (Table 3). According to the result of the index of each block, four levels of risk were defined: optimal, adequate, precautionary and inadequate.
Fractions of the range established from the minimum to the maximum possible index result are also known as the levels of risk. Four (4) is the best possible rating and one (1) is the worst possible. Given the range of values, an equitable one was considered for each fraction [1; 4]. At every 0.75 unit (3/4 = 0.75), a higher level of risk is taken into account; that is to say, that there are three units available for four levels of risk. The upper limit values of the division [1; 1.75; 2.5; 3.25; 4] are rounded up, as shown below:
Table 3. Levels of risk according to index results
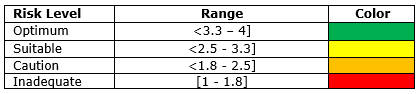
Source: Author’s own elaboration.
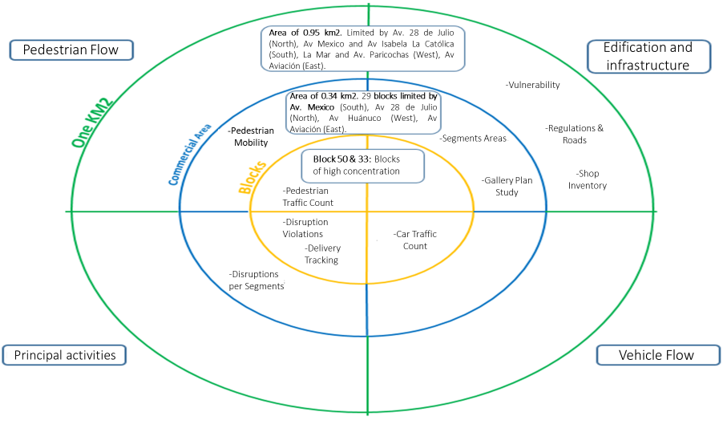
When the other metrics are set to the minimum and at least two of the five scored an optimum rating, it is known as the optimal level of risk. This means that before an adverse event, the quality of infrastructure of the block, as well as the stores’ density levels, pedestrians, signs, and the speed of people transiting are in an acceptable state. The following illustration allows a brief explanation in terms of how the entire methodology will be applied. The structure illustrated below will be followed and then some conclusions about the diagnosis made will be analyzed.
Figure 2. Risk of Load Generation. Steps involved
Source: Author’s own elaboration.
Considering the presented disaster risk methodology, hazard, exposure, and vulnerability were measured. The pedestrians’ mobility study was used to define the hazard with the velocity and disruption of the pedestrians. The Squared Kilometer framework was used to define the exposure of 70 blocks delimited by 28 de Julio Avenue and La Mar Street in the North, Mexico and Isabel La Catolica Avenue in the South, Aviacion Avenue in the East and Parinacocha Avenue in the West. The methodology established the inventory of stores, roads and regulations, and collected data of traffic, delivery of products, and disruptions. This allowed identifying the metrics observed in Table 4. The results of the observation are presented in Figure 3.
Figure 3. Characterization of Gamarra commercial zone.
Source: Author’s own elaboration.
Table 4. Methodology Metrics
Source: Author’s own elaboration.
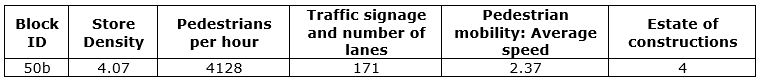
The research presented the information of each block. For example, the 50b block had an area of 12,056 m² (88m x 137m) and 493 stores and density of 40,89 stores/m² (without considering the number of floors in the facilities). Two signals in this km² were found, 92% of one-way roads and vehicle restriction. In Table 5 presents the pedestrian speed of 2,37 km/hour.
Table 5. Pedestrian speed in km/hour.

Source: Author’s own elaboration.
Table 6. Pedestrian count per hour

Source: Author’s own elaboration.
The average number of pedestrians transiting the block per hour is 4,128.
Regarding the evaluation criteria presented in the methodology section, the area of interest can be analyzed and classified. A variety of specific numerical data will be taken into consideration, since the methodology is applied to Gamarra, in order to qualify the results of every variable. The data will allow interpreting the results in a way that suits the actual context. It starts with the store density variable, which specifies that 20 m² is the average area per store in Gamarra, as stated by the field collection of the category of the shop inventory from the last mile studio, meaning that, as the average amount, five stores should exist every 100 m². It would receive a lower score, in the case of more stores. Secondly, there is the variable of pedestrian per hour, where the minimum and maximum data recorded are checked and divided into equitable quartiles, since the outcomes in a block are an average. In case of a disaster, there is a lower score in the evaluation if more people are transiting through the street and this will possibly affect the outcome. Thirdly, the variable of traffic signage, where a specific punctuation was given as a result of two significant factors, such as the number of lanes in the street, as a way of escaping, and the possibility of adequate traffic signage that drives the traffic. Fourthly, there is the pedestrian mobility variable, where 4.6 km/hr is the free transit speed. The minimum and maximum data were checked and weighted in quartiles, in order to acquire the evaluation range. Fifthly, the construction estate variable, where, in order to estimate the vulnerability level based on predominant material, the quality of conservation, as well as the age and number of floors in each block, the La Victoria City Hall criteria were considered. The result of every variable in block 50 is shown on Table 7, as an example of the index calculation:
Table 7. Block 50 metrics
Source: Author’s own elaboration.
Figure 4 shows that 70 blocks have their metric results, proceeding with risk evaluation on each block, weighting the results by a representative number. There are four risk levels, regarding the index result of each block: optimal, adequate, precautionary and inadequate.
Figure 4. Risk of Gamarra, Peru
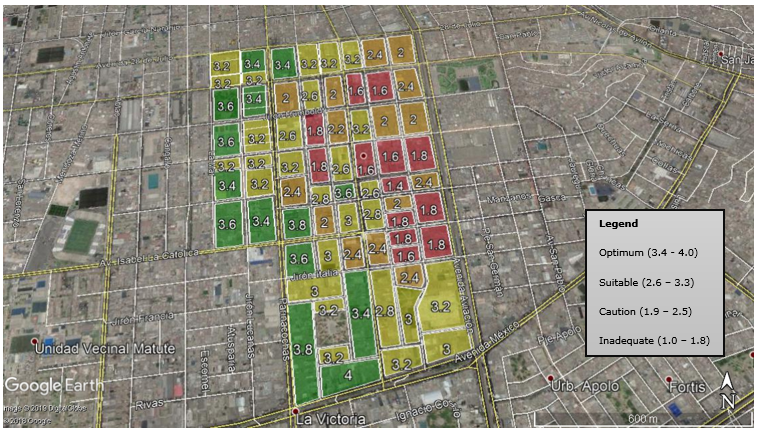
Source: Author’s own elaboration based on Google Earth Pro (2019)
When the rest of the metrics are adequate as a minimum and, at least, two of the five acquired an optimum rating, it is known as the optimal level of risk. That is to say, before an adverse event, the quality of infrastructure of the block, as well as the level of store density and pedestrians, signs, and the speed of people transiting are in an acceptable state.
The blocks that have an adequate level of risk are those that were distributed from the south to the central part of the km² and the ones that obtained the precaution or inadequate level of risk are the northeast and central east blocks. Galleries, street trading, and the large number of people transiting are characteristics of the center of the commercial emporium, and this is what is considered by this study.
The blocks have a high level of store density in this area. On average, it is more than 10 stores per 100 m², according to the qualification criteria. This means that the transit size is smaller than the recommended for the safety of the customers and sellers. Due to road disruptions, pedestrians walk at a speed lower than 3.28km/hr, compared to the free transit speed of 4.6 km/hr.
The results advise that there is a lack of traffic signs and that La Victoria City Hall considered the buildings highly vulnerable, in terms of infrastructure. The buildings have, at least, three floors or more on average; they are older than 30 years, and are in a bad state of conservation, according to the vulnerability study.
In Peru, the amount of natural and human-caused disasters has increased. The areas that are the most vulnerable are those that are not aware of the existing risks, hence, a planning process is not considered, especially in high urban density areas. This country has an accountable organization that is in charge of coordinating, facilitating and supervising the formulation and implementation of the National Policy and the National Disaster Risk Management Plan in the preparation, response and rehabilitation processes, known as The National Institute of Civil Defense. The training of public and private entities and the population are also under the accountability of this institution., In order to ensure the three processes, preparedness, response and recovery, they are being fulfilled and delivered.
One of the major aims is to make the population more aware of the levels of hazard, exposure, and vulnerability of different areas. By performing this, it is possible to reduce the risk of disasters. Disaster risk management, followed by training and information dissemination, which are part of all public policies and regulations, will be a valuable contribution to decrease the possible impact of a disaster and promote a risk management culture, especially in commercial areas, which have high urban density.
The level of existing disaster risk can be identified by weighing numerous urban factors in a certain area, through the methodology applied in this research. According to the urban characteristics and the logistical metrics of a specific place, the determination of new public policies that reduce disaster impacts can serve as a starting point, by the use of its application; its outcomes provide significant information that is useful for decision-making and the delivery of response actions and preparedness of the corresponding authorities and agencies. Different areas with dissimilar conditions, such as residential, commercial, among others, can apply this methodology.
Due to its characteristics, such as its population density, large commercial proportion, low pedestrian traffic speed, the lack of traffic signals, and highly vulnerable buildings, Gamarra, which is where this study takes place, is considered to be a hazard area; these characteristics are preconditions that generate threats, vulnerabilities and adverse event scenarios.
This work, compared to those mentioned in the literature review, uses simple methods that can be replied in other contexts without a bigger empirical effort. Results are also easier to interpret without losing their power as tools for designing policies and assessing risks.
Finally, it is important to apply this methodology in other stages of the humanitarian crisis, where risks are associated to other dimensions of the human activity; for example, these results can serve policymakers to assess the vulnerability of square-kilometer clusters during an earthquake and forecast the results in order to elaborate a technical-based contingency plan.
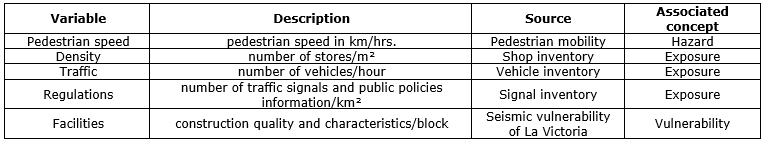
According to the literature review, logistical data have not been considered yet to assess disaster risks in a practical level; however, the current tools, which are based on historical, socio-economic, demographic, institutional and geographic information systems, have been taken into consideration for that purpose. Some of the urban characteristics that have a higher impact on the logistics flow of a city and the studios selected are: the population density, levels of commercial activity, and road infrastructure capacity. In order to assess the risk level related to each block, this study offers relevant metrics that are used for developing the risk assessment that work to characterize the study area.
In order to assure an appropriate degree of security for customers and employees, it is relevant to know the risk levels, major difficulties as well as the objective description of the area, since this research took place in the country’s main textile business center.
This research focuses its main contribution in the characterization of the studied area by means of a risk level evaluation with logistic metrics performed in each block for preventing disasters. This methodology provides an adequate risk evaluation, making it possible to go from urban to humanitarian logistics. In addition, in order to predict the risk in accordance with the established criteria, this research leads a wide range of logistical values, providing an extensive overview that defines the area of interest for the use of the information. After an actual field experience, a block-level visual map, along with the vulnerability levels found, was generated and serves as a preliminary step for humanitarian logistics. In the event of disaster, because educational or health centers are easy to identify, they can serve as shelters or collection centers.
Gamarra is an area of great population density, overgrowing 24 times more the number of establishments in a square kilometer (km²), in comparison to Jesus Maria, Lince or La Molina City Halls. Due to the reduced space for pedestrians to transit on, the lack of traffic signs, high density of stores and pedestrians, as well as a highly vulnerable infrastructure, this area presents a high level of risk and exposure; this is why it is recommendable to take measures in order to increase safety.
This research recommends the government to implement this methodology into the public policies. Nevertheless, it is advisable to take into account the logistic data collected in this research, in order to understand the urban behavior of the area and recognize the main difficulties, since there was a lack of relevant additional studies and project implementation related to risk prevention and communication to the population. This research also shows that the most relevant variable is the pedestrian speed in an area with disruptions, posing a challenge for the authorities in this high density area with a high potential for human loss.
Adger, W. N. (2000), “Social and ecological resilience: are they related?”, Progress in Human Geography, Vol. 24, No. 3, pp. 347-364.
Altay, N. and Green, W. G. (2006), “OR/MS research in disaster operations management”, European Journal of Operational Research, Vol. 175, No. 1, pp. 475–493.
Angel, S. et al. (2011), “Making Room for a Planet of Cities”, Policy Focus Report, Lincoln Institute of Land Policy, Cambridge.
Aon Benfield (2018), Weather, Climate & Catastrophe Insight, 2017 Annual Report, AON plc.
Banco Mundial (2018a), World Bank, Datos, Población urbana (% del total), available from https://datos.bancomundial.org/indicador/SP.URB.TOTL.IN.ZS (access Jan 02, 2019)
Banco Mundial (2018b), World Bank, Datos, Población rural (% de la población total), available from https://datos.bancomundial.org/indicador/SP.RUR.TOTL.ZS?view=chart (access Jan 02, 2019)
Batty, M. (1997), “Predicting where we walk”, Nature, Vol. 388, pp. 19-20.
Carreño, M. L. et al. (2007) “A disaster risk management performance index”, Natural Hazards, Vol. 41, No. 1, pp. 1-20.
Chan, N. W. (2015), “Impacts of disasters and disaster risk management in Malaysia: The case of floods”, Resilience and Recovery in Asian Disasters, Vol. 18, pp. 239-265.
Chopra, S. and Meindl, P. (2017), “Administración de la cadena de suministro: Estrategia, planeación y operación”, 6ta ed., Pearson Educación, Mexico D.F.
Diedrichs, D. R. et al. (2016), “Quantifying communication effects in disaster response logistics: A multiple network system dynamics model”, Journal of Humanitarian Logistics and Supply Chain Management, Vol. 6, No. 1, pp. 24–45.
Djalante, R. and Thomalla, F. (2012), “Disaster risk reduction and climate change adaptation in Indonesia: Institutional challenges and opportunities for integration”, International Journal of Disaster Resilience in the Built Environment, Vol. 3, No. 2, pp. 166-180.
Dodman, D. et al. (2017), “African urbanisation and urbanism: Implications for risk accumulation and reduction”, International Journal of Disaster Risk Reduction, Vol. 26, pp. 7-15.
Faizal, B. K. and Palaniappan, P. K. (2014), “Risk Assessment and Management in Supply Chain”, Global Journal of Researches in Engineering: G Industrial Engineering, Vol. 14, No. 2, pp. 18-30.
Fernández, M. A. (1996), Ciudades en riesgo: degradación ambiental, riesgos urbanos y desastres en América Latina, Soluciones Prácticas.
Fritsche, D. C (2016), Developing a Logistics Risk Assessment Tool, University of Arkansas, Arkansas.
Gonzalez-Feliu, J. and Morana, J. (2014), “Assessing Urban Logistics Pooling Sustainability via a Hierarchic Dashboard from a Group Decision Perspective”, Working Papers, pp. 113–135.
Greiving, S. et al. (2006), “A Methodology for an integrated risk assessment of spatially relevant hazards”, Journal of Environmental Planning and Management, Vol. 49, No. 1, pp. 1–19.
Herold, M. et al. (2005), “The role of spatial metrics in the analysis and modeling of urban land use change”, Computers, Environment and Urban Systems, Vol. 29, pp. 369-399.
Hill, M. R. (1984), “Walking, Crossing Streets and Choosing Pedestrian Routes: A Survey of Recent Insights from the Social/Behavioral Sciences”, University of Nebraska Studies, No. 66, University of Nebraska, Lincoln, Nebraska.
Holguín-Veras, J. et al. (2012),” On the unique features of post-disaster humanitarian logistics”, Journal of Operations Management, Vol. 30, No. 7-8, pp. 494-506.
Holguín-Veras, J. et al. (2013), “On the appropriate objective function for post-disaster humanitarian logistics models”, Journal of Operations Management, Vol. 31, No. 5.
Hoyos, M. C. et al. (2015), “OR models with stochastic components in disaster operations management: A literature survey”, Computers & Industrial Engineering, Vol. 82, pp. 183–197.
Huivin, J. et al. (2020), “Risk assessment applying logistic variables at urban scale: case of Gamarra (Peru)”. In: in Leiras A. et al. (Eds.), Operations Management for Social Good, 2018 POMS International Conference in Rio, Springer Proceedings in Business and Economics Series, Springer International Publishing. In press.
Instituto Nacional de Estadística e Informática – INEI (2017), Características de las empresas del Emporio Comercial de Gamarra, 2016, INEI, Lima, Perú.
Instituto Nacional de Estadística e Informática - INEI (2018a), Perú Perfil Sociodemográfico Informe Nacional, INEI, Lima, Perú.
Instituto Nacional de Estadística e Informática - INEI (2018b), Perú Anuario de Estadísticas Ambientales 2017, INEI, Lima, Perú.
Instituto Nacional de Estadística e Informática - INEI (2018c), Perú: Crecimiento y distribución de la población, INEI, Lima, Perú.
Jiao, J. et al; (2006), “An agent-based framework for collaborative negotiation in the global manufacturing supply chain network”, Robotics and Computer-Integrated Manufacturing, Vol. 22, No. 3, pp. 239–255.
Kaynak, R. and Tuğer, A. T. (2014), “Coordination and collaboration functions of disaster coordination centers for humanitarian logistics”, 2nd World Conference on Business, Economics and Management - WCBEM 2013, Antalya, 25th to 28th April 2013.
Kennan, D. et al. (2009), “Traffic engineering and control”, Traffic Engineering & Control, pp. 193–204. La Victoria City Hall (2015), “Study of seismic vulnerability of La Victoria”, La Victoria City Hall, Lima, Perú.
Leiras, A. et al. (2014), Literature review of humanitarian logistics research: trends and challenges”, Journal of Humanitarian Logistics and Supply Chain Management, Vol. 4, No. 1.
Maeda, K. et al. (2009), “Urban pedestrian mobility for mobile wireless network simulation”, Ad Hoc Networks, Vol. 7, No. 1, pp. 153-170.
Massachusetts Institute of Technology (2018), Last Mile, CTL MIT, Boston.
Merchan, D. (2015), El Perfil Logistico de Quito, Instituto de la Ciudad de Quito, Quito.
Merchán, D. and Lee, Y. (2014), “Megacity Data Collection. Version 2”, Megacity Logistics Lab, Boston.
Merchán, D. et al. (2015), Urban Metrics for Urban Logistics: Building an Atlas for Urban Freight Policy Makers, CUPUM 2015, Boston, MIT.
Mili, R. R. et al. (2018), “Developing a holistic model for earthquake risk assessment and disaster management interventions in urban fabrics”, International Journal of Disaster Risk Reduction, Vol. 27, pp. 355-365.
Ministerio de Transportes y Comunicaciones - MTC (2018), “AATE Sistema de Análisis de Viaje”, MTC, Lima.
Navin, F. P. D. and Wheeler R. J. (1969), “Pedestrian flow characteristics”, Traffic Engineering and Control, Vol. 39, No. 9, pp. 30-36.
O’Flaherty, C. A. and Parkinson, M. H. (1972), “Movement on a city center footway”, Traffic Engineering and Control, Vol. 13, No. 10, pp. 434-438.
Oeding, D. (1963), “Verkehrsbelastung und Dimensionierung von Gehwegen und anderen Anlagen des Fussgengerkehrs”, Technische Hochschule Braunschweig Institut fur Stadtbauwesen, Dipl.-Ing., Strassenbau und Strassenverkehrstechnik.
Pearson, L. and Gray, R. (2001), “Simulation software empowers logistics success at Sydney 2000 Olympics”, In: SimTec Conference, 2001.
Potter, S. H. et al. (2018), “The influence of impact-based severe weather warnings on risk perceptions and intended protective actions”, International Journal of Disaster Risk Reduction, Vol. 30, pp. 34-43.
Satterthwaite, D. (2017), “The impact of urban development on risk in sub-Saharan Africa's cities with a focus on small and intermediate urban centres”, International Journal of Disaster Risk Reduction, Vol. 26, pp. 16-23.
Shah, H. C. (2006), “The last mile: earthquake risk mitigation assistance in developing countries”, Philosophical Transactions of the Royal Society A: Mathematical, Physical and Engineering Sciences, Vol. 364, No. 1845, pp. 2183-2189.
Solmaz, G. and Turgut, D. (2015), “Pedestrian mobility in theme park disasters”, IEEE Communications Magazine, Vol. 53, No. 7, pp. 172-177.
Stamatis, D. H. (2003), “Failure mode and effect analysis : FMEA from theory to execution”, ASQ Quality Press.
Taniguchi, E. and Yamada, T. (2010), “Incorporating risks in City Logistics”, Procedia - Social and Behavioral Sciences, Vol. 2, No. 3, pp. 5899–5910.
Taubenböck, H. et al. (2013), “Risk reduction at the Last-Mile: an attempt to turn science into action by the example of Padang, Indonesia”, Natural Hazards, Vol. 65, No. 1, pp. 915-945.
Taubenböck, H. et al. (2009), "Last-Mile preparation for a potential Disaster-Interdisciplinary approach towards tsunami early warning and an evacuation information system for the coastal city of Padang, Indonesia”, Natural Hazards and Earth System Science, Vol. 9, pp. 1509-1528.
Turón, K. et al. (2017). “The concept of a walkable city as an alternative form of urban mobility”, Scientific Journal of Silesian University of Technology, Series Transport, Vol. 95, pp. 223–230.
United Nations Office of Disaster Risk Reduction - UNISDR (2015), “Global Assessment Report on Disaster Risk Reduction. Making development sustainable: The future of disaster risk management”, UNISDR.
United Nations (2018), Department of economics and social affairs, available from: https://www.un.org/development/desa/en/news/population/2018-world-urbanization-prospects.html (access Nov 5, 2018)
Van Wassenhove, L. (2006), “Humanitarian aid logistics: supply chain management in high gear”, The Journal of the Operational Research Society, Vol. 57, No. 5, pp. 475–489.
Vogt, R. et al. (2012), “A realistic outdoor urban pedestrian mobility model”, Simulation Modelling Practice and Theory, Vol. 26, pp. 113-134.
Wasson, G. et al. (2017). “User intent in a shared control framework for pedestrian mobility aids”, In Proceedings 2003 IEEE/RSJ International Conference on Intelligent Robots and Systems (IROS 2003) (Cat. No.03CH37453) (Vol. 3, pp. 2962–2967). IEEE.
Weidmann, U. (1993), “Transporttechnik der Fussgänger: Transporttechnische Eigenschaften des Fussgängerverkehrs, Literaturauswertung”, Institut für Verkehrsplanung, Transporttechnik, Strassen-und Eisenbahnbau (IVT), ETH Zürich.
Wilson, S. et al. (2013), “Separating adaptive maintenance (resilience) and transformative capacity of social-ecological systems”, Ecology and Society, Vol. 18, No. 1.
World Bank (2016), “Perú hacia un sistema integrado de ciudades, una nueva visión para crecer”, Banco Mundial, Lima, Perú.
World Bank (2011), “Urban risk assessments an approach for understanding disaster & climate risk in cities”, Finance, Economics and Urban, Washington, EE.UU.
Received: 25 Mar 2019
Approved: 19 Jul 2019
DOI: 10.14488/BJOPM.2019.v16.n3.a12
How to cite: Brito Jr., I.; Huivin, J.; Chong, M. (2019), “Impact of the urban logistics and pedestrian mobility: Gamarra case, Peru”, Brazilian Journal of Operations & Production Management, Vol. 16, No. 3, pp. 501-512, available from: https://bjopm.emnuvens.com.br/bjopm/article/view/831 (access year month day).