Pontifícia Universidade Católica do Rio de Janeiro - PUC-RIO, Rio de Janeiro, Rio de Janeiro, Brazil.
Pontifícia Universidade Católica do Rio de Janeiro - PUC-RIO, Rio de Janeiro, Rio de Janeiro, Brazil.
Pontifícia Universidade Católica do Rio de Janeiro - PUC-RIO, Rio de Janeiro, Rio de Janeiro, Brazil.
Goal: The goal of this paper is to investigate how Sales and Operations Planning (S&OP) is conducted in the Brazilian subsidiary of a global corporation of the chemical industry that manufactures and commercializes a variety of hygiene and cleaning consumer products.
Design/Methodology/Approach: The case study approach was adopted. Data was gathered during four months by means of visits to the organization for direct observation, interviews with key executives, and internal and public documents, guaranteeing data triangulation. A well-known framework from the literature is applied to analyze the S&OP practices performed by the organization.
Results: Findings contribute to aid in the understanding of the S&OP process. The case study indicates that S&OP has been a central process to organize and to align the enterprise’s efforts and deliver its business objectives.
Limitations of the investigation: The research is conducted within one single company, a Brazilian subsidiary of a multinational chemical corporation, which limits the generalization of the findings.
Practical implications: The research findings enhance the knowledge about S&OP providing practitioners with valuable information to understand better its phenomenon, such as how the process is performed, and the best practices and benefits.
Originality/Value: S&OP has been an object of interest of scholars and practitioners for decades. However, the process is far from being completely understood and there is a call for more empirical studies. Thus the academic literature can benefit from this in-depth research that sheds light on an S&OP industry application.
Keywords: S&OP; Hygiene and cleaning; Consumer products; Case study
S&OP has been the object of growing interest of a number of academics and practitioners in the past decades (Kristensen and Jonsson, 2018). It is a recognized planning process that has been implemented by companies worldwide (Lapide, 2004a; Feng et al., 2008; Bower, 2015). S&OP contributes to supply chain improvements and supports the achievement of companies’ objectives (Wing and Perry, 2001), including profit (Grimson and Pyke, 2007). S&OP is a cyclic process that balances the market demand with the company’s supply capacity and reconciles different business function plans in a single plan for the entire organization, in line with the strategic plan (Wallace and Stahl, 2006; Thomé et al., 2012a; Feng et al., 2013; Tuomikangas and Kaipia, 2014; Goh and Eldridge, 2019). If S&OP is properly applied, it may improve business performance, increase profit, and improve supply chain results regarding service levels, demand forecast accuracy, inventory management, and asset utilization (Thomé et al., 2012a). The positive effect of S&OP on firm performance (Thomé et al., 2012b) and on manufacturing operational performance (Thomé et al., 2014a) has been demonstrated.
Even though good examples are offered in the literature, there is still a lack of empirical studies in S&OP, which offers several research opportunities to be explored (Grimson and Pyke, 2007; Thomé et al., 2012a; Kjellsdotter Ivert et al., 2015a; Goh and Eldridge, 2015). Moreover, in a recent literature review on S&OP, Kristensen and Jonsson (2018) suggest as a future research topic the development of more descriptive studies on S&OP to “explore the level of S&OP adoption and the performance of S&OP across industries”.
Within this context, this paper aims to address this research gap by offering a case study to investigate how S&OP is conducted in the Brazilian subsidiary of a multinational chemical corporation that manufactures and commercializes a variety of hygiene and cleaning consumer products. This research aims to enhance knowledge on S&OP providing practitioners with valuable information to improve their understanding, such as how the process is performed, best practices, and the benefits obtained. It is aligned with and is complementary with Seeling et al.’s (2020) study that analyses the S&OP process implemented in a multinational corporation that manufactures and commercializes hand tools, plastic goods and office products to the mass consumer market.
The remainder of the paper is as follows. The second section presents a theoretical background on S&OP and the third section explains the research method adopted. The case study and its main findings are presented and analyzed in the fourth section. The main results are discussed in the fifth section. Conclusions and suggestions for future research close the paper.
This section presents S&OP by first introducing definitions about the process and its main cycle steps and then by presenting the S&OP main building blocks, offered within the scope of an S&OP framework.
S&OP is defined as a business process (Wing and Perry, 2001; Grimson and Pyke, 2007; Cecere et al., 2009; Goh and Eldridge, 2015) that is carried out periodically, frequently once a month (Lapide, 2004b; Cecere, 2006; Thomé et al., 2012a). It is a tactical process (Wallace and Stahl, 2006; Feng et al., 2008; Lapide, 2011; Thomé et al., 2012a) that reconciles different business function plans in one agreed-upon plan (Cox and Blackstone, 2002; Wallace and Stahl, 2006; Grimson and Pyke, 2007; Thomé et al., 2012a). S&OP balances demand and supply (Lapide, 2004b; Wallace and Stahl, 2006; Feng et al., 2013), taking in account manufacturing, logistics, sourcing, and financial constraints (Feng et al., 2008), to build a feasible plan. S&OP produces a demand forecast for the current portfolio of products and for the new product launches at an aggregate level, even though it may be opened by stock keeping units (SKU) for in-depth demand analysis and to determine supply capabilities. Companies define a planning horizon compatible with their strategic planning, frequently of 18 months (Grimson and Pyke, 2007; Thomé et al., 2012a). Different industries may use other planning horizons (Grimson and Pyke, 2007). S&OP links the strategic plan with its execution, aligning the organization vertically (Olhager, 2001; Cecere, 2006; Wallace and Stahl, 2006; Thomé et al., 2012a; Wagner et al., 2014), and it reviews performance indicators for continuous improvement (Cox and Blackstone, 2002).
The cyclic process is usually conducted monthly in five steps (Lapide, 2004b; Wallace and Stahl, 2006; Grimson and Pyke, 2007; Thomé et al., 2012a, Wagner et al., 2014; Kjellsdotter Ivert et al., 2015a) that are described next, according to Wallace and Stahl (2006). Data Gathering is the first step and deals with collecting the information needed to conduct the process. This information regards production, sourcing, sales, inventories, new products, costs, and prices, among others. The next step is Planning demand. It is usually handled in the first week of the month, when the Sales and Marketing business functions generate the unconstrained demand plan based on historical data, expected impact of promotions, and new product launches scheduled, among others. Supply Planning is the third step. It normally happens in the second week, when the demand plan, converted to the SKU level, is simulated and analyzed by the Operations/Supply functions to generate a feasible supply plan, considering all capacity constraints. The gaps between demand and supply plans are identified. Pre-meeting is the step four, when representatives from different business functions discuss the demand-supply gaps and work together to develop mitigation plans to solve the problems. Pre-meeting is usually scheduled in the third or in the fourth week of the month. Finally, the fifth and last step is the Executive Meeting, normally conducted in the last week of the month. In this meeting, the senior executives review the S&OP plan proposal and approve it or indicate another course of action. Global corporations may have two additional steps: Global Roll-up and Global Executive Meeting (Wallace and Stahl, 2006).
Thomé et al. (2012a) offer a well-known and recognized S&OP framework that presents the main building blocks for the process. This framework captures the essential elements of S&OP (Kjellsdotter Ivert et al., 2015a) and is considered generic in the sense of providing a complete overview of the process (Noroozi and Wikner, 2017). There was also the influence of the development of different frameworks, as the ones of Hulthén et al. (2016) to measure the effectiveness and efficiency of S&OP, of Tuomikangas and Kaipia (2014) for the S&OP coordination, of Thomé et al. (2014c) and Hollmann et al. (2015) for collaborative planning, forecasting and replenishment, of Kjellsdotter Ivert et al. (2015b) for planning environment complexity, of Noroozi and Wikner (2017) for supply chain integration, and of Kristensen and Jonsson (2018) for the context-based S&OP. It was also used to develop a teaching case for S&OP (Scavarda et al., 2017).
The framework building blocks are context, inputs, structure and processes, and outcomes and results. As it is situated at the tactical level, it bridges long-term business and corporate strategic plans with short-term operations.
Business Plan is the enterprise’s highest level of strategic plan. The Corporate Strategic Plan is a corporate game plan developed according to the Business Plan. Context refers to the enterprise’s operations and market environment and encompasses: region, country, industry, manufacturing strategy, product-process matrix, product aggregation, hierarchical planning, and planning horizon, among others. Inputs cover the information used in the S&OP process. Structure and Processes are a core building block composed of meeting and collaboration, organization, information technology, and metrics. Meeting and collaboration refers to the human effectiveness in the S&OP process (Grimson and Pyke, 2007; Kjellsdotter Ivert et al. 2015a), including participants, collaboration, and trust. Organization comprises structure to perform the cyclic process, including a cross-functional team, empowerment, agenda, and cycle steps. Information Technology refers to software (Scavarda et al., 2006), interfaces, hardware, and communication systems used to support the process (Zago and Mesquita, 2015). Metrics refers to all key performance indicators used to monitor results and improvements in the firm performance and its supply chain (Braz et al., 2011; Fernandez et al., 2012; Gutierrez et al., 2015). They can have different perspectives, one for S&OP effectiveness measures and one for efficiency measures (Hulthén et al., 2016). The main S&OP process outcome is the reconciliation and integration of the business functional plans (e.g. Marketing, Sales, Operations, and Finance) into one consolidated S&OP plan (Thomé et al., 2012a). The main result is profit optimization (Grimson and Pyke, 2007; Thomé et al., 2012a). Several objectives related to the different focuses of the process impact on the profit maximization, such as forecast accuracy, inventory management, demand-supply balance, service level, among others. Operations refer to the day to day execution, encompassing company’s resources and activities.
The typical standard S&OP implementation is described by Thomé et al.’s (2012a) framework, introduced in the previous section, developed based on a systematic literature review. According to Thomé et al. (2012a), S&OP encompasses regular cycle meetings, empowered teams from the business functions (e.g. Marketing, Sales, Operations, and Finance) working in collaboration, adequate structure, organization to execute the process properly, IT support, and KPIs to measure enterprise’s results and S&OP’s effectiveness, among others. The cyclic process receives inputs (e.g. functional plans, forecast, operational constraints, inventory, budget, and costs), and balances the enterprise’s demand and supply. It generates, as outputs, a set of reconciled business function plans, aligned with the highest company’s strategic plan, to maximize profit.
Many authors have developed their maturity models (MM) for S&OP, indicating the pathway to improve performance (Goh and Eldridge, 2019). These MM (e.g. Wing and Perry, 2001; Lapide, 2004b; Cecere, 2006; Grimsom and Pyke, 2007; Snow, 2007; Feng et al., 2008; Viswanathan, 2009; Baumann, 2010; Wagner et al., 2014; and Danese et al., 2018) present the implementation progress in a sequence of evolutionary steps that are assessed according to a group of chosen dimensions, evolving from an inexistent or a very basic S&OP process to the state of the art (Lapide, 2004b). In some cases, the highest maturity step is aspirational stage that has not yet been achieved with the current technology (Lapide 2004b), with a high level of integration across the supply chain enabled by IT (e.g. Wing and Perry, 2001; Lapide, 2004b; Feng, 2008). The participation of key suppliers and customers in the S&OP cycle and the active participation of Finance, playing a key role in the process, are also cited by academics as indications of a mature process (e.g. Grimson and Pyke, 2007; Baumann, 2010; Wagner, 2014; Danese et al., 2018). In the highest maturity level, the meetings could be event driven (e.g. Lapide, 2004b; Grimson and Pyke, 2007; Cecere, 2009; Wagner et al., 2014) due to the internal and external integration, among the enterprise’s business functions and with suppliers and customers.
Goh and Eldridge (2019) bring a different perspective in terms of S&OP. They say it is a process to facilitate coordination across the business functions; however, most of the companies that have adopted S&OP as their planning process have not gotten all the potential benefits. They investigate the effect of S&OP on supply chain performance using the coordination and contingency theory approaches, applying a structural equation model with six S&OP coordination mechanisms hypothesized to contribute to supply chain performance. The model was tested using a global survey of 568 practitioners. The obtained results show that “strategic alignment” and “information acquisition” are the mechanisms that most impact superior S&OP results. They also conclude that a highly formalized S&OP process may hinder the supply chain performance. Additionally, they verify that the negative impact of a standardized S&OP process on the supply chain performance grows as the company size and the experience in S&OP increase. Goh and Eldridge (2019) finally indicate that “organizational bricolage” may be a coordinating mechanism of effective S&OP programs. In their perspective, S&OP teams should have more autonomy to respond with flexibility and fast to internal urgencies or changes in the business environment.
The research is conducted using the case study approach (Yin, 2009) in the Brazilian subsidiary of a multinational chemical corporation that manufactures and commercializes hygiene and cleaning products, headquartered in the United States and present in more than 110 countries. The Brazilian subsidiary is a multi-site complex organization that manufactures the majority of the goods locally and complements its portfolio with outsourced and imported products. Based on revenue, number of employees and geographic presence criteria, the Brazilian subsidiary is considered a big company maintaining relationships with clients from several market channels: distributors, wholesalers, mass merchandisers, and other retailers. The corporation has implemented a long running S&OP process in its operations worldwide, and the Brazilian subsidiary is considered a best practice. This setting offers a nice sample to conduct an empirical study to analyze S&OP implementation.
Thomé et al.’s (2012a) S&OP framework was chosen to support the case study development. Besides being largely adopted in the literature to analyze S&OP operations, as well as developing new frameworks, as presented in the theoretical background of this paper, its main building blocks offer a good path to conduct a structured case study analysis.
The researchers had open access to the Brazilian subsidiary to visit its operations for direct observation, to interview key professionals and to collect information from internal reports and from the S&OP dashboard. The different data sources aimed to guarantee triangulation and validity checks. Extensive field observations were conducted to obtain information and to base the results grounded on an observational guideline. A fieldwork protocol was followed to interview professionals and documents were analyzed as evidences of the activities described. The interviews were based on a semi-structured questionnaire specially designed (Yin, 2009), following an interview protocol adapted from Manuj and Sahin (2011). Open-ended questions were made to clarify remaining doubts. Interviews were conducted with the executives directly involved in the subsidiary’s S&OP process, embracing the demand planning manager (which is also the S&OP manager), the supply chain director, a marketing manager, the finance planning manager and the general manager. In total five executives from the Brazilian subsidiary were interviewed.
This section focuses on the Brazilian subsidiary of this multinational chemical corporation and analyzes how S&OP is conducted in its operations. Next, the process is described and analyzed according to the S&OP main building blocks.
The multinational chemical corporation has developed an international operations strategy, doing business worldwide, supported by its subsidiaries located in 70 countries. The international operations strategy includes building local manufacturing facilities in different countries, that are part of a multisite production network configuration, supported by global suppliers (Grillo et al.,2018).
The multinational chemical corporation develops an annual budget and strategic plans that cover a longer term horizon. The budget and the strategic plans are built as a result of a few rounds of negotiation between the corporate headquarters and each individual subsidiary. Targets are provided by corporate headquarters to all subsidiaries that develop their own local strategic plans and budgets accordingly. The subsidiary’s proposal is then submitted to the multinational chemical corporation for approval or more adjustments are requested.
The multinational chemical corporation adopted S&OP globally to standardize its planning process and ensure everybody’s alignment. The S&OP information from all subsidiaries worldwide is consolidated using an in-house developed global software tool that is also accessed by professionals in high hierarchical levels, including the CEO. S&OP is considered an important planning process initiative to bridge the corporate strategic plan to operations.
The Brazilian subsidiary commercializes around 300 SKUs in different product categories of consumer products, delivering to approximately 350 clients, mainly distributors and retailers. It is responsible for bringing in revenues of around US$350 million. The sourcing is complex: the majority of the items (75%) is produced in the subsidiary’s plant in the north region of the country, around 20% of the products are outsourced, and other 5% are imported from different countries (e.g. USA, Canada, Argentina, and Mexico). Additionally to the manufacturing plant, the subsidiary has two distribution centers (DC) strategically located to service the entire country. The planning horizon is 18 months and the strategy is make-to-stock and buy-to-stock, based on sales forecast.
The main inputs for the S&OP process are the marketing plan, including the new product launches, the trade promotions, and the portfolio of products; the demand plan, based on the mathematical demand forecast and inputs from professionals; the constrained supply plan, built on production capabilities simulations in different operation scenarios and information from suppliers; the inventory position, including raw materials, packaging materials, work in progress, finished goods, and inventory in transit; the open customer orders; the open purchasing orders with expected arrival date; the costs; the prices; and the budget figures. This information is kept updated in the Enterprise Resource Planning (ERP) system. The demand plan is built based on market information from different sources to achieve the organization’s objectives and deliver budget. The demand and the supply plans by SKUs are converted to financial figures to be evaluated in local currency and US dollars. The in-house S&OP system is updated with all information generated in each step of the cycle, including meeting minutes, pending issues, presentations, and plans, among others.
In the Brazilian subsidiary, there is a known monthly calendar of S&OP meetings for the year, even though, as observed, schedule adjustments may occur, since they do not affect the cycle’s proper execution.
There are defined participants representing all the business functions involved in the process (Marketing, Trade Marketing, Sales, Supply Chain, Demand Planning, and Finance) working collaboratively with clear roles and responsibilities. Other business functions may interact with the process, providing and receiving information, but do not attend the regular meetings, only by exception (e.g. Production, Engineering, Research and Development, and Logistics).
The demand planning manager has a double hat, also responding as S&OP manager. The S&OP manager organizes the meeting calendar, attends all the meetings, ensures that the S&OP system is properly updated by whoever is the responsible in each step, keeping track of indicators and targets, making part of the presentations.
The Brazilian subsidiary’s directors and general manager attend meetings and sponsor the process. S&OP is well established in this organization, accepted by everybody, and considered the most important planning process by the executives. Managers and directors have S&OP indicators and their correspondent targets associated directly to their annual appraisals, thus impacting their individual performance bonus and their career progress.
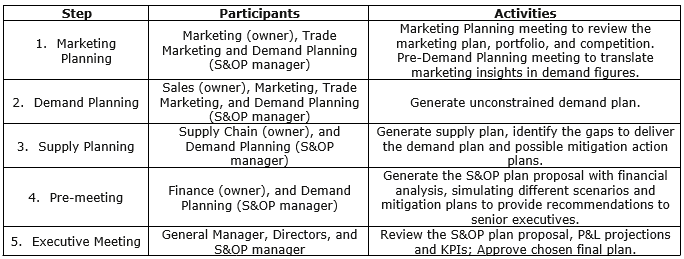
The global chemical corporation’s 5-step S&OP cycle is slightly different from Wallace and Stahl’s (2006) model and is described next. Even though Data Gathering’s activities are performed every month, the ERP system update is not considered part of the S&OP cycle in this organization.
Moreover, the first step in the S&OP cycle is the Marketing Planning and it happens in the first week of the month. During Marketing Planning, the marketing plans and the portfolio of products are reviewed. Market trends and competition are assessed based on the consultancy firm Nielsen’s reports and other sources of information. These reports are key for the decision-making process and are available for all product categories only once every quarter, due to the periodicity of the different category reports. Because of that, the Brazilian subsidiary had not had this meeting on a monthly basis for a while. This is non-compliance, considering the multinational chemical corporation standard S&OP process, and it has been recently corrected. Marketing is in charge of the first step and Trade Marketing and Demand Planning (S&OP manager) attend the meeting as well. There is a second regular meeting with the same attendees in this first step that has always been performed on a monthly basis, to translate all the marketing analysis and initiatives into demand figures.
Demand Analysis is step two, performed in the second week, when the unconstrained demand plan is built. The demand of almost 85% of the portfolio items are determined solely by mathematical demand forecast calculation and the other 15%, involving especial trade promotions, changing market trends and new product launches, are treated as exception. Sales is in charge of the process in this step, and Marketing, Trade Marketing, and Demand Planning (S&OP manager) attend the meetings. The new product launches’ demand was planned 18 months in advance and was included in the S&OP plan; however, there are scheduled reviews each quarter in the 9 months prior to the launch date to ensure demand and supply alignment.
The South-American regional planning team has skilled people trained in demand planning and uses an IT tool called Advanced Planning and Optimizer (APO) from the ERP SAP to generate the mathematical demand forecast, based on historical data at an aggregate level, and also opened by SKUs. The mathematical demand forecast by SKU is reviewed in the sequence by the Brazilian subsidiary’s demand planner.
Supply Analysis is the third step of the process, when the Brazilian supply team analyzes the unconstrained demand plan and verifies the subsidiary’s capacity constraints regarding production and sourcing. The supply team generates the feasible supply plan and points out the identified gaps in the third week of the month. Supply Chain is in charge of this process step and Demand planning (S&OP manager) attends this step meeting as well.
Finance is responsible for building the local budget, based on the inputs gathered from all areas and is based on the targets provided by the company’s headquarters in the USA. It also keeps track of it along the fiscal year. Prices are defined in the budget, but may be reviewed, if needed, by Sales, Marketing, Trade Marketing, and Finance based on the current product margins and on the market business environment. Finance is in charge of the fourth step of the S&OP cycle, Pre-meeting, which is performed in the fourth week of the month. Finance simulates the different scenarios and gap mitigation plans developed in the previous steps from a financial stand point. Finance makes recommendations and finalizes the S&OP plan, comparing it with budget and also determining the profit-and-loss (P&L) expected results. The attendees in the Pre-meeting step are Finance and Demand Planning (S&OP manager). All information is taken to the Executive Meeting.
The Executive Meeting is the fifth step of the cycle that happens in the fourth week of the month. The Demand Planning Manager (S&OP manager) uses the S&OP system tool to submit to the General Manager and to all directors of the S&OP the plan proposal for approval. They also review the key performance indicators and P&L projections and make decisions. Pending issues that remained are resolved at this moment; however, they are not many, as there is a director responsible for each previous step with autonomy to decide in his area.
The S&OP system is the tool to document all the information by subsidiary and thus it gathers and consolidates the results around the world. In this sense, the multinational chemical corporation has a kind of sixth cycle step, similar to a Global Rollup. The seventh step, Global Executive Meeting, is not implemented even though the information is available to senior executives and the CEO occasionally audits it. An interesting theme to be further investigated is how the multinational chemical corporation deals with the S&OP information consolidated globally.
Many dedicated software and customized spreadsheets are utilized to perform the S&OP process’ activities. SAP is the company’s ERP used in many activities and extensively used during supply planning. Nielsen’s data bank is consulted for market information and is especially important during Marketing Planning. During Demand Planning, a spreadsheet is used by Sales to consult customers’ inventory and sales to consumers (60% of the boxes sold). All demand premises adopted are registered in another spreadsheet that is attached to the demand figures to create the demand plan. These two spreadsheets are formal documents always used to perform the S&OP cyclic activities. APO is used to determine the mathematical demand forecast. Business Planning and Control (BPC) is a package of the SAP ERP used by Finance to make simulations and P&L projections for different scenarios and for the S&OP plan. It is key for the Pre-meeting step. The S&OP system tool documents and displays all the information about the process. The plant has IT tools dedicated to support production planning and scheduling at the shop floor level. Many professionals from different business functions use spreadsheets for several purposes, usually to handle information in formats that the ERP standard reports do not provide.
Table 1 presents a summary of the 5-Step S&OP cycle performed by the Brazilian subsidiary.
Table 1. 5-Step S&OP cycle performed by the Brazilian subsidiary
Source: developed by the authors
There are a number of metrics used in the S&OP process. In Marketing Planning, the main metrics utilized by SKU and aggregate are market share, distribution (e.g. units, value, and geography), inventory turns, revenues, sales growth, margins, profit, and SKU count. In Demand Planning, the metrics used are the sales forecast indicators Mean Absolute Percent Error (MAPE) by SKU and the percentage error in number of boxes sold. The frozen forecast period is three months. Other KPIs include Fill Rate (units delivered to customers versus units requested) and main customers’ sellout (boxes sold to consumers) and days on hand (inventory coverage measured in days of average demand). In Supply Planning, the most used performance indicators are shortages and excesses (respectively, the SKUs below the projected inventory level and above it). Shortages are analyzed based on historical data to determine the causes. The operational costs, extra expenditures, and inventory value are also reviewed, among others. In Pre-meeting, the P&L is analyzed, focusing on revenue and profit. In the Executive Meeting, all previously described metrics are reviewed and the executives evaluate the S&OP process to improve it. The performance indicators are registered for historical evaluation in the S&OP system.
The S&OP process adopted in the Brazilian subsidiary generates a marketing plan, an unconstrained demand plan, a supply plan with existing capacity constraints, and an approved S&OP plan, including a financial analysis with an 18-month time window. In the Brazilian subsidiary, there is just one consolidated and agreed-upon plan that internally aligns demand, supply, and the expected financial results tied to the corporate plan. The S&OP plan includes all new product launches. The Brazilian subsidiary is profitable.
Figure 1 presents a synthesis of the main findings.
Figure 1. The S&OP Framework within the case study
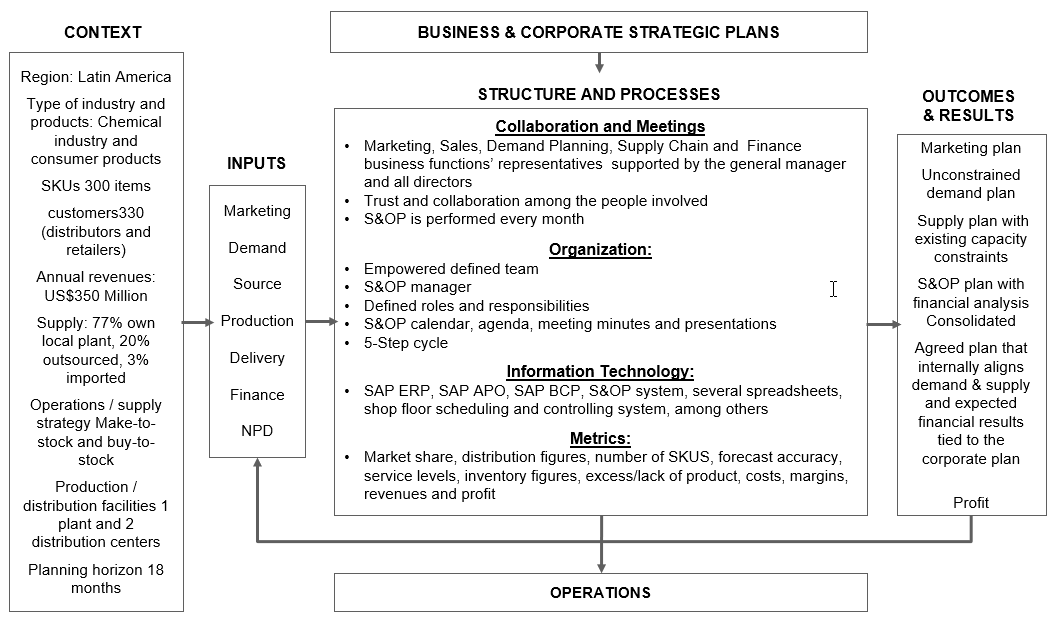
Source: adapted from Thomé et al. (2012a).
S&OP is considered a key planning process to manage the business by the multinational chemical corporation, thus becoming a priority for the Brazilian subsidiary as well. This was made clear by the executives during the interviews. As a consequence, resources (e.g. people, infra-structure, time, and systems) are allocated to execute the process properly, in line with the best practices offered by many authors (e.g. Wallace and Stahl, 2006; Snow, 2007; Grimson and Pyke, 2007; and Thomé et al., 2012a).
The message that S&OP is a very important process is reinforced in many different ways. There are on line courses to spread the S&OP knowledge among the employees and they have to attend them according to their roles, responsibilities, and needs. The Brazilian subsidiary is periodically audited by the headquarters to check its compliance with the standard S&OP process defined by the multinational chemical corporation. All executives have targets in their annual appraisals linked to S&OP indicators; consequently their variable salary and their career progress depend on these results. That is consistent with S&OP implementations in mature levels as it is indicated by Grimson and Pyke (2007), Cecere (2009), and Bauman (2010). Additionally, Snow (2007) states that many kinds of incentives to employees and executives may be applied to help improve the process performance in mature implementations. S&OP indicators are also included in the agreement with the trade union to define performance criteria for profit sharing.
The S&OP system is a tool to document the S&OP cycle, but it also standardizes the process, allows comparisons of results among the subsidiaries, and can be accessed by high hierarchical levels. In the interviews, it was said that the multinational chemical corporation’s CEO consults it periodically. The organizational culture and the business environment contribute to the attention given to S&OP in the multinational chemical corporation and, as a consequence, in the Brazilian subsidiary as well. Wallace and Stahl (2006) have pointed out the importance of the senior executives’ support for a successful S&OP implementation and Baumann (2010) includes it in his two highest MM steps.
The multinational chemical corporation and its Brazilian subsidiary are complex organizations, which can be illustrated by business parameters, such as number of employees, number of facilities, number of SKUs, customer basis, number of suppliers, revenues, costs, geographic coverage, type of industry, and new product launch frequency, among others. The need of a robust planning process such as S&OP increases as the enterprise’s complexity increases (Wallace and Stahl, 2006). Thomé et al. (2014a) demonstrate a correlation indicating the positive effect that the S&OP has on manufacturing companies’ performance and they complement the study in Thomé et al.’s (2014b) research work, showing that this benefit is potentialized as complexity increases. The S&OP plan adoption by the entire company is a key success factor to improve the enterprise’s performance (Snow, 2007). On the other hand, Goh and Eldridge (2019) indicate that a much formalized S&OP might be an inhibitor of the firm performance and recommend some flexibility to respond to unplanned issues. The Brazilian subsidiary has a standardized S&OP process running for years; however, other businesses, regarded as usual activities, are also performed in parallel within the business functions, allowing the organization to respond to unexpected issues in the short term. Any changes in the plans are reflected in the S&OP in the earliest opportunity, according to the demand planning manager. Examples of issues mentioned during the interviews with executives include difficulties to deliver sales targets in the short term, promotions that are not bringing the expected results, operations issues or customer credit issues blocking sales.
The Brazilian subsidiary’s metrics demonstrate good performance. According to the Aberdeen Group, the industry average is 92.5% for customer service levels and 73% for forecast accuracy by product family (Viswanathan, 2009). The Brazilian subsidiary’s KPIs could not be openly published, but it typically includes service levels and forecast accuracy with very similar results or slightly above, new product developments (NPD) executed on time, and inventory on track. Cecere (2009) discusses the benefits of a demand-driven S&OP implementation: the listing possibilities of revenue increases between 2% and 5%; inventory reductions grows between 7% and 15%; and improvements in NPD increase up to 20%, if properly implemented under specific conditions. Goh and Eldridge (2015) present two cases of success in China. One company obtained 52% of improvement in forecast accuracy and a 30% reduction in the inventory. A second company reduced the order lead time of new product launches by 67%. According to Goh and Eldridge (2015), both companies did not have solid processes in the beginning and obtained these high results right after the S&OP implementation. In the Brazilian subsidiary, field observations and analysis of documents and metrics indicate that S&OP has been essential to manage the complexity and the dynamic changes, keeping all business functions aligned towards the organization’s objectives. The S&OP process is mature and is under control, although ups and downs eventually happen. It is not possible to observe great improvements in the firm performance year over year at the moment.
The Sales inputs are crucial for the success of the S&OP process. Improving forecast accuracy and being accountable for the S&OP demand plan are critical success factors (McCall, 2013). The mathematical demand forecast calculation is performed by the South-American regional demand planning team and is reviewed by the Brazilian demand planner. These numbers are inputs for the Demand Planning meeting together with the marketing plan built in the Marketing Planning step. In Demand Planning, Sales leads the process and builds the demand plan together with Marketing and Trade Marketing. The premises of the plan are registered. The process assures a good level of involvement and ownership from Sales. The Brazilian subsidiary has only 350 customers and keeps track of the sellout of 60% of the boxes sold while it monitors the inventory of key customers. Additionally, the portfolio of 300 SKUS with high demand is a favorable factor to generate a more stable and predictable forecast. There is still opportunity to improve the forecast accuracy, reducing the MAPE, currently close to 30%. Even though the subsidiary’s process has more steps in the Demand Planning phase, it is generally consistent with Wallace and Stahl’s (2006) model as Marketing and Sales provide the demand plan.
Sales and Operations Planning is certainly, but not only, the balance between the demand brought by Sales and Marketing and the supply capacity of Operations. Finance does play an important role in the process (Oliva and Watson, 2011; Thomé et al., 2012a; Noroozi and Wikner, 2017); however, there are great opportunities to increase its engagement in the S&OP cycle (Viswanathan, 2009) and the role of Finance in the S&OP process in different companies might be investigated to be better described and understood. In the Brazilian subsidiary, Finance is active, supporting the other business functions, leading the Pre-meeting step and taking part in the Executive Meeting. That is consistent with mature implementations, according to Grimson and Pyke (2007) and Baumann (2010).
In some multinational organizations, the industrial plants are considered global resources and are independent from the subsidiary existent in the countries they are located. In this case, the subsidiary is considered just another internal customer. On the other hand, if the local plant is part of the subsidiary’s organization than it tends to be more committed and flexible than a normal supplier. In the studied case, the industrial plant manufactures approximately 75% of the portfolio, providing good service to the Brazilian subsidiary. The Brazilian subsidiary does not get the full benefit of the local manufacturing because the plant is placed in the north region of the country, very far from the market and from the DCs; however, it is strategically located where costs and taxes are lower.
Additionally, the suppliers’ lead times are long, typically of 120 days. The Brazilian subsidiary has good strategic relationship with the key suppliers, but they do not participate in the S&OP cycle meetings. Having key suppliers and customers taking part in the meetings is considered an advancement in the S&OP process (Lapide, 2004b; Grimson and Pyke, 2007; Baumann, 2010; Wagner, 2014).
The S&OP process is very standardized in the Brazilian subsidiary, with clear procedures and responsibilities assigned. All steps are executed according to an agreed calendar and are documented in the S&OP system. The process is very similar to Wallace and Stahl’s (2006) model and can be perfectly described by Thomé et al.’s (2012a) framework. It is consistent with intermediate to high maturity levels, as described by Grimson and Pyke (2007), Lapide (2004b) and Danese et al. (2018). The S&OP process performed by the Brazilian subsidiary is designed to plan the next 18 months, with a frozen horizon of three months. It is not a process to resolve unexpected urgencies. But if emergencies show up, event driven meetings are scheduled to deal with them, in parallel with the S&OP process, and the decisions are reflected later in the documents and inputs of the cycle.
The literature about S&OP still needs more descriptive empirical studies bringing data from real-life settings in different contexts. This paper addresses this research gap, offering a case study in the Brazilian subsidiary of a multinational chemical corporation that manufactures and commercializes a variety of hygiene and cleaning consumer products for the mass market. The paper contributes to enhance knowledge on S&OP, offering an in-depth research about the activities performed by the studied organization, the best practices it applies, and the benefits it has obtained from the process.
The S&OP framework developed by Thomé et al. (2012a) was a useful tool and paved the way to perform the analysis of the S&OP process of the Brazilian subsidiary in a structured manner. The adoption of this framework is consistent with Kjellsdotter Ivert et al.’s (2015a) use to assess S&OP practice in the food industry in Scandinavia.
The S&OP process running in the Brazilian subsidiary aligns demand with supply, considering the financial figures, generating a consolidated plan that is tied up to the budget and to the corporate strategic plan. S&OP is facilitated by the demand planning manager that has a double hat, also being the S&OP manager. The process is sponsored by the general manager and local directors, ensuring that the needed resources are available to perform the S&OP cycle activities. The process is a priority for the global chemical corporation that has deployed it worldwide. An internally developed dedicated IT tool is globally used to document and support the entire process.
Marketing buys periodically updated detailed information about the market and the competition, which is analyzed within the S&OP cycle and in other moments, to develop robust marketing plans. The portfolio of products, with just 300 SKUs, is not large and most items have strong sales in units and revenue. The Brazilian subsidiary’s Sales force has good relationships with its 350 customers. The Sales force has access to the inventory levels of a good part of the customers and also knows their sales to end consumers, covering 60% of boxes sold. These initiatives are key to develop a good demand plan and contribute to diminish the forecast error.
Finance actively participates in the S&OP process, simulating the supply plan with different scenarios and costing the gap mitigation alternatives to build a solid S&OP plan that optimizes the profit and seeks to deliver or surpass the expected budgeted results.
The local industrial plant is part of the Brazilian subsidiary’s organization and is committed with its objectives. This contributes to provide more flexibility and responsiveness, key factors to increase service level and improve the inventory management. However, the plant is located far from the market and the suppliers’ lead times are high, preventing the organization from obtaining higher benefits.
The observations and analysis bring sound empirical evidences, indicating that the S&OP process is key for the Brazilian subsidiary to manage its complexity, to organize its efforts towards its objectives, and has a positive impact on its results.
This paper opens new paths and questions to be investigated in future research. As the S&OP information is consolidated globally, how is it used by the corporate headquarters? How do multinational corporations implement steps six and seven of Wallace and Stahl’s (2006) model? What should be the roles and responsibilities of Finance in the S&OP process? Considering all the characteristics of the S&OP implementation done in the Brazilian subsidiary, how mature is this process? Which are the models to measure S&OP maturity? The authors of this paper recommend additional empirical studies aiming to address these research questions, which will indeed bring contributions for the S&OP literature.
This work was supported by the following research agencies: Coordination for the Improvement of Higher Education Personnel (Coordenação de Aperfeiçoamento de Pessoal de Nível Superior – Brazil – CAPES) (Finance Code 001) & (Grant Number 88881.198822/2018-01), Brazilian National Council for Scientific and Technological Development (Conselho Nacional de Desenvolvimento Científico e Tecnológico – CNPq) (Grant Numbers 3131812014-4, 401522/2014-8, 304931/2016-0, 404682/2016-2, and 311757/2018-9), and Carlos Chagas Filho Foundation for Research Support of the State of Rio de Janeiro (Fundação Carlos Chagas Filho de Amparo à Pesquisa do Estado do Rio de Janeiro – FAPERJ) (Grant Number E-26/203.252/2017).
Baumann, F. (2010), “The shelf-connected supply chain: strategically linking CPFR with S&OP at the executive level”, Journal of Business Forecasting-Methods and Systems, Vol. 29, No. 4, p. 21-28.
Bower, P. (2015), “S&OP in the Service Industry”, The Journal of Business Forecasting, Vol. 34, No. 2.
Braz, R. G. F. et al. (2011), “Reviewing and improving performance measurement systems: an action research”, International Journal of Production Economic, Vol. 33, No. 2, pp. 751–760.
Cecere, L. (2006), S&OP in Consumer Products: Answers to the 7 most common questions, AMR Research, Boston/MA.
Cecere, L. et al. (2009), Sales and Operations Planning: Transformation from Tradition, Industry Value Chain Strategies, AMR Research, Boston/MA.
Cox, J. F. and Blackstone, J. H. (2002), APICS Dictionary 10th ed., APICS, Alexandria-VA.
Danese, P. et al. (2018), “Managing evolutionary paths in Sales and Operations Planning: key dimensions and sequences of implementation”, International Journal of Production Research, Vol. 56, No. 5, pp. 2036-2053.
Feng, Y. et al. (2008), “The Value of Sales and Operations Planning in Oriented Strand Board Industry with Make-to-Order Manufacturing System: Cross Functional Integration under Deterministic Demand and Spot Market Recourse”, International Journal of Production Economics, Vol. 115, No. 1, pp. 189-209.
Feng, Y. et al. (2013), “Coordinated contract decision in make-to-order manufacturing supply chain: a stochastic programming approach”, Production Operations Management, Vol. 22, No. 3, pp. 642–660.
Fernandez, N. S. et al. (2012), “Diseño de sistemas de medición de desempeño de proveedores: experiencias de un caso de estudio”, Production Journal, Vol. 22, pp. 43-57.
Goh, S. H. and Eldridge, S. (2015), “New product introduction and supplier integration in sales and operations planning”, International Journal of Physical Distribution & Logistics Management, Vol. 45, No. 9/10, pp. 861–886.
Goh, S. H. and Eldridge, S. (2019), “Sales and Operations Planning: The effect of coordination mechanisms on supply chain performance”, International Journal of Production Economics, Vol. 214, pp. 80-94.
Grillo, H. et al. (2018), “Key Parameters for the Analysis Stage of Internationalization of Operations”, Brazilian Journal of Operations & Production Management, Vol. 15, No. 2, pp. 173-181.
Grimson, J. A. and Pyke, D. F. (2007), “Sales and operations planning: an exploratory study and framework”, International Journal of Logistics Management, Vol. 18, No. 3, pp. 322-346.
Gutierrez, D.M. et al. (2015), “Evolution of the performance measurement system in the Logistics Department of a broadcasting company: An action research”, International Journal of Production Economics, Vol. 160, pp. 1-12.
Hollmann, R. L. et al. (2015), “Collaborative planning, forecasting and replenishment: a literature review”, International Journal of Productivity and Performance Management, Vol. 64, No. 7, pp. 971-993.
Hulthén, H. et al. (2016), “Framework for measuring performance of the sales and operations planning process”, International Journal of Physical Distribution & Logistics Management, Vol. 46, pp. 809-835.
Kjellsdotter Ivert, L. K. et al. (2015a), “Sales and operations planning: responding to the needs of industrial food producers”, Production Planning & Control, Vol. 26, pp. 280-295.
Kjellsdotter Ivert, L. K. et al. (2015b), “Contingency between S&OP design and planning environment’, International Journal of Physical Distribution & Logistics Management, Vol. 45, No. 8, pp. 747-773.
Kristensen, J. and Jonsson, P. (2018), “Context-based sales and operations planning (S&OP) research: A literature review and future agenda”, International Journal of Physical Distribution & Logistics Management, Vol. 48, No. 1, pp. 19-46.
Lapide, L. (2004a), “Sales and Operations Planning Part I: The Process”, The Journal of Business Forecasting, Fall-2004, pp. 17-19.
Lapide, L. (2004b), “Sales and Operations Planning Part III: A Diagnostic Model”, The Journal of Business Forecasting, Spring-2005, pp. 13-15.
Lapide, L. (2011), “S&OP: The Linchpin Planning Process”, The Journal of Business Forecasting, Fall-2011, pp. 18-20.
Manuj, I. and Sahin, F. (2011), “A model of supply chain and supply chain decision-making complexity”, International Journal of Physical Distribution Logistics Management, Vol. 41, No. 5, pp. 511–549.
McCall, A. S. (2013), “Sales & Operations Planning: Sales' Insight in the Planning Process”, The Journal of Business Forecasting, Vol. 32, No. 3.
Noroozi, S. and Wikner, J. (2017), “Sales and operations planning in the process industry: a literature review”, International Journal of Production Economics, Vol. 188, pp. 139-155.
Olhager, J. et al. (2001), “Long-term capacity management: linking the perspectives from manufacturing strategy and sales and operations planning”, International Journal of Production Economics, Vol. 69, No. 2, pp. 215-255.
Oliva, R. and Watson, N. (2011), “Cross-functional alignment in supply chain planning: a case study of sales and operations planning”, Journal of Operations Management, Vol. 29, pp. 434-448.
Scavarda, L. F. et al. (2006), “Reference Matrix for Information System in Supply Chain Management”, Brazilian Journal of Operations and Production Management, Vol. 3, No. 1, pp. 21-48.
Scavarda, L. F. et al. (2017), “A case method for Sales and Operations Planning: a learning experience from Germany”, Production, Vol. 27, No. Spe., e20162199.
Seeling, M. X. et al. (2020), “Sales and operations planning application: a case study in Brazil”, In: Leiras A. et al. (Eds.), Operations Management for Social Good, 2018 POMS International Conference in Rio, Springer Proceedings in Business and Economics Series, Springer International Publishing. In press.
Snow, C. (2007), Sales and Operations Planning Measuring Maturity and Opportunity for Operational Performance Management Research Report, Ventana Research, San Mateo/CA, USA.
Thomé, A. M. T. et al. (2012a), “Sales and Operations Planning: a research synthesis”, International Journal of Production Economics, Vol. 138, No. 1, pp. 1-13.
Thomé, A. M. T. et al. (2012b), “Sales and Operations Planning and the firm performance”, International Journal of Productivity and Performance Management, Vol. 61, No. 4, pp. 359-381.
Thomé, A. M. T. et al. (2014a), “The impact of sales and operations planning practices on manufacturing operational performance”, International Journal of Production Research, Vol. 52, No. 2, pp. 2108-2121.
Thomé, A. M. T. et al. (2014b), “Complexity as contingency in Sales and Operations Planning”, Industrial Management & Data Systems, Vol. 114, No. 5, pp. 678-695.
Thomé, A. M. T. et al. (2014c), “Research synthesis in collaborative planning forecast and replenishment”, Industrial Management & Data Systems, Vol. 114, No. 6, pp. 949-965.
Tuomikangas, N. and Kaipia, R. (2014), “A coordination framework for sales and operations planning (S&OP): synthesis from the literature”, International Journal of Production Economics, Vol. 154, August, pp. 243-262.
Viswanathan, N. (2009), Sales and Operations Planning: Integrate with Finance and Improve Revenue, Aberdeen Group, Boston/MA, USA.
Wagner, S. M. et al. (2014), “The game plan for aligning the organization”, Business Horizons, Vol. 57, No. 2, pp. 189-201.
Wallace, T. F. and Stahl, R. A. (2006), Sales and Operations Planning the Executive’s Guide, T. F. Wallace Co.
Wing, L. and Perry, G. (2001), “Toward Twenty-First-Century Pharmaceutical Sales and Operations Planning”, Pharmaceutical Technology N.A., Vol. 21, No. 11, pp. 20-26.
Yin, R. K. (2009), Case Study Research: Design and Methods, 4th ed., Sage Publications, Thousand Oaks/CA.
Zago, C. F. and Mesquita, M.A. (2015), “Advanced planning systems (APS) for supply chain planning: a case study in dairy industry”, Brazilian Journal of Operations & Production Management, Vol. 12, No. 2, pp. 280-297.
Received: 14 Mar 2019
Approved: 28 Jun 2019
DOI: 10.14488/BJOPM.2019.v16.n3.a6
How to cite: Seeling, M. X.; Scavarda, L. F.; Thomé, A. M. T. (2019), “A sales and operations planning application in the Brazilian subsidiary of a multinational chemical company”, Brazilian Journal of Operations & Production Management, Vol. 16, No. 3, pp. 424-435, available from: https://bjopm.emnuvens.com.br/bjopm/article/view/827 (access year month day).