Group of Research and Extension in Agroindustrial Logistics (ESALQ-LOG), College of Agriculture “Luiz de Queiroz”, University of São Paulo, Piracicaba, São Paulo, Brazil.
Group of Research and Extension in Agroindustrial Logistics (ESALQ-LOG), College of Agriculture “Luiz de Queiroz”, University of São Paulo, Piracicaba, São Paulo, Brazil.
Group of Research and Extension in Agroindustrial Logistics (ESALQ-LOG), College of Agriculture “Luiz de Queiroz”, University of São Paulo, Piracicaba, São Paulo, Brazil.
Group of Research and Extension in Agroindustrial Logistics (ESALQ-LOG), College of Agriculture “Luiz de Queiroz”, University of São Paulo, Piracicaba, São Paulo, Brazil.
Goal: To evaluate the potential of strategies to promote green corridors of soybean exports from Brazil to China.
Design / Methodology / Approach: The best transportation corridors are evaluated in terms of minimum transportation cost and minimum CO2 emissions in transport. This problem was modelled as a linear programming problem and was solved by GAMS. It involves transporting soybeans from the producing farms in the Brazilian Center-West to the main Brazilian export ports and, subsequently, to China, through the various logistical infrastructures available.
Results: In general, strategies aimed to reduce CO2 emissions in the Brazilian soybean exports to China, and also promote the reduction of transport costs, as presented in the results of the different scenarios. Since the greatest impact on both indicators came from the use of Capesize ships, the study suggests that investments in port infrastructure to increase its vessel berthing capacity generate positive impacts, both in terms of lower transportation costs and CO2 emissions.
Limitations of the investigation: The producing regions were divided in mesoregions. The road distance considered is between the centroid of the producing region to the destination.
Practical implications: Especially in the scenarios of unrestricted transport infrastructure, the study suggests the configuration of optimum soybean flows, as well as the respective level of utilization of multimodal terminals. From the findings of the study, agents involved in the logistics of exporting soy to China can identify the investments in rail and port terminals necessary to a greener logistics.
Originality / Value: This work will contribute to the literature in the Green Supply Chain Management field of study, especially in a Brazilian perspective.
Keywords: Mathematical model; Maritime transport; Soybean; Green corridors; CO2 emissions from transport.
The market-oriented reforms in the late-1970s have significantly increased China’s share of international trade and, as a result, its trade relationship with Brazil. The economic reforms allowed China’s GDP to increase from less than 1% of the world economy to over 15%, and increase its share of global trade also from less than 1% to almost 12% in 2016 (Wu, 2013 apud Creutzfeldt, 2019).
The bilateral trade relations between Brazil and China reflect the specialization of Chinese economy, focused on exports of high value-added and high-tech products, and imports of raw materials and intermediate goods. The currency devaluation has made Chinese products even more attractive to the Brazilian market. Not only Brazil has a significant domestic market, but it also holds the very resources and fertile lands that China needs to guarantee its sustainable economic growth (Creutzfeldt, 2019). The scarcity of natural resources needed to maintain its growth rates has led China to consolidate an international raw material supply network (Thorstensen, 2011). Brazil is one of the most complementary regions with China in terms of natural resources and is included in this commodity supply network (Costa and Mendonça, 2017).
China has systematically increased trade partnership with Brazil, while it is in a trade war with the United States. It could open new trade opportunities for Brazilian international trade, especially regarding the need to meet the increasing Chinese demand for soybeans. The environmental standards set by Chinese industry groups are currently among the most rigorous in the world and are exploring new standards for corporate social responsibility and political risk (Creutzfeldt, 2019). In this context, it becomes strategic for Brazil to identify more economically and environmentally friendly transportation options to deliver its soybean exports to the Chinese market (here called as green transport corridors), ensuring a more sustainable trade relationship between Brazil and China in the long term.
Regarding soybeans, they are traded in whole soybean and in its two derivative products (soybean oil and soybean meal), which are obtained through crushing. In this process, whole soybeans are pressed and separated, producing, roughly, 78.5% soy meal and nearly 19% soy oil. The remaining 2.5% is lost in processing. Approximately 85% of the total global soybean crop is crushed (Almeida et al., 2013; Brown-Lima et al., 2010). Whole soybeans are consumed as tofu, meat substitutes, soy sauce and other soy products. Soybean meal is usually converted in animal feed for chicken, pork, beef, and farmed fish, becoming the largest source of protein feed in the world. Only two percent of soy meal is processed into soy flours and proteins used in food. Soybean oil is mainly used as table oil; however, the proportion used for biodiesel production is increasing significantly, due to its economic feasibility and the drive to use greener fuels (Almeida et al., 2013; Brown-Lima et al., 2010; Leiras and Hamacher, 2008).
There are four major players in the global whole soybean export market: China, as the main importer, and the United States, Brazil, and Argentina, as the main exporters. Global soybean production rose 14 times between 1950 and the crop year 2009/2010, from 17 million tons to 250 million tons (Brown-Lima et al., 2010). Soybean production continues to grow and reached 348 million tons in trade year 2016/2017 (Salin, 2017a). Soybean production in Brazil has increased threefold between 2000 and 2018, from 38 million tons to 119 million tons, of which around 65% were exported (Secretaria Nacional de Portos, 2019). As a result, Brazil is the main world exporter, accounting for 54% of international soytrade.
However, Brazil’s transportation system has a series of bottlenecks, increasing transportation costs and lowering profits. Trucks transport most of produced soybeans from farms to ports and travel around 2,000 kilometers in low quality highways. In the ports, trucks and ships may face long queues, which lead to high waiting times. This inefficiency causes transportation from Mato Grosso to Brazilian ports to cost more than four times the transportation from American mid-western states to American ports (Brown-Lima et al., 2010).
On the other hand, society is demanding actions that promote more integrated, efficient and environmentally friendly transportation involving long distance routes. Multimodal Logistic Platforms (MLP) can improve both economic and social developments, generate cost reductions, enhance the cargo transportation flow, and expand international trade (Mamede et al., 2017).
In this context, there are studies that are being carried out, especially in Europe, to give overall support and recommendations on the development of green transport corridors for freight (Aditjandra et al., 2012; Clausen et al., 2012; Fozza and Recagno, 2012; Psaraftis and Panagakos, 2012). Green corridors concern transportation corridors that have a set of viable economic and logistical attributes, together with environmental characteristics (Bektaş et al., 2019).
This study aims to evaluate the potential of strategies to promote green corridors of soybean exports from Brazil to China, with the construction of a mathematical model that optimizes the soybean supply in a multimodal logistics network, both in terms of minimum transportation cost and of minimum transportation CO2 emissions. In addition, it will contribute to the literature in the Green Supply Chain Management field of study, especially in a Brazilian perspective.
This work is a more robust version of a previous study presented at Production and Operations Management Society - POMS Conference (Péra et al., 2020), since the model is solved by the modeling system for mathematical optimization GAMS 25.1.2 instead of Microsoft Excel. Consequently, some limitations imposed by the software in the first study were eliminated, generating more accurate and consistent results.
The rest of this paper is organized as follows. After presenting a literature review on the Brazil-China trade relationship, Brazilian soybean exportation logistics and green transport corridors, the methodology, the problem and the mathematical models are defined. Finally, the computational experiments and the results are discussed, and this work is concluded.
The Brazil-China commercial relationship officially began in 1978 with the signature of the Bilateral Trade Agreement, and was driven by the common need for political and economic insertion of both countries in the international scenario (Costa and Mendonça, 2017; Mendes et al., 2013). At that time, China aimed at strengthening and opening its economy to the West, in opposition to its isolation during the Mao Tsé-Tung period.
However, Brazil-China relations have been evolving cautiously, given the international scenario and the domestic circumstances of each country. The process of rapprochement between the two countries and the construction of a strategic partnership were boosted mainly after China's entry into the World Trade Organization (WTO) in 2001 (Costa and Mendonça, 2017; Dick, 2006).
In 2009, the Asian country became Brazil's main trading partner as the largest buyer of Brazilian exports. Only three years later, China became the main supplier of products imported by Brazil. However, Brazil's export composition to China is concentrated in commodities, mainly soybeans and iron ore, while its imports from China are focused on industrialized goods (Mortatti et al., 2011). Despite exporting a series of products, such as iron ore, sugar, cellulose, beef, and chicken, soybeans are the main Brazilian commodity sold to China. It accounts for more than 40% of total Brazilian exports and for over US$ 20 billion in revenue in recent years.
China's access to the WTO was part of a broader strategy of the Chinese government aimed at increasing the country’s importance in the world economy. Besides its market-oriented reforms and monetary policies, the increase of Chinese direct investment abroad would strengthen the internationalization of major Chinese companies, while allowing China to secure sources of raw material and agricultural products needed to sustain its growth rates (CEIC, 2019; Costa and Mendonça, 2017).
The Chinese strategy to increase its global economic importance is evident in several aspects. China’s One Belt One Road (OBOR), one of the most ambitious infrastructure megaproject, will stretch from the very edge of East Asia to East Africa and Central Europe, connecting approximately two thirds of the world’s population and 40% of its economic output. Costing between $4-8 trillion and affecting 65 countries, the investments will address contiguous networks of highways, railways, ocean routs and ports.
Also aligned to that goal, in 2016, Beijing announced its second policy paper for engagement with Latin America and the Caribbean (LAC), emphasizing the idea of collaboration among countries. Its Latin America strategy highlights that the Chinese development is only possible if other developing countries are part of this goal and are joining in the process (Myers and Wise, 2017 apud Creutzfeldt, 2019). It suggests a new way for China to share its development experience with other regions, combining the transfer of its excess financial and industrial capacity abroad, besides its expertise in infrastructure, such as the building of roads, railways, ports and energy plants. Ultimately, despite the physical distance, Latin America has been, in certain way, included in the One Belt, One Road Initiative (Creutzfeldt, 2019).
Specifically in Brazil, it was launched the Brazil-China Fund in 2017, aiming to establish a mechanism to finance projects of common interest in infrastructure, logistics, energy, mining, and agribusiness, among others. The partnership investments of about US$ 20 billion in such projects - US$ 15 billion invested by Chinese and US$ 5 billion by Brazilian institutions (Brasil, 2017).
Brazil and China began informal trade in 1949. In the 1990s and in early 2000s, there was a formal agreement, which led to a boom in bilateral trade (Brown-Lima et al., 2010). From 1998 to 2017, Brazil’s whole soybeans exports to China increased 53 times, from 0.9 million tons to 49.9 million tons (MAPA, 2017), becoming the main Brazilian exported product and the main destination with 9.8% of total Brazilian exports (MDIC, 2019). Since 2015, the value of Brazilian soybeans exported to China is greater than Brazilian second most exported product, iron ore, considering all its destinations (MDIC, 2019).
Three main factors explain this rapid advance from the 1970’s. Firstly, the Brazilian government offered subsidies and price supports to soybean farmers, increasing exports and generating currency to pay for imports, e.g. petroleum (Brown-Lima et al., 2010). Secondly, Japan provided technical assistance to increase soybean production on marginal areas. Finally, the United States soybean export embargo in 1973 artificially raised soybean world prices, turning it into a highly profitable crop (Brown-Lima et al., 2010).
More recently, it is important to highlight the significant increase in China’s soybean consumption as an important driver of Brazilian production. In the last 20 years, China’s consumption increased 351%, from 27 million tons in 2000 to 122 million tons in 2016/2017 (Clever and Ward, 2017). Moreover, in 2016/2017, China imported 93 million tons of soybeans, mainly from the United States, Brazil and Argentina, which is over 63% of the soy exported worldwide (Foreign Agricultural Service/USDA, 2017). The country’s industrialization and increase in household income led to a higher consumption of non-perishable foods, especially dairy, eggs, and meat. Thus, the dietary transition led to increased demand for soy meal for animal feed. As China is the most populous country in the world, with 19% of the world’s population, this higher demand have changed the global soybean trade over a relatively short period (Brown-Lima et al., 2010).
The Center-West region of Brazil comprises the states of Mato Grosso, Goiás, Mato Grosso do Sul and the Federal District. It is the main soybeans producing region, accounting for 46% of total Brazilian production for the crop year 2015/2016 (CONAB, 2019), and the second main exporting region to China, with 37% of total Brazilian soybeans exported to China in 2017 (MAPA, 2017).
Trucks transport 67% of Brazilian whole soybeans production, traveling long distances from farms to ports (Almeida et al., 2013). In contrast, from 2002 to 2011, trucks transported only 13% of the United States soybean export, 50% by barge and 37% by rail (Denicoff et al., 2014).
Mato Grosso is the biggest soybeans producing state, with 27% of total Brazilian production for the crop year 2015/2016 (CONAB, 2019), and the biggest soybean exporting state to China, with 23% of total Brazilian soybeans exported to China in 2017 (MAPA, 2017). All soybeans from Mato Grosso are exported to China mainly through the port of Santos, with 61% of the volume in 2017 (MDIC, 2019). Until 2016, the ports of Vitoria and Paranaguá alternated second and third places, with the port of São Francisco do Sul occasionally following close. However, from 2015 the ports of Barcarena and São Luis has become more competitive, assuming second and third places in 2017 with, 15% and 8% of Mato Grosso soybean exports to China, respectively (MDIC, 2019). Soybean production travels at least 1,100 kilometers by truck from farms in Mato Grosso to the port in Miritituba, located on the Tapajos River. This journey through highway BR-163 lasts three days. At the port of Miritituba, soybeans are loaded onto barges and transported along 1,000 kilometers for another three days, reaching the port of Barcarena, where they are loaded onto Panamax-size vessels (Bunge, 2014; Salin, 2017b; Soybean & Corn Advisor, 2014).
Goiás is the fourth soybean producing state, accounting for 11% of total Brazilian production for the crop year 2015/2016 (CONAB, 2019), and the fourth state exporting soybeans to China, with 8% of total Brazilian soybeans exported to China in 2017 (MAPA, 2017). All soybeans from Goiás are exported to China mainly through the ports of Santos and Vitoria, with 51% and 41% of volume in 2017, respectively (MDIC, 2019).
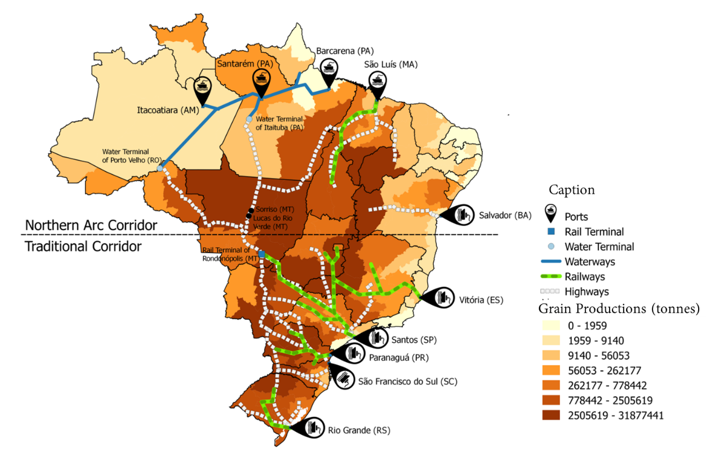
Mato Grosso do Sul is the fifth soybean producing state, accounting for 8% of total Brazilian production for the crop year 2015/2016 (CONAB, 2019), and the sixth state exporting soybeans to China, responsible for 6% of the total Brazilian soybeans exported to China in 2017 (MAPA, 2017). All soybeans from Mato Grosso do Sul are exported to China mainly through the ports of Paranaguá, São Francisco do Sul, and Santos, with 39%, 31%, and 26% of volume in 2017, respectively (MDIC, 2019). In the past five years, the ports of Paranaguá and São Francisco do Sul alternated first and second places. Figure 1 presents the grain export logistics corridors in Brazil.
Figure 1. Export logistics corridors in Brazil, with emphasis on Mato Grosso.
Source: Prepared by the authors based on data from the Brazilian Institute of Geography and Statistics (Instituto Brasileiro de Geografia e Estatística - IBGE, 2017).
The concept of green transport corridors for freight was introduced in 2007 in the European Commission’s Freight Transport Logistics Action Plan. This document introduced a series of policy initiatives and a number of short to medium-term actions to develop integrated, efficient and environmentally friendly freight transportation between major hubs and over relatively long distances. Its goals are to develop sustainable and competitive co-modal freight services in Europe (Aditjandra et al., 2012; European Commission, 2007; Panagakos et al., 2016; Psaraftis and Panagakos, 2012; SuperGreen, 2013).
In order to promote environmental sustainability and energy efficiency, whilst accommodating increasing traffic volume, these corridors will need to use co-modality and advanced technology. These may include strategic located transshipment facilities and supply points ready for bio-fuels or other forms of green propulsion, or testing environmentally-friendly and innovative transport units, and advanced Intelligent Transport Systems (ITS) applications (Panagakos et al., 2016; Psaraftis and Panagakos, 2012).
This concept was developed further within the SuperGreen. This project was launched in 2010 to support the Action Plan on green corridors issues (SuperGreen, 2013). It was also epitomized by the 2011 White Paper on Transport, which aims to shift road freight carried over 300 km to more environmentally sustainable modes, such as rail or waterborne transport (30% by 2030 and 50% by 2050), in order to achieve an overall 60% greenhouse gas (GHG) emission reduction (Aditjandra et al., 2012; European Commission, 2011).
Later, the Swedish Logistics Forum has advanced this definition by stating that the Green Corridors’ goal is to decrease environmental and climate impact and enhance safety and efficiency. Characteristics of a green corridor include (Fastén and Clemedtson, 2012; Panagakos et al., 2016; Psaraftis and Panagakos, 2012; Tetraplan and Helena Kyster-Hansen, 2011):
Despite their differences, an important aspect of green corridors concepts is that they are more than just economically efficient and they are more than just environmentally sustainable; they are both economically efficient and environmentally sustainable (Panagakos et al., 2016).
In addition, since their inception, green corridors are considered a popular policy tool that increases transport environmental sustainability through improving the competitiveness of greener transportation modes such as railways and waterways over road freight (Panagakos et al., 2016).
Currently, most of studies already published in the literature are based on or are derived from the SuperGreen Project (Aditjandra et al., 2012; Clausen et al., 2012; Fozza and Recagno, 2012; Psaraftis and Panagakos, 2012). That project was launched to support the development of sustainable transport networks by giving overall support and recommendations on green corridors to the EU’s Freight Transport Logistics Action Plan. A methodology consisting of following the steps shown in Figure 2 was developed in this project.
Figure 2. Methodology developed by the SuperGreen Project.
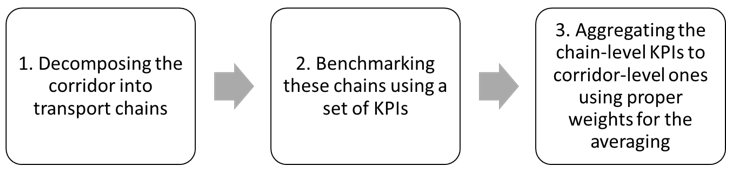
Source: Authors, based on SuperGreen (2013).
The set of Key Performance Indicators - KPIs proposed by the SuperGreen project resulted from a process that included the compilation of a list of performance indicators and their categorization into different groups. In the final set, indicators focus on economic (efficiency and service quality) and environmental aspects (Table 1). Basically, the infrastructural and social aspects are absent (Panagakos et al., 2016; SuperGreen, 2013).
Table 1. Set of KPIs suggested by the SuperGreen Project.
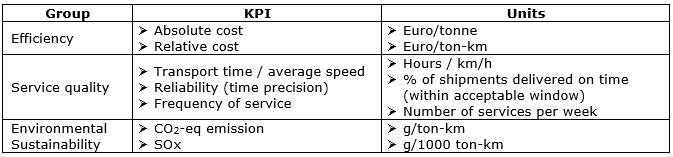
Source: The authors, based on SuperGreen (2013) and Panagakos et al. (2016).
Besides the set of KPIs proposed by the SuperGreen Project, Panagakos et al. (2016) cites two other sets of indicators, suggesting the different perspectives and level of detail can be employed (Table 2).
In the Swedish Green Corridors Initiative (SGCI), the term green is seen from an ecological perspective and the selected criteria cover only the environmental dimension. These environmental criteria are measured in both absolute and relative terms, with the absolute indicator measuring actual emissions generated by a transport activity and reflecting transport work volume, and the relative indicator showing the environmental efficiency of the same transport activity.
On the other hand, in the East-West Transport Corridor (EWTC) project, the term green combines all three sustainability dimensions (economic, environmental and social efficiency). Besides that, it groups the indicators into operational (aiming at optimizing cargo flows in the short run; addressing the perspectives of transport service providers) and enabling ones (aiming to optimize the long term development of the corridor, relevant to infrastructure managers and policy makers).
Table 2. KPI selection from SCGI and EWTC projects.
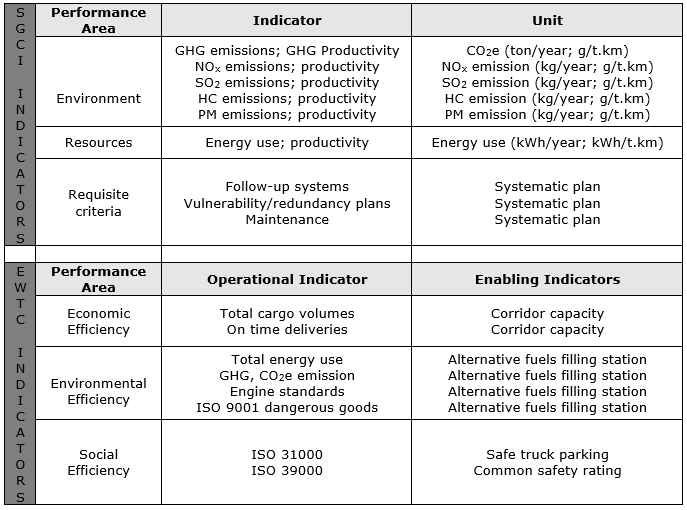
Source: The authors, based on Panagakos et al. (2016).
Table 3 details the KPIs chosen to evaluate green corridors in some of the studies found in international journals when searching for keywords “green transport / freight / logistics corridors” (Aditjandra et al., 2012; Clausen et al., 2012; Fozza and Recagno, 2012; Panagakos et al., 2016; Psaraftis and Panagakos, 2012). The green aspects that are mostly considered reflect economic (cost and service quality) and environmental issues (CO2 and pollutants emission). It is important to highlight that, in general, they: (a) have a qualitative approach; (b) are derived on or are related to the SuperGreen Project; and (c) apply the KPIs to evaluate green corridors in Europe.
Table 3. KPIs chosen to evaluate green corridors.
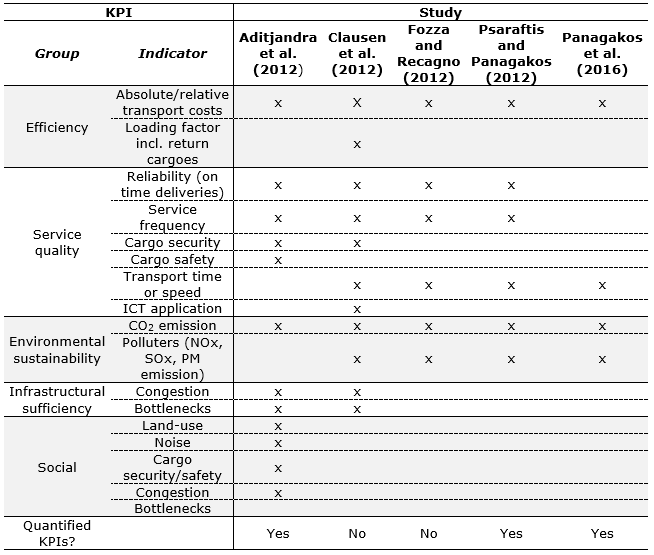
Source: The authors.
Therefore, there is no clear definition about green corridors, not even the indicators or methods used to quantify how green a corridor is. The indicators can be selected according to the authors and the goals of the study.
International transport involves various modes of transport along the corridors, and efficiency improvement is essential to guarantee competitiveness and low environmental impacts during the transport operations. Literature suggests modal shift from road to intermodal transport or other environmental friendly modes, such as railway or waterways, as a way to reduce emissions from transportation (Mamede et al., 2017). The development of intermodal transport corridors for freight can contribute to mitigate environmental impacts related to emissions of pollutants (Regmi and Hanaoka, 2012). Concerning this issue, studies have been developed aiming to consider the environmental aspect of intermodal corridors. As an example, they are analyzing the energy consumption of intermodal transport modes and/or GHG emissions from trucks, trains, barges, and ships during operation along a transport corridor (Farzaneh et al., 2011; Hanaoka et al., 2011) or even suggesting the development of intermodal freight transport and logistics from environmental perspectives (Hanaoka and Regmi, 2011).
Regmi and Hanaoka (2012) assess and compare the performance of the intermodal transport corridors linking North-East and Central Asia thought time-cost-distance approach. They also suggest policy recommendations to improve infrastructure and minimize barriers to enhance operational efficiency of the intermodal transport corridors.
In an inland perspective of transport, Ehmke et al. (2018) compare total cost, fuel consumption/emissions, distance, and travel time for routes. They conclude that minimizing the total cost often increases fuel consumption only minimally the over routes optimized for fuel consumption.
A quantitative study developed by Péra et al. (2020) has considered an economic and an environmental aspect of green corridors. More specifically, the analysis was concerned about finding the logistics corridor that minimizes transportation costs and CO2 emissions, comparing all transportation mode alternatives (such as highways, railways and waterways) available through that logistic corridor. The authors aimed to evaluate the potential of strategies to promote green corridors of soybean exports from Brazil to China, running a mathematical model in MS Excel spreadsheets and using the Simplex LP algorithm.
In this paper, the problem is modelled as a linear programming problem and was solved by GAMS. It involves transporting soybeans from the producing farms in the Brazilian Center-West to the main Brazilian exports ports through the various logistical infrastructures available. Subsequently, the maritime transport flows from Brazilian ports to China were modelled considering two distinct sea routes and using different types of ships. Finally, six scenarios were analyzed regarding total average transport cost, total average greenhouse gas emissions and quantity handled in each logistics activity.
The studied problem involves transporting soybeans through road transportation from the producing farms i (i=1,…,m) in the Brazilian Center-West (Mato Grosso, Mato Grosso do Sul and Goiás) to the main Brazilian railway or waterway terminals j (j=1,…,n) or directly to the main Brazilian export ports k (k=1,…,o). The soybeans sent to the railway or waterway terminals j are also transported to the export ports k. Subsequently, the maritime transport flows l (l=1,…,p) from Brazilian ports k to China are modelled considering distinct sea routes (Cape of Good Hope and Panama Canal) and using different types of ships (Panamax, Post-Panamax, and Capesize). The problem consists of determining the transported soybeans volume from the producing farms to China through each logistical infrastructure available, such that balance flow in each node is respected and the total average transport cost is minimized. Alternatively, the same model is evaluated considering a different objective function of minimizing the total average greenhouse gas emissions. Figure 3 shows the logical structure of the logistics network modeling.
Figure 3. Graph of the logical structure of modeling
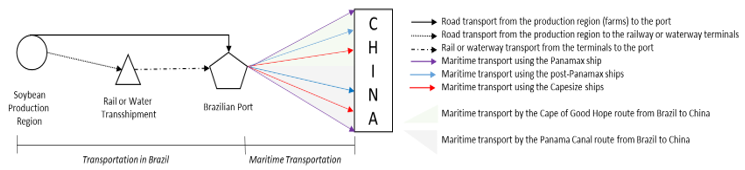
Source: The authors.
This problem is modelled as a linear programming problem. The parameters, the decision variables, and the mathematical model are given below:
Parameters:
dij = freight unit cost between producing region i and railway or waterway terminal j
eik = freight unit cost between producing region i and port k
fjk = freight unit cost between railway or waterway terminal j and port k
gkl = freight unit cost from port k to China through ship/route l
ai = producing region i capacity (in tons) (IBGE, 2017)
bj = railway or waterway terminal j capacity (in tons) (ANTAQ, 2018; ANTT, 2018)
ck = port k demand (in tons) (ANTAQ, 2018; MDIC, 2019)
hi = producing region i minimum supply volume (in tons)
Decision variables:
xij = transported volume between producing region i and railway or waterway terminal j (in tons)
yik = transported volume between producing region i and port k (in tons)
zjk = transported volume between railway or waterway terminal j and port k (in tons)
wkl = transported volume from port k to China through ship/route l (in tons)
Mathematical model:
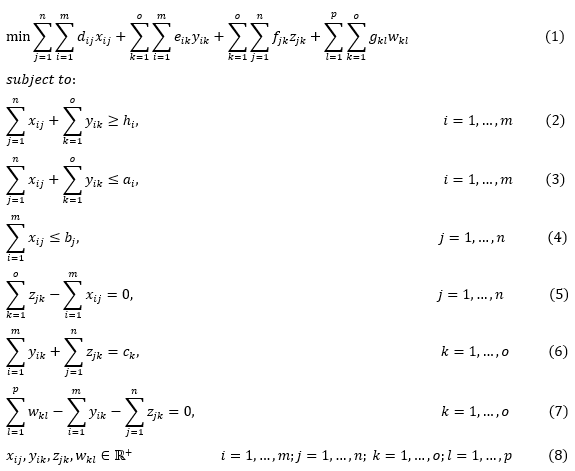
The objective function in Equation (1) minimizes the total average transport cost. The constraints in Equations (2) and (3) guarantee that the soybean volume sent from each producing region i is at least equal to its minimum supply volume hi and cannot exceed its producing capacity ai. The minimum supply volume ensures that all producing regions export soybeans, which is the current situation.
The constraint in Equation (4) ensures that the received volume in each railway or waterway terminal j is at most equal to its capacity bj. The constraint in Equation (5) guarantees that the volume sent from each railway or waterway terminal j is equal to its received volume.
Similarly, the constraint in Equation (6) ensures that the received volume in each port k is equal to its demand ck. The constraint in Equation (7) guarantees that the volume sent from each port k is equal to its received volume. The constraints in Equation (8) denote the domain of decision variables.
A second mathematical model considers a different objective function, subject to the same set of constraints.
Additional parameters:
qij = GHG emission from producing region i to railway or waterway terminal j (kg of CO2 per ton per km)
rik = GHG emission from producing region i to port k (kg of CO2 per ton per km)
sjk = GHG emission from railway or waterway terminal j to port k (kg of CO2 per ton per km)
tkl = GHG emission from port k to China through ship/route l (kg of CO2 per ton per km) (Laboratory for Maritime Transport, 2008)
aaij = distance from producing region i to railway or waterway terminal j (in km)
abik = distance from producing region i to port k (in km)
acjk = distance from railway or waterway terminal j to port k (in km)
adkl = distance from port k to China through ship/route l (in km)
Mathematical model:
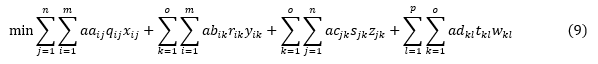
subject to: Eqs. (2) to (8)
The objective function in Eq. (9) minimizes the total average GHG emissions.
The data utilized in this work are from 2016. The producing regions i were divided into 14 mesoregions. The freight unit costs dij, eij, fjk and gkl were calculated considering the main routes in each producing region (ESALQ-LOG, 2019). The minimum supply volume hi of producing regions was calculated as 10% of the capacity ai of the regions.
The mathematical formulation was solved by the modeling system for mathematical optimization GAMS 25.1.2. Six scenarios were analyzed regarding total average transport cost, total average GHG emissions (kg of CO2 per ton of transported soybean) and quantity handled in each logistic activity. Table 4 presents the configuration of each analyzed scenario, parameters changed and adjustments in the mathematical model.
Table 4. Scenarios’ description
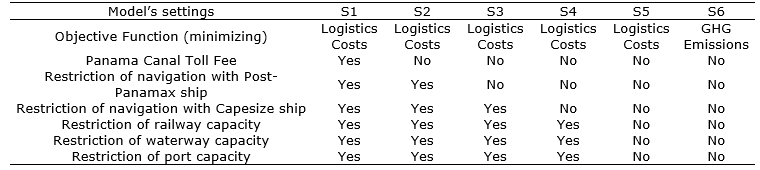
In Scenarios 1 to 4, the demand ck of port k is the current demand for each port in 2016. On the other hand, the infrastructure used to transport soybean from the farms to the ports (road, railway or waterway) is chosen as a decision variable, and may be different from the transportation mode currently used.
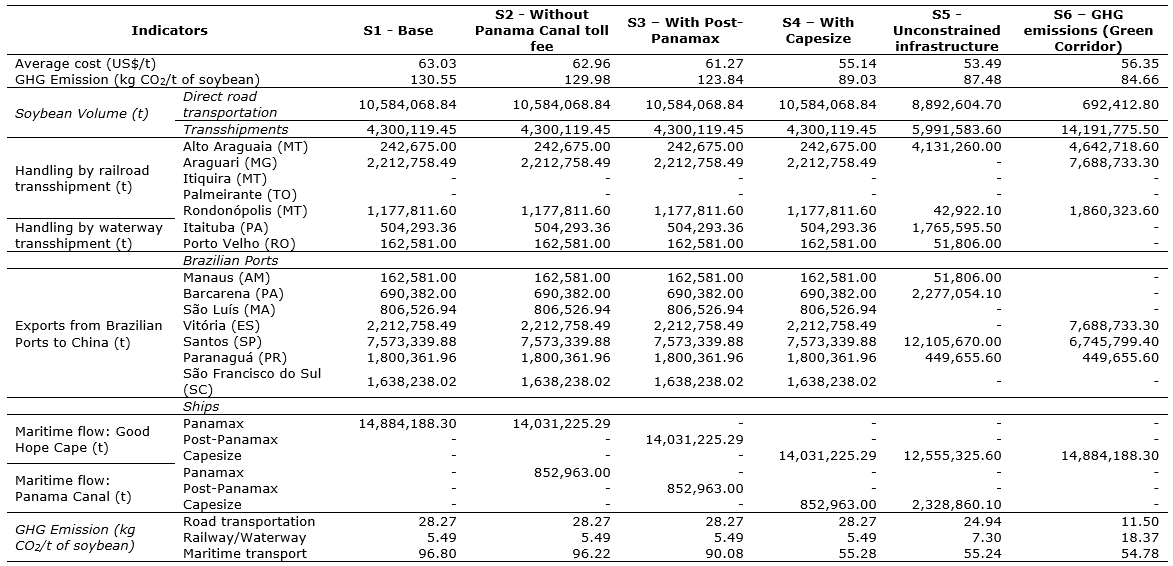
Table 5 presents the result of the six analyzed scenarios. The Table also highlights the quantities handled in each Brazilian port and in each rail and waterway transshipment terminal, as well as the volume of soy allocated in each maritime route and type of ship. All scenarios consider the same total exported volume of 14.9 million tons of soybeans.
The first scenario shows that the total average cost was US$ 63.03 per ton, with an emission of 130.55 kg of CO2 per ton of transported soybeans. The soybean was moved using only the Panamax ship along the route of the Cape of Good Hope, which has been the Brazilian reality.
In Scenario 2, the withdrawal of the Panama Canal toll fee was analyzed. The soybeans sent from the northern ports of Brazil have a comparative advantage in terms of maritime transport costs using the Canal in comparison to the traditional route of Cape of Good Hope; however, the toll fee currently charged by the Canal has taken away this comparative advantage. In this scenario, there was a slight reduction in the total average transportation cost to US$ 62.96 per ton and in the total average GHG emission to 129.98 kg of CO2 per ton of soybean. As expected, soybeans sent from the ports of Manaus and Barcarena took the Panama Canal route, which accounts for 6.1% of the total exported volume.
Scenario 3 assesses the use of Post-Panamax ships, which would require infrastructure improvements in the Brazilian ports. As this ship is bigger than the Panamax (90,000 tons against 60,000 tons), freight cost per ton is lower, so all exported volume would use Post-Panamax ships. The transport cost was reduced to US$ 61.27 per ton and the GHG emission, to 123.84 kg of CO2 per ton of soybeans transported. Again, 6.1% of the total exported volume traveled through the Panama Canal.
Scenario 4 considers the use of Capesize ships, which would require even bigger improvements in Brazilian ports. The Capesize-type ship has greater transport capacity (150,000 tons) and is more efficient in terms of fuel consumption and GHG emission. All exported volume uses Capesize ships and there was a drastic reduction in the total average transportation cost to US$ 55.14 per ton and in the total average GHG emission, to 89.03 kg of CO2 per ton of transported soybeans. Once more, exports from the ports of Manaus and Barcarena took the Panama Canal route (6.1% of the total exported volume).
As can be seen on Table 5, the only difference among Scenarios 1 to 4 lies in the choice of maritime route and type of ship. Transportation inside the Brazilian territory remained the same.
In Scenario 5, railway and waterway terminals’ and ports’ capacities were considered unlimited. Both the transport cost and the emission level of GHG were reduced, to US$53.49 per ton and 87.48 kg of CO2 per ton, respectively. In addition, it is possible to assess the infrastructure required to promote a greener and cheaper transportation, involving the substantial capacity expansion of the Alto Araguaia rail terminal, the Itaituba water terminal, and the ports of Barcarena and Santos. Again, all exported volume is sent in Capesize ships, with Manaus and Barcarena cargo traveling through the Panama Canal (15.6% of the total exported volume).
Scenario 6 considered a different objective function of minimizing total average GHG emission. There is a reduction in the GHG emission level in comparison to Scenario 5 (84.66 kg of CO2 per ton) and an increase in logistics cost (US$ 56.35 per ton). This scenario assesses what the recommended infrastructure configuration for a green corridor should be: capacity expansion of the Alto Araguaia, Araguari and Rondonópolis rail terminals, capacity expansion of the port of Vitória, and use of Capesize type ships taking the Cape of Good Hope route to export soybeans from Brazil to China.
Table 5. Evaluation of scenarios for Brazilian soybeans exports to China
In Scenario 1, which reflects business as usual, the relative transport matrix from the total ton-kilometer for Brazilian soybeans exported to China is 4.4% by road, 1.3% by rail, 0.2% by waterway, and 94.0% by sea. However, the GHG emission matrix by modal has the following configuration: 21.7% by road, 3.7% by rail, 0.5% by waterway, and 74.1% by sea. For the total logistics cost, the participation by modal is 56.0% by road, 11.4% by rail, 0.9% by waterway and 31.7% by sea. It is important to highlight that the maritime modal is the one that presents the largest participation in the transportation matrix, as well as in the GHG emission matrix, but represents only the second highest transportation cost. Figure 4 shows the soybean supply logistics network to China, involving the Base Scenario (S1).
Figure 4. Soybean supply logistics network to China (S1) – Base Scenario
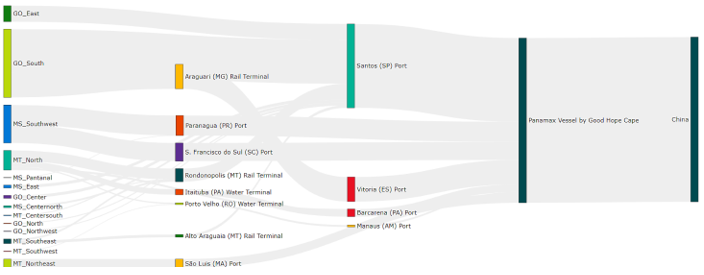
Source: Prepared by the authors from the results of the model
Scenario 5, with the minimum total average transportation cost, shows a transport matrix of 3.9% by road, 1.5% by rail, 0.7% by waterway, and 93.8% by sea. The GHG emission matrix is composed of 28.5% by road, 6.3% by rail, 2.0% by waterway, and 63.2% by sea. Regarding the total transport cost, it is divided in 59.3% by road, 15.2% by rail, 2.9% by waterway and 22.6% by sea. Higher volumes transported in railways and waterways and the use of Capesize ships in both routes lead to better-balanced matrices.
Finally, Scenario 6, which shows the configuration of minimum total average GHG emission (Green Corridor), has a transport matrix of 1.8% by road, 5.1% by rail, 0% by waterway, and 93.1% by sea. The GHG emission matrix is composed of 13.6% by road, 21.7% by rail, 0% by waterway, and 64.7% by sea. The total transport cost has 30.5% by road, 48.2% by rail, 0% by waterway and 21.3% by sea. It is interesting to note that the waterway is not used and that the road transportation is reduced drastically, as it is the modal with the highest GHG emission coefficients. The railway terminals of Itiquira and Palmeirante were not used in all scenarios. As only 14 mesoregions were considered, one possible reason is that the regions that operate with these two terminals were aggregated to other regions with higher volumes and better transport cost through other terminals or directly to the ports. Regarding the ports, São Luís and São Francisco do Sul were not used in both Scenarios 5 and 6.
Figure 5 shows soybeans’ supply logistics network to China involving the Green Corridor (S6).
Figure 5. Soybean supply logistics network to China – - GHG Emissions – Green Corridor Recommendation (S6)
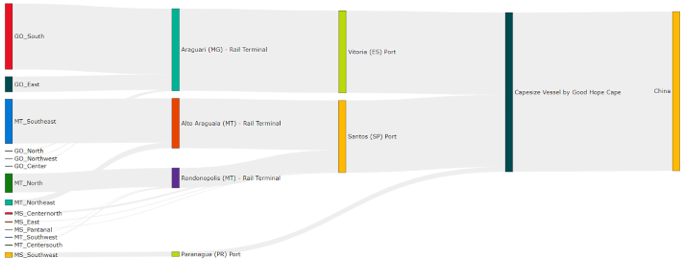
Source: Prepared by the authors from the results of the model
An interesting comparison regarding the various logistical infrastructures needed in the scenario that consolidates the green corridor of low GHG emissions and the scenario with the lowest logistic costs can be made. First, the flows are completely different. Despite the Alto Araguaia railway terminal and the Paranaguá port, all other terminals and ports were used in a very different way. Scenario 5 showed an increase in the use of waterway transportation, whilst Scenario 6 did not use waterways at all. The Araguari railway terminal and the Vitória port were not selected in Scenario 5, but received the highest volume in Scenario 6.
Second, the difference in total average transportation cost and in minimum total average GHG emission is significant, but not that high (+5.3% in costs and -3.2% in emissions).
Finally, the use of Capesize ships is extremely important to reduce both total average transportation cost and total average GHG emission. Excluding the Panama Canal toll fee is important in a total cost reduction scenario.
The obtained results are slightly different to those found in the previous work presented at the POMS Conference (Péra et al., 2020). It is expected that the model solved by GAMS generate more accurate and consistent results than the model solved by Microsoft Excel, due to the elimination of some limitations imposed by the software in the first study. In addition, this indicates potential improvements for the proposed mathematical model or for the structure of the utilized data.
The objective of this work was to evaluate potential strategies to promote green corridors for soybean exports from Brazil to China, through the construction of a mathematical model for optimizing the soybean supply in a multimodal logistics network, and considering transport costs and GHG emission levels in different simulated scenarios.
It is interesting to note that strategies aimed at reducing the levels of GHG emissions in Brazilian soybean exports to China also promote the reduction of transport costs, as presented in the results of the different scenarios. The greatest impact on both indicators came from the use of Capesize ships; due to the maritime transport representing around 93% of the relative transport matrix from the total ton-kilometer for Brazilian soybeans exported to China. Capesize ships have a greater transport capacity and a greater efficiency in terms of fuel consumption and GHG emission.
In the current scenario, there is a heavy use of road transport, an intermediate railway use, and a low use of waterways. When the objective is to minimize the total average transportation cost, both railway and waterway modals increase their importance, although road transportation continues to be the main modal. On the other hand, to minimize the total average GHG emission, the railway becomes the main modal, with an intermediate use of road transportation and no use of waterways.
Future works could consider a multi-objective problem, simultaneously assessing total average transport cost, total average greenhouse gas emissions, and other objective functions such as post-harvest loss. In addition, it would be interesting to consider micro regions, to increase the model’s accuracy, a larger period of data and potential improvements for the proposed mathematical model. It is also recommended to develop feasibility analyzes for the expansions of logistic infrastructures and the evaluation of new multimodal projects in the Brazilian territory that could promote green corridors that may be attractive to China.
Aditjandra, P. T. et al. (2012), “Investigating freight corridors towards low carbon economy: evidence from the UK”, Procedia - Social and Behavioral Sciences, Vol. 48, pp. 1865–1876.
Almeida, C. A. et al. (2013), “Rodovia Transoceânica: uma alternativa logística para o escoamento das exportações da soja brasileira com destino à China”, Revista de Economia e Sociologia Rural, Vol. 51, No. 2, pp. 351–368.
Agência Nacional de Transportes Aquaviários - ANTAQ (2018), “Instalações portuárias”, available at: http://portal.antaq.gov.br/ (accessed 28 Feb 2019).
Agência Nacional de Transportes Terrestres - ANTT (2018), “Infraestrutura ferroviária”, available at: http://www.antt.gov.br/ (accessed 28 Feb 2019).
Bektaş, T. et al. (2019), “The role of operational research in green freight transportation”, European Journal of Operational Research, Vol. 274, No. 3, pp. 807–823.
Brasil (2017), “Entenda como funciona o Fundo Brasil-China — Governo do Brasil”, available at: http://www.brasil.gov.br/economia-e-emprego/2017/05/entenda-como-funciona-o-fundo-brasil-china (accessed 19 June 2019).
Brown-Lima, C. et al. (2010), An Overview of the Brazil-China Soybean Trade and Its Strategic Implications for Conservation, The Nature Conservancy Latin America Region.
Bunge (2014), “Bunge inaugura complexo portuário no Pará e estabelece nova rota de exportação de grãos pelo norte do Brasil”, available at: http://www.bunge.com.br/imprensa/Noticia.aspx?id=636 (accessed 15 Sept 2017).
CEIC (2019), “China Direct Investment Abroad [1998 - 2019]”, available at: https://www.ceicdata.com/en/indicator/china/direct-investment-abroad (accessed 19 June 2019).
Clausen, U. et al. (2012), “Green corridors by means of ICT applications”, Procedia - Social and Behavioral Sciences, Vol. 48, pp. 1877–1886.
Clever, J. and Ward, M. (2017), “Peoples Republic Of, Oilseeds and Products Update, Historic Spike in Net Imports in MY16/17 likely to temper China’s Soybean Imports in MY17/18”, Global Agricultural Information Network, available at: https://gain.fas.usda.gov/Recent GAIN Publications/Oilseeds and Products Update_Beijing_China - Peoples Republic of_10-27-2017.pdf (accessed 6 Dec 2017).
Companhia Nacional de Abastecimento - CONAB (2019), “Séries históricas”, available at: http://www.conab.gov.br/.
Costa, F. K. S. and Mendonça, T. G. (2017), “Evolução Do Comércio Bilateral Entre Brasil E China: Análise Das Relações Comerciais”, Revista Economia e Desenvolvimento, Vol. 29, No. 2, pp. 73–90.
Creutzfeldt, B. (2019), “Overcoming the Greatest Distance: China in Latin America”, E-International Relations, available at: https://www.e-ir.info/2019/02/27/overcoming-the-greatest-distance-china-in-latin-america/ (accessed 19 June 2019).
Denicoff, M. R. et al. (2014), “Soybean transportation profile”, U.S. Department of Agriculture, Agricultural Marketing Service.
Dick, P. P. (2006), A parceria estratégica entre Brasil e China : a contribuição da política externa brasileira (1995-2005), Dissertação de Mestrado, Universidade Federal do Rio Grande do Sul, available at: https://lume.ufrgs.br/handle/10183/8089 (accessed 19 June 2019).
Ehmke, J. F. et al. (2018), “Optimizing for total costs in vehicle routing in urban areas”, Transportation Research Part E: Logistics and Transportation Review, Vol. 116, pp. 242–265.
ESALQ-LOG (2019), “SIFRECA - Sistema de informações de fretes”, Grupo de Pesquisa e Extensão em Logística Agroindustrial, available at: https://sifreca.esalq.usp.br/.
European Commission (2007), “Freight Transport Logistics Action Plan”, COM(2007) 607 Final, Commission of the European Communities, Brussels, available at: http://eur-lex.europa.eu/legal-content/EN/TXT/?uri=celex:52007DC0607 (accessed 5 December 2017).
European Commission (2011), “White Paper: Roadmap to a Single European Transport Area – Towards a competitive and resource efficient transport system”, COM(2011) 144 Final, Commission of the European Communities, Brusseks, available at:https://doi.org/http://ec.europa.eu/transport/strategies/doc/2011_white_paper/white_paper_2011_ia_full_en.pdf.
Farzaneh, M. et al. (2011), “Corridor-Level Air Quality Analysis of Freight Movement”, Transportation Research Record: Journal of the Transportation Research Board, Vol. 2233, pp. 19–26.
Fastén, G. and Clemedtson, P. O. (2012), Green Corridor Manual. An East West Transport Corridor II Report, available at: http://www.ewtc2.eu/media/310370/ewtcii_manual_lowres.pdf (accessed 5 Dec 2017).
Foreign Agricultural Service/USDA. (2017), Oilseeds: World Markets and Trade, available at: https://apps.fas.usda.gov/psdonline/circulars/oilseeds.pdf (accessed 6 December 2017).
Fozza, S. and Recagno, V. (2012), “Sustainable technologies and innovation for green corridors: Survey and application”, Procedia - Social and Behavioral Sciences, Vol. 48, pp. 1753–1763.
Hanaoka, S. et al. (2011), “Measurement of energy-saving effect by intermodal freight transport in Thailand”, World Review of Intermodal Transportation Research, Vol. 3, No. 4, pp. 320–337.
Hanaoka, S. and Regmi, M. B. (2011), “Promoting intermodal freight transport through the development of dry ports in Asia: An environmental perspective”, IATSS Research, Vol. 35, No. 1, pp. 16–23.
Instituto Brasileiro de Geografia e Estatística - IBGE (2017), “Produção Agrícola Municipal 2016”, Sistema IBGE de Recuperação Automática - SIDRA, available at: https://sidra.ibge.gov.br/.
Laboratory for Maritime Transport (2008), Ship Emissions Study, Athens, Greece, available at: http://nee.gr/downloads/66ship.emissions.study.pdf (accessed 6 December 2018).
Leiras, A. and Hamacher, S. (2008), “An Integrated Supply Chain Perspective Evaluation for Biodiesel Production in Brazil”, Brazilian Journal of Operations & Production Management, Vol. 5, No. 2, pp. 29–47.
Mamede, B. M. et al. (2017), “Multimodal Logistic Platforms Structure Analysis Worldwide : A Comparative Study Between Brazilian And Foreign Projects”, Brazilian Journal of Operations & Production Management, Vol. 14, pp. 288–295.
Ministério da Agricultura, Pecuária e Abastecimento - MAPA (2017), “AGROSTAT - Estatisticas de Comércio Exterior do Agronegócio Brasileiro”, available at: http://indicadores.agricultura.gov.br/.
Ministério do Desenvolvimento, Indústria e Comércio Exterior - MDIC (2019), “Estatísticas de Comércio Exterior”, available at: http://comexstat.mdic.gov.br/pt/home (accessed 11 February 2019).
Mendes, A. T. et al. (2013), “Um estudo empírico sobre as perspectivas de ampliação das relações comerciais entre Brasil e China”, Revista Eletrônica em Gestão, Educação e Tecnologia Ambiental, Vol. 16, No. 16, pp. 3134–3148.
Mortatti, C. M. et al. (2011), Determinantes do Comércio Brasil-China de Commodities e Produtos Industriais: uma Aplicação VECM, Economia Aplicada, Vol. 15, No. 2, pp. 311-335, available at: http://www.scielo.br/pdf/ecoa/v15n2/v15n2a07.pdf (accessed 20 June 2019).
Myers, M. and Wise, C. (Eds.) (2017), The Political Economy of China-Latin America Relations in the New Millennium: Brave New World, Routledge, New York.
Panagakos, G. et al. (2016), Green Corridors in Freight Logistics, Technical University of Denmark (DTU), available at: http://orbit.dtu.dk/files/127567830/GEOPAN_THESIS_05_12_16_COMPLETE.pdf (accessed 5 Dec 2017).
Péra, T. G. et al. (2020), “Transporting Soybean from Brazil to China through Green Corridors”, in Leiras A. et al. (Eds.), Operations Management for Social Good, 2018 POMS International Conference in Rio, Springer Proceedings in Business and Economics Series, Springer International Publishing. In press.
Psaraftis, H. N. and Panagakos, G. (2012), “Green corridors in European surface freight logistics and the SuperGreen project”, Procedia - Social and Behavioral Sciences, Vol. 48, pp. 1723–1732.
Regmi, M. B. and Hanaoka, S. (2012), “Assessment of intermodal transport corridors: Cases from North-East and Central Asia”, Research in Transportation Business & Management, Vol. 5, pp. 27–37.
Salin, D. L. (2017a), “Soybean transportation guide: Brazil 2016”, U.S. Department of Agriculture, Agricultural Marketing Service.
Salin, D. L. (2017b), “Brazil soybean transportation infrastructure update”, U.S. Department of Agriculture, Agricultural Marketing Service.
Secretaria Nacional de Portos (2019), “WebPortos - Cargas Movimentadas”, Ministério Da Infraestrutura, available at: https://webportos.labtrans.ufsc.br/InstalacaoPortuaria/Cargas/29 (accessed 19 June 2019).
Soybean & Corn Advisor (2014), “Amazon River Route Inaugurated for Brazilian Soybean Exports”, Soybean and Corn Advisor, Inc., available at: http://www.soybeansandcorn.com/news/May1_14-Amazon-River-Route-Inagurated-for-Brazilian-Soybean-Exports.
SuperGreen (2013), Supporting EU’s Freight Transport Logistics Action Plan on Green Corridors Issues. Green Corridors Handbook. Volume I., available at: https://setis.ec.europa.eu/energy-research/sites/default/files/project/docs/Handbook-I.pdf (accessed 5 December 2017).
Tetraplan and Helena Kyster-Hansen (2011), EWTC II Green Corridor Manual – Draft Definition, available at: http://www.ewtc2.eu/media/139579/ewtc_ii_green_corridor_definition_march_2011.pdf (accessed 5 December 2017).
Thorstensen, V. (2011), “Brasil e China - De conflitos de interesses à busca de uma agenda comum”, Seminário - Brasil e China No Reordenamento Das Relações Internacionais - Oportunidades e Desafios, Brasília, p. 62.
Wu, B. (Ed.) (2013), 转型中的机遇:中拉合作前景的多视角分析 [Opportunities in Transformation: A Multi-Perspective Analysis of China-Latin American Relations], Jingji Guanli Publishing, Beijing.
Received: 01 Mar 2019
Approved: 19 Jul 2019
DOI: 10.14488/BJOPM.2019.v16.n3.a4
How to cite: Péra, T. G.; Bartholomeu, D. B.; Su, C. T.; Caixeta Filho, J. V. (2019), “Evaluation of green transport corridors of Brazilian soybean exports to China”, Brazilian Journal of Operations & Production Management, Vol. 16, No. 3, pp. 398-412, available from: https://bjopm.emnuvens.com.br/bjopm/article/view/807 (access year month day).