Federal University of Minas Gerais – UFMG, Belo Horizonte, Minas Gerais, Brazil.
Federal University of Minas Gerais – UFMG, Belo Horizonte, Minas Gerais, Brazil.
Federal University of Minas Gerais – UFMG, Belo Horizonte, Minas Gerais, Brazil.
Federal University of Minas Gerais – UFMG, Belo Horizonte, Minas Gerais, Brazil.
cardoso@nescon.medicina.ufmg.br
Federal University of Minas Gerais – UFMG, Belo Horizonte, Minas Gerais, Brazil.
Goal: This study aims at solving a location problem of Medical Specialties Centers (MSCs) and medical care equipment allocation. Addressing both problems simultaneously is an opportunity to improve public health service quality in the long-term since the literature traditionally treats these problems separately.
Design / Methodology / Approach: The challenge consists in maximizing demand satisfaction with the minimum resource allocation in the public health care reality, where there is limited resource availability and high demand for medical services. For that, it was developed an integrated mathematical model, throughout mixed linear programming. The problem is a case study applied to the secondary public health care level in a Brazilian state. The method is generic and suitable to set the location and allocate resources in health care if the decision maker’s intention is to maximize the use of specialists’ assistance and medical exams.
Results: The results reveal possible improvements in accessibility. Among the insights, the state government should hire 4% more specialists and acquire 1.5% more equipment to assist 99% of population demand for health care service on the secondary level.
Limitation of the investigation: Usually, one appointment can result in more than one medical exam referral. However, this study considers that each specialist meeting refers to only one exam per consultation.
Practical implications: This study contributes to healthcare planning, suggesting a better distribution and allocation of facilities, equipment, and professionals. Moreover, the study proposes accessibility improvements to health unit centers.
Originality / Value: The main contribution of this work is the new integrated approach to public health care planning. The system proposes the reduction of access inequality and the improvement of the quality of health care services.
Keywords: Public Health Care Planning; Facility Location; Equipment Allocation; Mixed Integer Linear Programming
Communities around the world face the problem of improving user’s accessibility to qualified and well-equipped public health care units (World Health Organization, 2013). Social inequality, cultural, economic, and geographic heterogeneity intensifies the problem of accessibility mainly in more vulnerable and less developed regions. The regionalization process of a healthcare planning system is a complex issue.
In health services, epidemiological studies contribute to knowledge on the trend of the disease regarding the type, local and periods of appearance, characteristics of the most affected groups, and identification of important factors to improve the quality of health services and help decision makers on planning strategies to manage the health care system (Oleske, 2009; Rezaeian, 2004).
In Brazil, the Epidemiology and Health Services Journal (Jornal de Epidemiologia e Serviços de Saúde) aims at distributing information to managers and users to improve health system on local, state and federal level (Garcia and Duarte, 2015). The journal remarks upon the growth in works approaching the public health that results in advances based on scientific actions. Studies show, for example, the relation between social and health inequality that contributes to guiding interventions and actions on public policies (Silva et. al, 2018).
The Brazilian public health system (Sistema Único de Saúde - SUS) was implemented in 1988 and it is funded by social contributions and taxes. The main SUS goal is to guarantee the equity of access to health care units for all residents. The SUS is organized in three hierarchical levels: primary, secondary and tertiary care. The primary care occurs in basic health units. For a complex health problem, patients must go to specialty centers or hospitals. However, in most circumstances, patients must travel long distances to major cities or the capital to access specialized health centers mostly concentrated in developed regions (Paim et al., 2011).
From the Brazilian health service, it is identified the need of attention for secondary health care level, since the services are restricted and concentrated on developed centers (Paim et al., 2011), and professionals are more interested in work at private medical practice (Folha de São Paulo, 2018). There is a challenge to attract skillful specialists to reside and work in less developed regions. Moreover, secondary care is highly dependent on the private sector due to the expensive cost of procedures that require equipment from medium to high technological complexity and more specialized human resources. Around 24.1% of CT scanners and only 13.4% of MRI scanners are public in Brazil (Paim et al., 2011). In Minas Gerais, the available SUS capacity can cover only 38% of demand. The service limitation can be evidenced by the uneven distribution of these specialized services, often concentrated in developed centers.
The need to improve the uneven allocation of services that affect less developed regions is a must (Paim et al., 2011). However, to provide specialized health care services mainly in place with a vulnerable condition, the network accessibility needs to be intensified, considering the limited resource availability and lack of human resources interested in living and working in underdeveloped municipalities.
Therefore, in this study, analytical tools based on mathematical programming models are used to assist health care operation management (Sathler et al., 2020). The settlement of facilities is a strategic decision for private and public organizations and it is hardly modified due to the high investments, and the political and social impacts.
Consequently, it is necessary to examine numerous variables simultaneously. The increase in health care coverage, for instance, can occur with the greater number of physicians or more equipment; the improvement in geographical access with additional installations also requires more financial resources. Thus, solutions that combine these decisions are relevant to balance priorities and to perform distinct scenarios.
The facility location problem aims at finding the best places to set facilities in a given space, satisfying user demand and technical constraints. The literature presents a comprehensive review approaching exact and heuristic methods to solve this problem (Geoffrion and Powers, 1995; Owen and Daskin, 1998; Daskin and Dean, 2004). Seminal papers present the problem by varying objectives and applicability (Toregas et al., 1971; Hakimi, 1964). In the public sector, decisions on new health care location and capacity require special attention, as it must be reasonably distributed among users, respecting equality notions. In recent studies of location problems, equity has been a frequent topic and has received increased attention in the public sector. In these works, the main challenge is to define the best way to measure and apply equity (Barbati and Piccolo, 2016). In this study, the social vulnerability index is used to measure equity and it considers the limited resources available and location infrastructure conditions.
Studies have identified the need to combine more than one critical decision on health care facility location problems (Ahmadi-Javid et al., 2017). In this way, facility location and equipment allocation decisions can have better results if they are handled simultaneously, since there are different capabilities and abilities similar to reality. Aligned with this trend, this research proposes an integrated model evaluating two decisions: the location of Medical Specialty Centers (MSCs) and the allocation of equipment simultaneously. The goal is to maximize demand coverage for medical specialties and exams in a Brazilian state to avoid wasting resources and public funds, optimizing the allocation of resources according to real availability and needs, also looking for the most vulnerable communities.
To validate the proposed model, this research selected the secondary care in line with the Secretary of State for Health in Minas Gerais, Brazil. The objective is to provide accessibility and social equity given the distinct population characteristics (Sathler et al., 2020). A better distribution of equipment and medical services can reduce the public healthcare dependence from the private sector, mainly on diagnostic and hospital care services, one of the problems that compromise SUS healthcare financing (Paim et al., 2011). Moreover, access to medical care is closely related to the good distribution of medical services. Patients with low social and financial condition can only be attended if they are close to medical unit centers or with support of the government, responsible for their displacement.
Therefore, this study also aims to investigate interdependence, linking medical specialties and exam demand. This link is established as a medical examination can only be performed if a patient was first attended by a specialist, which is also known as medical exam referral. The location of a new MSC is chosen based on municipalities with basic infrastructure to maintain the center running, and not only where major demand can be met. Finally, additional equipment installation is allocated only where an MSC is set.
In the following section, the relevant literature is reviewed, highlighting the main contributions of related works. In section 3, the problem and the data adopted for the case study are described. Next, section 4 presents the results and a discussion across scenarios. Finally, section 5 provides conclusions and suggestions for future works.
The facility location problem is a logistical concept and a strategic decision that can settle organizations competitiveness in the long-term, impacting economic and social indicators (Bowersox et al., 2002). From a historical perspective, this article aims to direct interested readers for a comprehensive review (Hale and Moberg, 2003).
In literature, location problems applicability in health care has been widely studied. There are many ways to categorize localization problems: continuous models (the optimal location can be anywhere in the feasible region) or discrete (the optimal location is restricted to candidates’ places) (Ahmadi-Javid et al., 2017). This study approaches discrete models that can be classified according to the objective: the p-median problem (Hakimi, 1964) determines the best places to locate new facilities in order to minimize the total demand weighted transportation cost. The set-covering problem (Toregas et al., 1971) aims at minimizing the number of facilities to be open, assuring total demand coverage, while the max-covering problem objective is to maximize the demand coverage with a pre-determined number of facilities (Church and ReVelle, 1974).
The traditional location-allocation problem aims to define the location of facilities and allocate resources according to demand. However, all these basic models are not sufficient to represent the reality of facility locations, given the multiple aspects and applicability. Therefore, new models from the basic ones are developed to supply and to contribute with the reality of facility location problems (Melo et al., 2009). The need to consider multiple decisions together has been considered since 1979 in a study addressing the location of fire brigades and equipment simultaneously (Schilling et al., 1979).
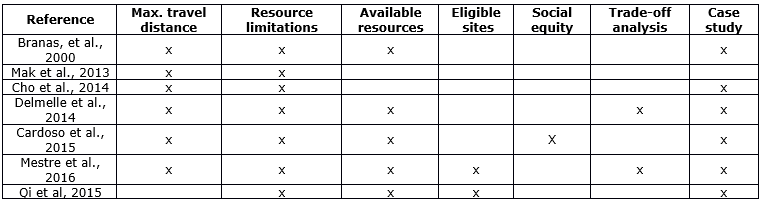
The facility location-allocation problems are NP-hard. The integrated modeling approach has been employed mainly to supply chain problems regarding not only the location but also the allocation of inventory (Shen, 2007), or vehicle routes (Chan et al., 2001). Applications in emerging areas, such as energy, transportation, and health care are even more recent (Mak et al., 2013, Cho et al., 2014, Qi et al., 2015). Table 1 features works related and a comparison between all the elements taken into account by the present study, such as, maximum patient travel distance/time, resources limitation, candidates’ municipalities to install new facilities, social equity, trade-off analysis, and real study application.
In health care, location problems can be applied to the location of primary care centers, blood banks, organ transplant centers, mobile health care units, or models on emergency logistics (Caunhye et al., 2012) (Ahmadi-Javid et al., 2017). On a review about health care facilities (Ahmadi-Javid et al., 2017), a location problem is presented. These works have contributed to the logistics network in health care, addressing patients who flow along the health chain. Some examples of practical contributions are: waste reduction by tracking blood flows or transplanted organs, helping to minimize travel time. In patient flows, operational research can help reduce waiting times or misuse of medical resources (Ageron et al., 2018).
In Cardoso et al. (2015), accessibility and socio-economic and geographical equity are presented in the healthcare system planning. However, unlike this paper, it does not approach vulnerable regions and does not consider municipalities to be eligible when choosing the ideal location. The optimal location is not the only one that has the best access, but also the place with the requirement to run a business. Often costly infrastructure is built in places without access to resources, such as professionals or minimum infrastructure to maintain the business running.
This paper contributes to the literature as it proposes a new model that maximizes demand coverage, and at the same time imposes conditional factors that bring the problem to reality, such as the selection of candidates’ places and equity through the measure of vulnerable regions.
Table 1. Papers approaching integrated facility location-allocation problems
In mathematical programming models, equity is the result of actions between different groups based on their characteristics (Ares et al., 2016). Equity is an abstract political-social concept that refers to justice and classifies resource allocation into parity, proportionality, and priority. By a parity concept, the system should treat residents equally. The proportionality notion approaches the resource division according to the needs of each patient. Finally, the priority idea consists of organizing the user’s assistance according to the worse health situation (Young, 1995).
In this paper, equity was conceived as minimal access (or level of demand attendance, Cardoso et al., 2015) to the most vulnerable municipalities, according to municipality classification by the Social Vulnerability Index (SVI), an indicator of the Institute of Applied Economic Research. The index varies from 0 to 1 and rates municipalities vulnerability based on urban infrastructure, human capital, income, and employment. The closer to 1, the more vulnerable is the municipality. The SVI was adopted to investigate real contexts, such as urban mobility, and health access (Ipea, 2015).
The problem consists in locating new MSCs to meet population demand for specialized medical care and exams. Each MSC will attend basic medical specialties to meet major demand according to demographic synopsis, epidemiological profile, aging, and economic growth (Sathler et Al., 2020).
The medical specialties are the following: cardiology, pediatrics, mastology, gynecology, endocrinology, ophthalmology, nephrology, urology, and angiology. The equipment used by these medical specialties considered in this study are CT scanners, mammography, RMI scanners, and Doppler; and the conventional ultrasound should be allocated to meet the demand for exams.
The database collection was made considering some input factors: the demand related to secondary care and SUS patients (Pinto et al., 2017) for medical specialties and exams on the municipality. This demand was calculated considering the number of inhabitants and the Ministry of Health ordinance 1631, of October 1, 2015, (Ministério da Saúde do Brasil, 2015), which estimates the ideal number of physicians and exams for each specialty and piece of equipment. Based on the last Brazilian Institute for Geography and Statistics census, in 2010, the population of the municipalities was estimated considering the year of 2015.
The distance between municipalities was collected on Google™ distance matrix application programming interface (Google API, 2018). DATASUS (2017), which is a public database, provides the number of physicians and pieces of equipment for each municipality. The number of physicians is used to calculate the capacity of each health region by specialty. The amount of devices per municipality sets the capacity to perform exams. The demand and capacity values were adjusted as the model should approach a priori only the uncovered demand and idle capacity.
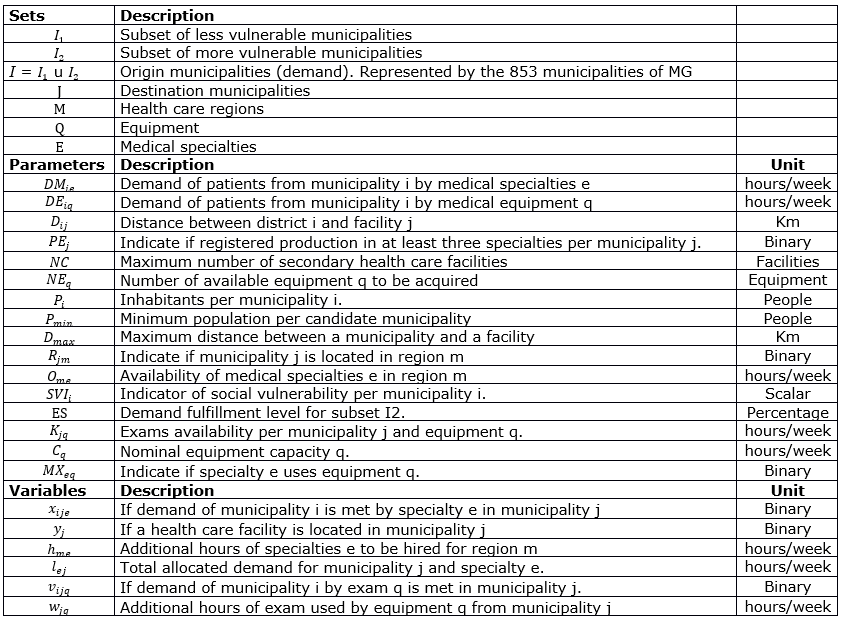
In this section, the mathematical formulation is presented, and in Table 2, the notation used for sets, parameters, and variables of the problem.
Table 2. Data and variables of the health care facility location-allocation model.
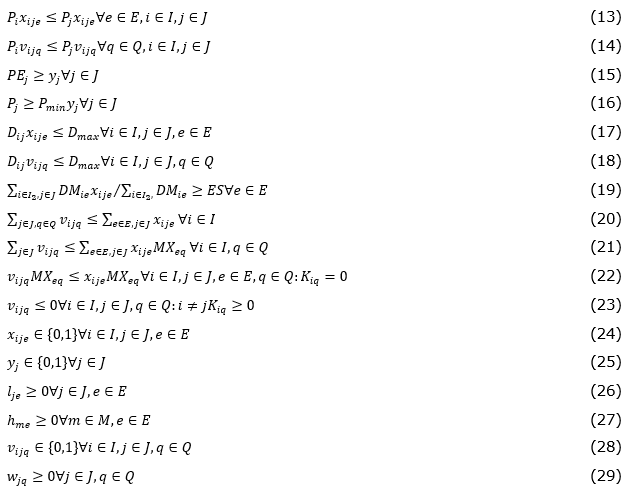
Equation (1) aims to maximize the demand attendance for specialists and medical exams and avoids the need for extra specialists and new equipment, expressed in hours per week. Medical examination demand is only met if the patient is first attended in a related specialist, equations from (20) to (23). In this way, although the demand and extra hours have less weight in terms of data representation, the specialist demand attendance is prioritized in detriment to extra hours of exams or equipment.

The available capacity of equipment and physicians limit the total demand attendance, constraints (10) to (12), and the State budget restricts the amount of equipment and MSCs available for acquisition, equations (7), (8) and (9). Equations (2) to (6) allocate the demand for medical services of each municipality for an open MSC.

The population movement was also examined. Historical data reveals that patients travel from small towns to major populated cities, which is represented by constraints (13) and (14). The model also imposes a maximal travel distance, equations (17) and (18). Additionally, candidates’ places that have a basic infrastructure are selected to guarantee an MSC running. This selection is based on specialty patient past attendance and city population size, respectively equations (15) and (16). In equation (19), the most vulnerable municipalities should have a demand level satisfied. Constraints (24) to (29) present the domain of the variables.
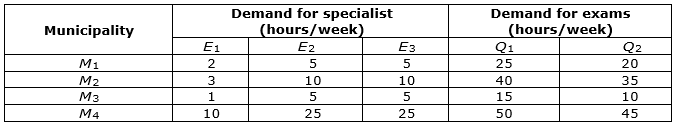
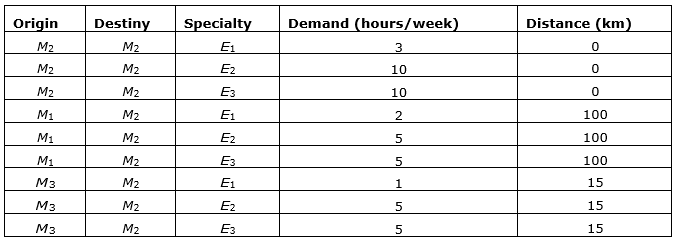
This section presents a numerical example with fictional data to didactically demonstrate the integrated model applicability. The example illustrated in Figure 1 is composed of four municipalities (circles), connected by edges, which mean the distance (km) between the city and the health region. Table 3 describes the elements. In this example, there is one vulnerable municipality (M1), and the condition to be a candidate city to receive an MSC is to have at least a hundred inhabitants and three medical specialties. Table 4 shows the demand for specialists and medical examinations on equipment in each municipality.
Table 3. Numerical Example Elements
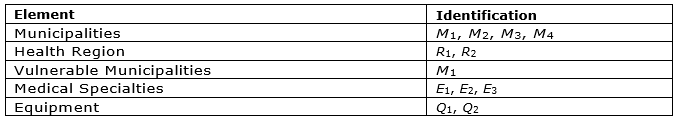
Figure 1. Numerical Example Illustration
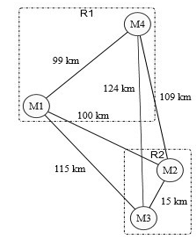
Table 4. Demand for specialists and examination per municipality
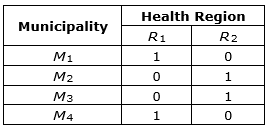
Each municipality belongs to a health region (see Table 5) which provides the number of specialists in hours per week (h/w) (Table 6). Table 7 presents the equipment capacity in each municipality. In the case of the available resources that do not satisfy the demand, more physician hours can be hired and medical examination hours acquired. However, it can only allocate equipment to municipalities with an MSC. The maximum number of MSC is equal to one, and the quantity of extra equipment is limited to one for Q1 and two for Q2.
Table 5. Municipality per Health region
In this example, a patient may move up to 100 kilometers to municipalities with more numerous inhabitants, (see Table 8). Table 9 presents the matrix linking the equipment used by each specialty. All specialties use both types of equipment.
Table 6. Specialists Availability

Table 7. Exam Availability
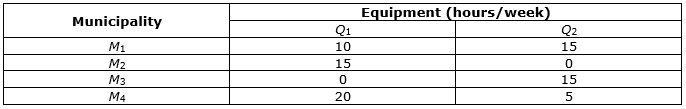
Table 8. Municipality Population

Table 9. Equipment used by each medical specialty

The model aims at satisfying the demand for specialists’ care and exams, avoiding the use of extra resources. Table 10 shows the results of the problem solved by the integrated method.
Table 10. Results of the Objective Function

The model sets one MSC on municipality M2, satisfying the demand of cities M1, M2, and M3 in every specialty. As a result, 46 hours are met per week, whereas the necessary is 26 extra hours: one hour for E1, 10 hours for E2, and 15 hours for E3. The settlement of M3 verifies the viability of attending M3 equipment demand (Q1 and Q2) as it has free capacity. As an outcome, it serves a total of 25 medical examination hours, with no requirement of extra hours. For the medical examinations that use equipment Q1, M3 is attended in M2, and for the exams that use Q2, the demand is satisfied in the same municipality M3. Tables 11 and 12 represent the municipality of origin, destination, and the total demand attended.
Table 11. Attendance of demand for exams

Table 12. Attendance of demand for medical specialty
The research method is a case study applied in Minas Gerais (MG), located in the southeast of Brazil. The State is the second most populous in Brazil, with 21,119,536 inhabitants estimated in 2017 (IBGE, 2010). MG is composed of 853 municipalities, 1,633 districts, and 77 health regions (DATASUS, 2017). It has the highest number of municipalities and is the fourth State in territorial extension. 86% (734) of the municipalities of MG have up to 30,000 citizens, 26.1% (223) have up to 5,000 inhabitants, and only 3.1% (27) have more than 100,000 inhabitants.
One major problem in MG are the disparities on socioeconomic and demographic density among regions. The Central, Southern, and Zona da Mata regions concentrate the most developed and crowded municipalities, and consequently, there is better access to health care services. Whereas the North, Northwest, Jequitinhonha/Mucuri, and Rio Doce regions have low inhabitant density and a large territorial extension. However, regarding socioeconomics, the Jequitinhonha/Mucuri and Rio Doce are the most vulnerable regions reflecting the community challenges on health care management and operations planning.
The secondary care requires equipment of high technological complexity, mostly located in developed regions. Consequently, the uneven distribution and limited capacity to serve all the population demand results in the high dependence on the private sector, as the government funds the complementary demand for medical examinations for private health units at market price (Paim et al., 2011).
The proposed solution to these problems is to set the optimal location of MSCs and to allocate equipment regarding the actual health care network. The results indicate the minimum number of health care units necessary to cover the maximum specialists and medical examinations demand, as well as the need for extra equipment and professionals.
This section presents the results achieved by numerical experiments using the integrated model. Next, the studied problem is solved and the optimal number and MSC location and equipment is set. Finally, the analysis of the trade-off concerning location and allocation decisions is carried out.
Numerical experiments were conducted performing different scenarios and analyzing the model results. The instances are modified in terms of the number of specialized centers (NC) and equipment (NEq), maximum coverage radius, and on the SVI value, as exhibited in Table 13. The available data on medical care and equipment capacity refers to the public health care database.
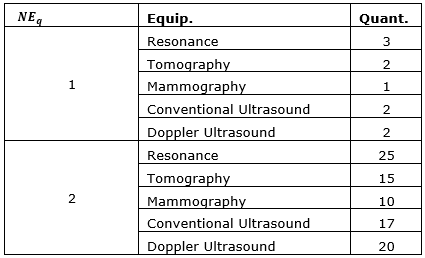
Instance generation adopted values based on the actual State database. The initial budget of the State predicts the installation of 51 centers. Therefore, we set values below (15), nearby (45) and the above (60) of the initial budget. Table 14 shows the number of equipment available for acquisition, assuming scarcity and surplus scenarios. The maximum cover distance configuration considers the government’s initial estimative of 80 km, an intermediate value of 150 km, and a high value of 300 km. The SVI values range from higher than 0.301 (for municipalities with medium/high vulnerability), to higher than 0.501 (cities with high vulnerability).
The instances resulted in 36 tests presented in Table 15. Experiments 1, 4, 7, 10, 13, 16, 19, 22, 25, 28, 31, and 34 did not get a feasible solution when considering 80 km for the maximum travel distance according to the Government maximum patient displacement goal (Diretório Estadual de Minas Gerais do Partido dos Trabalhadores, 2014). In these scenarios, due to the large MG territorial extension and the State demographic characteristic, it is necessary to increase the number of candidate's places to achieve a feasible solution. The results show that the number of facilities and the maximum travel distance are important variables on the problem analysis, as verified in the literature (Cho et al., 2014).
Table 13. Design of experiments
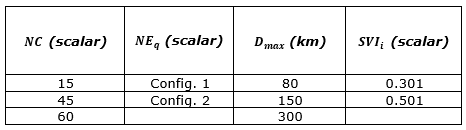
Table 14. Identification of NEq configuration
As the number of available health care centers increases, the differences obtained from different scenarios decrease. When the maximum distance coverage changes, the impact on the objective function is significant. Moreover, from a defined value, increasing the number of MSC may not bring meaningful demand coverage. The same occurs by varying the number of new equipment. By increasing this number, as seen on tests 14 to 20, there is an increment of only 0.09% on medical examination demand coverage. These remarks indicate that installing new centers or procuring new equipment does not necessarily mean an increase in demand fulfillment. It is critical, in this circumstance, to review the State standard parameters for quality on health care, such as the number of exams per 1.000 citizens or the demand coverage distance.
When analyzing the SVI value variation from 0.301 to 0.501 in the same scenario, results reveal a reduction in the demand coverage for medical specialty and the municipalities selected to receive a center which occurs due to the smaller number of municipalities within the group of the most vulnerable for SVI equal to 0.501 (see Figure 2 with the location of each group).
Finally, the results are analyzed in terms of total demand attendance, physicians hiring, and additional hours of medical examinations, as presented in Figures 3a and 3b. The medical care demand is accompanied by the fulfillment of medical exams, as shown in Figure 3b. It means that medical care attendance directly affects the exam coverage due to the interdependency established between decisions.
The average medical and exam care attendance are respectively 92% and 30%. The worse result obtained for medical exam coverage is explained by the uneven supply and demand relation on the State, mainly for the conventional ultrasound and mammography. The equipment requires, respectively, 94% and 62% additional hours to meet all State demands. Figure 3b presents the specialists’ extra hours and exams. On average, it is necessary to hire 3% beyond that available for specialty and 1% for exams.
The number of MSCs and the maximum patient distance travel are the factors that most affect the demand coverage. However, increasing the number of MSC after a particular amount may not bring significant gains in total demand coverage. In terms of maximum distance, the increase in coverage implies the loss of service level in terms of patient displacement (Delmelle et al., 2014). These observations show the parameters variation impacts on the problem and the interdependence between the demand and locations chosen for medical care and equipment, emphasizing the importance of treating the problem simultaneously (Delmelle et al., 2014).
Figure 2. Municipalities with SVI higher than 0.301 in gray and higher than 0.501 in red
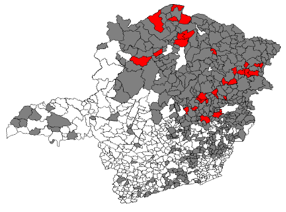
Source: IPEA, 20150
Therefore, the results contribute to show the importance of public health policies on logistics concepts. Firstly, criticizing the government parameters established to define the quality of health access, confirming that it will vary according to each territorial, demographic, and socioeconomic characteristic of the State when treating more than one factor simultaneously. Moreover, the occurrence of uneven resource distribution was reinforced in the State municipalities, mainly when considering real needs for different types of equipment. This indicates a science-based deficiency when making important decisions that involve a great amount of investment in the public sector, such as the acquisition of equipment or hiring professionals.
Some studies propose the determination of the optimal number of MSC that minimizes the need for extra hours of specialists and equipment, meeting the maximal demand. To this end, an extreme scenario was conducted, considering the maximum number of municipalities of the candidates, which is equal to 116 MSC (NC); for each type of equipment, a high number is available for acquisition (NEq); a coverage range of 200 km is agreed by medical and engineering experts; and an SVI is equal to 0.301. Table 16 presents the objective function results. From there, there was 99.1% of the medical specialty demand attendance, but only 32.4% for medical exams. Eighty municipalities were selected to have a center installed, and it was necessary 19,630 extra hours of specialists. On the other hand, 183 municipalities were selected for medical exams demand attendance, acquiring 44,110 extra hours.
From the presently available resources, it is necessary to increase physicians hiring by 4.1%, while for new equipment it is required to acquire around 1.5% more hours. The low-level of exam demand coverage occurs due to the real availability of hours below the required to meet all the demand for conventional ultrasound and mammography. In counterpart, above that, it is necessary to cover all demand for Doppler ultrasound, CT scanners, and RMI scanners.
The demand coverage obtained for the most vulnerable group was 97.9%. This shows that, besides the large MG territorial extension, these communities can be widely reached. Therefore, this study helps decision makers to define strategic places to attend patients with higher social vulnerability associated with the costs to implement a health center also considering the cover radius of action. The contribution that affects mainly vulnerable communities is the reduction of expenses with health insurance and misuse of medical products.
Figure 3. Results obtained from the model for attendance (a) and quantity of additional hours (b)
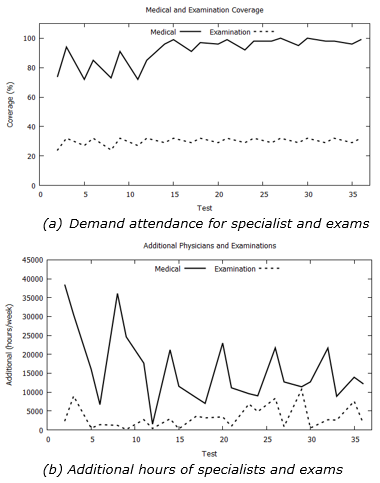
Figure 4a shows the municipalities selected to locate the health centers and attend the demand for medical care, and Figure 4b, for a medical exam. Figure 4b shows in grey the 182 municipalities that already had available capacity in at least one of the five pieces of equipment considered in this study, and highlighted, in red, Almenara, the unique city that had hours in none equipment.
Patients’ flow is represented on the map of Figure 5, illustrating three State regions: Almenara, located in the north-east, Belo Horizonte, the State capital in the central area, and Uberlândia, in the west. Noteworthy is the flow of patients by circles proportional to the demand met by each municipality. The smaller circles represent the origin of the patients and the bigger circles the city of destiny.
The results obtained for patient flow can help managers to plan the strategy for physical logistics, considering the large territorial extension of the State. For example, given the flow density obtained in each region, the road maintenance and conditions can be improved, reducing the travel time to arrive in a health center, besides helping in an emergency situation. Consequently, it can reduce costs with patient displacement for the government, the users, and physician’s that sometimes need to move from one city to another to make an appointment.
In MG, the most vulnerable and deficient health care regions are concentrated in the north and north-east of the state. Throughout the State cities, there is an unequal distribution of physicians. For example, from the 77 health regions, 55 require complementary hours to attend the established demand in at least one specialty, except ophthalmology. Figure 6 exposes the required additional hours of pediatrics for each region.
Table 15. Experiments results: OF: Objective Function, A: Hours of physician attendance, HAM: Additional hours of physician, E: Hours of exam attendance, HAE: Additional hours of exams
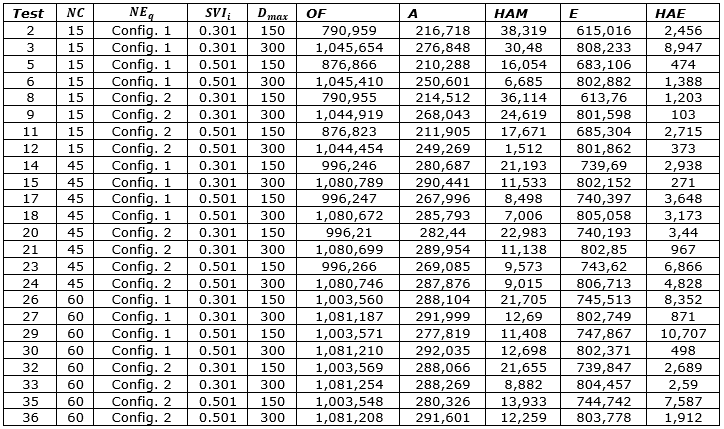
Table 16. Results of the objective function
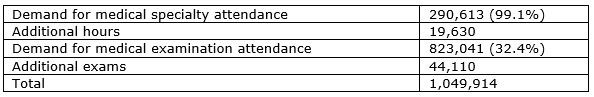
Figure 4. Selected municipalities to receive service
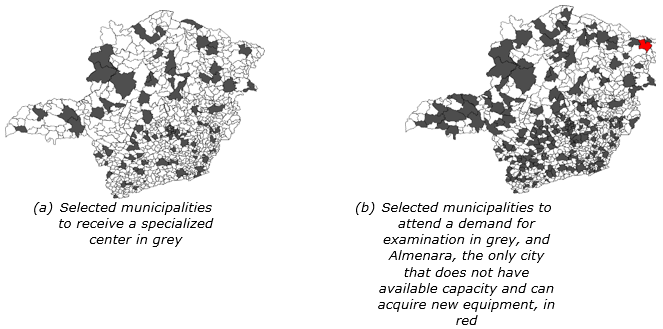
Figure 5. Patients flow for medical care in MG, highlighting the North-east, Central, and West regions of Minas Gerais
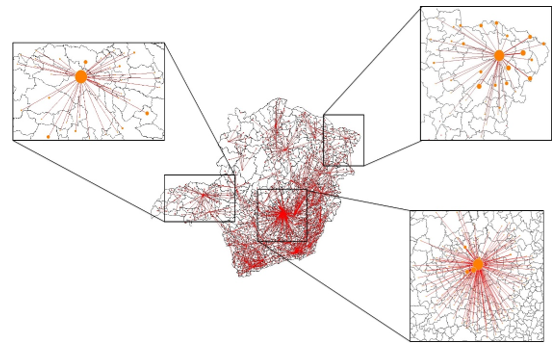
Figure 6. Extra hour needed to attend the demand for pediatrics per health region, the more intense the blue color the more physicians are needed
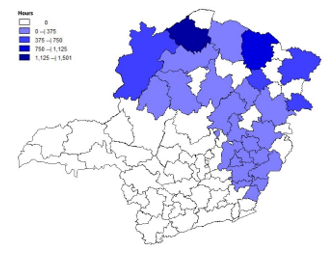
One solution for this uneven distribution would be the attractions of physicians to live and work on these poorest regions. In terms of equipment, the choice of whether to buy new equipment or acquire extra hours from the private market is a strategic and cost-benefit decision. The managers can evaluate the costs associated with the acquisition, maintenance, and operation of new equipment upon the cost of obtaining hours of exam from the market price. The new equipment acquisition is a long-term investment that satisfies future demands for the remaining years of the machine’s useful life. The feasibility analysis should also consider the equipment payback, evaluating its capacity.
As a result, another practical contribution is the decrease in private sector expenses. Given the high dependence on the private sector for more complex exams or specialized medical care, with an ideal unit center distribution and equipment reallocation, this expenditure can be reduced; besides, it can improve the quality of the services.
The contributions go beyond the logistics applied to the health chain and reaches gains with less patient expenditures in medical care products. Once there is medical attention, the misuse of the medical resource is reduced, as well as, medical products in general, due to the better patient orientation of a specialized professional.
This section analyses the integrated model when assigning different weights to the location of specialized health centers, denominated f_1, and to equipment allocation denominated f_2. As demonstrated in equation (30), the objective function was modified to evaluate the trade-off between the medical and examination specialty, and the number of MSC.
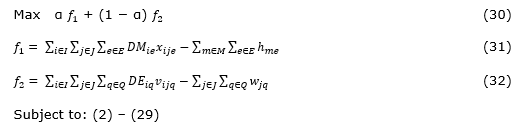
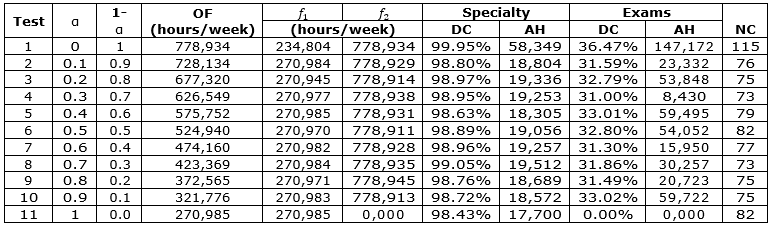
Alpha (α), an input parameter that varies from zero to one, represents the weight assigned to each part of the objective function. Alpha equals zero maximizes only the demand coverage for examinations using minimum additional exam hours, while α set to one maximizes the attendance for medical specialty care, rationalizing the extra hours of specialists. Considering the same scenario, but with different α values, experiments were performed. Follow the input parameters: 116 specialized centers available for installation (representing the total number of candidate municipalities), a high amount of equipment obtainable for purchase, 0.301 for SVI value, and 200 km for D_max. From test 1 (α is equal to zero) to test 11 (α is equal to one), Table 17 provides the detailed results obtained: f1 and f2, the attendance and additional hours of specialists and examinations, and the optimal amount of new specialized centers to be installed.
The results of the objective function for each α show that the exam attendance is prioritized in detriment to the medical specialty. This means that the decrease of α favors the total objective function value, as well as the individual values of coverage. A medical examination demand is only satisfied if, a priori, a related medical specialty demand was also met, thus prioritizing medical care exam coverage automatically in more medical specialty attendance. The higher total coverage demand also requires further extra hours of physicians, exams, and unit centers to be installed. This result reinforces the trade-off between service quality and resource needs. For a level of quality of service that offers better patient coverage, more expenses must be incurred to install, maintain, and operate a new health center equipped and specialized in human resources.
Alpha equals to zero also requires more MSC to be installed, which occurs due to the superior total demand coverage. The number of MSC varied between 73 and 82 for intermediate alpha values. In some cases, such as α equal from 0.1 to 0.4, the need for new centers is higher even with lower medical specialty satisfaction but better coverage on medical examinations. This result emphasizes the relationship interdependence between decisions.
The results analysis adopting weights to different decisions show that prioritizing the attendance of exams can lead to better results regarding patient coverage. However, it is necessary to increase the number of medical professionals and availability of medical examinations, as well as the number of MSC to be installed. This analysis provides different options for decision making in a real application according to the decision maker objective.
Table 17. Results of the trade-off analysis: OF: Objective Function, DC: Demand Coverage, AH: Additional Hours, NC: Number of Centers
This paper proposed an integrated model that simultaneously locates health unit centers and allocates equipment to maximize the coverage demand for specialists and medical examination. The challenge imposed by the study was to link the two decisions, while avoiding the need for extra hours of physicians and equipment, considering the available capacity.
The first decision was to set the MSC location to maximize the satisfaction for medical specialty demand and the use of available specialists. The second decision aimed at allocating new equipment to maximize the medical exams demand, avoiding the acquisition of extra hours. Locations that received a new center were able to acquire new equipment. The model analyzed the equity concept through the minimum level of demand fulfillment to the most vulnerable areas and considered candidates’ sites to guarantee minimal infrastructure to run a health center and to attract specialists.
In general, the results obtained from the comparison of integrated and non-integrated approaches showed that the integrated model enables satisfying a higher demand level yielding lower idleness for the available resources. Due to the decision’s interdependency, the combined problem can better select municipality to install an MSC, examining together the equipment (resources) and physician’s availability. That is crucial, considering a real context of limited investment, such as in the public sector.
The results obtained from the real data context suggested that the gain in demand coverage is limited to a set number of MSC or equipment, due to other factors that affect the problem results. For example, the current geographical distribution of resources and physicians indicates that a serious and well-based government analysis and management is essential when hiring specialists and acquiring new equipment.
The trade-off analysis considered different weights for each decision, this analysis showed that prioritizing the medical examination results in higher total attendance, due to the dependence on the demand for a medical specialty.
Some study limitations are worth mentioning. First, data collection can have some omissions or incorrect value as it is from the public health system database. Second, for each context, the variables can vary, such as the actual capacity of physicians or equipment, and the available budget to install centers. Third, future works can investigate the relation of more than one exam to a specialty attendance. In this work, this relationship was simplified in one examination to one specialist attendance.
Finally, this work can contribute to similar health care studies in different context applications. The integrated location problem is a new way of solving challenges imposed by the health care system on logistics strategies. It helps decision-making, as it is more effective and efficient on the use of the public health system’s resources, increasing patient’s quality of access to health care services, and reducing waste with medical products and expenses with health insurance.
Ageron, B. et al. (2018), “Health care logistics and supply chain–issues and future challenges”, In Supply Chain Forum: An International Journal, Vol. 19, No. 1, pp. 1-3.
Ahmadi-Javid, A. et al. (2017), “A survey of health care facility location”, Computers & Operations Research, Vol. 79, pp. 223–263.
Ares, J. N. et al. (2016), “A column generation approach for locating roadside clinics in Africa based on effectiveness and equity”, European Journal of Operational Research, Vol. 254, No. 1, pp. 1002-1016.
Barbati, M. and Piccolo, C. (2016), “Equality measures properties for location problems”, Optimization Letters, Vol. 10, No. 5, pp. 903-920.
Bowersox, D. J. et al. (2002), “Supply Chain Logistics Management”, McGraw-Hill, New York, NY.
Branas, C. C. et al. (2000), “A trauma resource allocation model for ambulances and hospitals”, Health Services Research, Vol. 35, No. 2, pp. 489-507.
Cardoso, T. et al. (2015), “An integrated approach for planning a long-term care network with uncertainty, strategic policy and equity considerations”, European Journal of Operational Research, Vol. 247, pp. 321–334.
Caunhye, A. M. et al. (2012), “Optimization models in emergency logistics: A literature review. Socio-economic Planning Sciences”, Vol. 46, No. 1, pp. 4-13.
Chan, Y. et al. (2001), “A Multiple-Depot, Multiple-Vehicle, Location-Routing Problem with Stochastically Processed Demands”, Computers & Operations Research, Vol. 28, pp. 803-826.
Cho, S. et al. (2014), “Simultaneous location of trauma centers and helicopters for emergency medical service planning”, Operations Research, Vol. 62, pp. 751–771.
Church, R. and Velle C. R. (1974), “The maximal covering location problem”, Papers in Regional Science, Vol. 32, No. 1, pp. 101–118.
Daskin, M. S. and Dean, L. K. (2004), Handbook of OR/MS in Health Care: A Handbook of Methods and Applications, Kluwer.
Delmelle, E. M. et al. (2014), “A multi-period capacitated school location problem with modular equipment and closest assignment considerations”, Journal of Geographical Systems, Vol. 3, pp. 263–286.
Departamento de Informática do SUS – DATASUS (2017), Cadastro Nacional de Estabelecimento de Saúde, available at: http://cnes.datasus.gov.br/ (Accessed 2017 Oct 10).
Diretório Estadual de Minas Gerais do Partido dos Trabalhadores (2014), “Saúde: Pimentel vai criar 77 Centros de Especialidades e carreira de médico da família”, disponível em: http://www.ptmg.org.br/saude-pimentel-vai-criar-77-centros-de-especialidades-e-carreira-de-medico-da-familia/#.XVoDG-hKiUk (Accessed 2017 July 16).
Folha de São Paulo (2018), “Apesar de problemas, SUS é referência em saúde pública, dizem especialistas”, available at: https://www1.folha.uol.com.br/seminariosfolha/2018/04/apesar-de-problemas-sus-e-referencia-em-saude-publica-dizem-especialistas.shtml (Accessed 2019 Jun 17).
Garcia, L. P. and Duarte, E. (2015), “Epidemiology and Health Services: the trajectory of the Brazilian National Health System Journal”, Ciência & Saúde Coletiva, Vol. 20, No. 7, pp. 2081-2090.
Geoffrion, A. M. and Powers, R. F. (1995), “Twenty years of strategic distribution system design: An evolutionary perspective”, Interfaces, Vol. 25, No. 5, pp. 105-127.
Google API (2018), Distance between municipalities, available at: http://maps.google.com (Accessed 2017 Oct 02).
Hakimi, S. L. (1964), “Optimum locations of switching centers and the absolute centers and medians of a graph”, Operations Research, Vol. 12, No. 3, pp. 450–459.
Hale, T. S. and Moberg, C. R. (2003), “Location science research: a review”, Annals of Operations Research, Vol. 123, No. 1, pp. 21–35.
Instituto Brasileiro de Geografia e Estatística - IBGE (2010), Censo Demográfico 2010, available at: https://www.ibge.gov.br (Accessed 2017 Oct 10).
Instituto de Pesquisa Social Aplicada – Ipea (2015), Atlas da Vulnerabilidade Social, available at: http://ivs.ipea.gov.br/index.php/pt/ (Accessed 2017 Feb 10).
Mak, H. et al. (2013), “Infrastructure Planning for Electric Vehicles with Battery Swapping”, Management Science, Vol. 59, pp. 1557–1575.
Melo, M. T. et al. (2009), “Facility location and supply chain management-A review”, European Journal of Operational Research, Vol. 196, No. 2, pp. 401-412.
Mestre, A. M. et al. (2016), “Location–allocation approaches for hospital network planning under uncertainty”, European Journal of Operational Research, Vol. 240, pp. 791–806.
Ministério da Saúde do Brasil (2015), “Portaria nº 1.631, de 1 de outubro de 2015, available at: http://bvsms.saude.gov.br/bvs/saudelegis/gm/2015/prt1631_01_10_2015.html (Accessed 2017 Oct 10).
Oleske, D. M. (2009), “An epidemiologic framework for the delivery of health care services”, In Oleske D.M. (eds). Epidemiology and the Delivery of Health Care Services, Springer, Boston, MA, pp. 3-28.
Owen, S. H. and Daskin, M. S. (1998), “Strategic facility location: A review”, European Journal of Operational Research, Vol. 111, pp. 423-447.
Paim, J. et al. (2011), “The Brazilian health system: history, advances, and challenges”, The Lancet, Vol. 377, No. 9779, pp. 1778–1797.
Pinto, L. R. et al. (2017), “Localização e Dimensionamento de Recursos para Centros de Especialidade Médica do Estado de Minas Gerais: Desenvolvimento de Ferramentas”.
Qi, W. et al. (2015), “Joint Planning of Energy Storage and Transmission for Wind Energy Generation”, Operations Research, Vol. 6, pp. 1280–1293.
Rezaeian, M. (2004), “Book Review: Epidemiology for the uninitiated”, Statistical Methods in Medical Research, Vol. 13, pp. 243-243. 10.1177/096228020401300309.
Sathler, T. M. et al. (2020), “An Integrated Model of HealthCare Facility Location and Equipment Allocation”, In Leiras A. et al. (Eds.), Operations Management for Social Good, 2018 POMS International Conference in Rio, Springer Proceedings in Business and Economics Series, Springer International Publishing. In press.
Schilling, D. et al. (1979), “The TEAM/FLEET models for simultaneous facility and equipment siting”, Transportation Science, Vol. 13, No. 2, pp. 163-175.
Shen, Z. (2007), “Integrated Supply Chain Design Models: a Survey and Future Research Directions”, Journal of Industrial and Management Optimization, Vol. 3, No. 1.
Silva, I. C. M. D. et al. (2018), “Mensuração de desigualdades sociais em saúde: conceitos e abordagens metodológicas no contexto brasileiro”, Epidemiologia e Serviços de Saúde, Vol. 27, No. 1, e000100017.
Toregas, C. et al. (1971), “The location of emergency service facilities”, Operations Research, Vol. 19, No. 6, pp. 1363-1373.
World Health Organization (2013), Research for universal health coverage: World health report 2013, World Health Organization, Geneva, Switzerland.
Young, H. P. (1995), “Equity: in theory and practice”, Princeton University Press, Princeton, New Jersey.
Received: 28 Feb 2019
Approved: 19 Jul 2019
DOI: 10.14488/BJOPM.2019.v16.n3.a13
How to cite: Sathler, T. M.; Almeida, J. F.; Conceição, S. V. et al. (2019), “Integration of Facility Location and Equipment Allocation in Health Care Management”, Brazilian Journal of Operations & Production Management, Vol. 16, No. 3, pp. 513-527, available from: https://bjopm.emnuvens.com.br/bjopm/article/view/799 (access year month day).