Total Quality Management: the case of an electricity distribution company
Ana Carla de Souza Gomes dos Santos
anacarla.engenharia@gmail.com
Federal Institute of Rio de Janeiro – IFRJ, Rio de Janeiro, Rio de Janeiro, Brazil
Leandro Machado Carvalho
eng.leandromcarvalho@gmail.com
Cândido Mendes University – UCAM, Rio de Janeiro, Rio de Janeiro, Brazil
Caio Ferreira de Souza
Caio_assis3@hotmail.com
Cândido Mendes University – UCAM, Rio de Janeiro, Rio de Janeiro, Brazil
Augusto da Cunha Reis
augusto@aaa.puc-rio.br
Federal Center for Technological Education Celso Suckow da Fonseca - CEFET/RJ, Rio de Janeiro, Rio de Janeiro, Brazil
Alberto Eduardo Besser Freitag
abesser@uol.com.br
Federal Center for Technological Education Celso Suckow da Fonseca - CEFET/RJ, Rio de Janeiro, Rio de Janeiro, Brazil
ABSTRACT
Goal: this research aims to deploy TQM in the new customers area of an electricity distribution company, located in Campos dos Goytacazes (Rio de Janeiro), based on three management pillars: guidelines, processes and routine.
Design / Methodology / Approach: the nature of this work is applied research, with a qualitative problem approach, characterized as exploratory, using case study as a technical procedure, with data collected between april and september of 2015.
Results: the performed methodology allowed a reduction of both "orders after deadline" (12%) and "unproductive visits" (22%) indicators.
Limitations of the investigation: the research presented limitations, first, because of the resistance of some employees during the tools implementation and second, the methodology was implemented only in a sector of the company.
Practical implications: the study was based on indicators and targets already used by the company. It was proposed and implemented an anomalies analysis and tools such asthe PDCA cycle, Pareto and Ishikawa diagrams, 5W1H, and Standard Operating Procedures.
Originality / Value: there is little research with emphasis on TQM, especially when referring to an analysis using three levels of management (guidelines, process and routine) in the Brazilian electricity sector.
Keywords: Production and operation systems management; Electrical energy; Quality tools.
1. INTRODUCTION
In the context of the Brazilian Electric System, the National Electric Energy Agency (ANEEL) is responsible for regulating and monitoring the agents responsible for the activities of generation, transmission, distribution and sale of electric energy (ANEEL, 2012). By means of regulation, ANEEL lays down conditions for which these services are provided to society with quality, safety and under fair rates. The supervision of electric energy services, held directly by ANEEL or State regulatory agencies, aims to verify the legal and contractual commitments fromcompanies of the electricity sector, in order to assure to society that services are provided with the agreed quality, cost, schedule and safety. ANEEL monitors the quality of electric energy supply with pre-set indexes, according to the characteristics of each concession area (ANEEL, 2012).
The perception that quality would be the best approach to achieve the desired results came from the middle of the 20th century, when the need for greater quality control in all processes and activities of the companies was noted. Therefore, Total Quality Management (TQM) has emerged as an approach to engage the company as a whole, in order to understand the activities in a systemic and individual way for application of new tools (Banuro et al., 2017).
The implementation of TQM aims to produce goods and services, integrating the vision of internal and external clients, by means of strategic planning (Androniceanu, 2017; Chao et al., 2015). However, the commitment and involvement of senior management are essential to unfold strategies at both tactical and operational level (Obeidat et al., 2016).
The management by guidelines is a tool that enables senior management to monitor the spread of strategic goals, having as evaluation parameter a set of indicators and targets that are deployed from top management to factory floor (Andrade et Roseira, 2017; Chiarini, 2016; Nicholas, 2016).
The use of indicators enables a measurable analysis of processes within the standards set by senior management through management by processes, which is a methodology that allows a continuous evaluation of the processes, aiming to maintain control items within the previously established standards (Aquilani et al., 2016).
One of the great barriers to achieve high quality is the so called anomaly, which is an event that escapes from the standard to be followed, where no value is added to the activity, leading only tocosts tothe company. To remove this barrier from the processes, a constant search for activities standardization is required, being the routine management methodology the best strategy for success, because it is an instrument that informs the goal and procedures, respectively end and means, for carrying out the activities, so that each employee has awareness of the responsibility for the results of his work (Bráz et al., 2016; Pereiraet Sales, 2015).
Thus, management by guidelines, management by processes and routine management are strategies that allow the TQM implementation. There is an integration between them, joining efforts of improvement and goals deployment mechanisms within the organization (Gupta et al., 2016; Manhas et al., 2015; Nicholas, 2016).
The Statistical Yearbook of Electric Energy presented a growth in Brazil of 3.2% in 2014 when compared to the previous year and 14.61% when compared to the year of 2010, ranking the seventh among the ten countries with the largest electric energy consumption (MME, 2017). These data show an expansion in the sector and the need for an efficient public service delivery and with quality to meet population needs. The implementation of TQM allows to identify possible causes that interfere with the services execution, provide potential solutions, streamline services requests, standardize activities execution and train employees to operate according to standards, ensuring consumer satisfaction and the continuous improvement of processes(Khanna, 2010; Oliveira et al., 2015).
Due to the reasons mentioned above, this study aims to deploy Total Quality Management (TQM) in the new customers’area of an electricity distribution company, located in the municipality of Campos dos Goytacazes, based on three pillars: management by guidelines, management by processes and routine management.
This paper is structured in four sections, the first presenting the introduction and purpose of the research. The second section discusses the methodological procedures performed in this work. Results are presented and discussed in the third section. The fourth section outlines the findings of the study, limitations and proposals for future work.
2. RESEARCH METHOD
The nature of this work is applied research, whose guidelines are the use and implementation of TQM, as well as the analysis of its consequences, generating theoretical and practical knowledge about the subject.
Asto the problem approach, this research is classified as qualitative, because it refers to the object, detailedthrough a deep and thorough study, allowing the understanding of the problem to be analyzed(Gil, 2002).With regard to objectives, the research is characterized as exploratory, as it allows providing greater familiarity with the problem, making it more explicit. The technical procedure used was the case study, which consists of a complete study of one or a few objects to obtain a broad knowledge about them (Silva et Menezes, 2005).
2.1 Object of the study
The electricity distribution company of the case study is located in the municipality of Campos dos Goytacazes, Rio de Janeiro State, playing a leading role in the development of renewable energy sources in the country. Considered the largest private company in the Brazilian electricity sector, has four distributors in the States of Ceará, Goiás, São Paulo and Rio de Janeiro and provides energy to 17 million customers, including residential, commercial, industrial, rural and public sector.
The new customers sector is the area intended for the implementation of TQM and management (guidelines, processes and routine), which aims to supply energy to new consumer units (CU). The provided services are electricity supply to new CU, increase and decrease of power at the CU, rewiring electric energy of the unit, and inspection and verification of the meter of active clients.
The sector has an electrical engineer, two analysts that are production engineers, a trainee attending the ninth period in production engineering, three administrative assistants, two internal company managers, six outsourced field managers and 20 electricians. The electricians and managers have a technical background in electrical engineering.
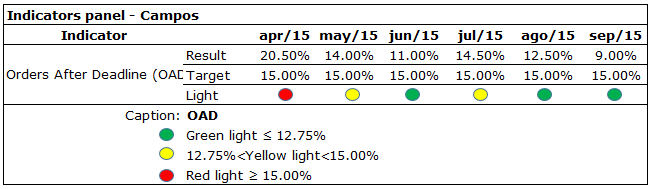
At the beginning of each year, the company sends to each sector a panel containing the targets set by senior management for each performance indicator. For the new customers sector, object of this study, the indicators are "orders after deadline (OAD)" and "unproductive visits (UVI)", as shown in Figure 1. For the year 2015, period analyzed in this study, it was allowed until 15% of OAD and 20.23% of UVI. A dashboard with lights is used to assist in the comparison of results versustargets, which can be classified in three ways: red light, when the result is above the allowed value, requiring corrective action immediately; yellow light, when the result is within a range and indicates attention from the sector; green light, when the result is below the established and ensures that the process is correct.
Figure 1. Panel with indicators and targets in 2015
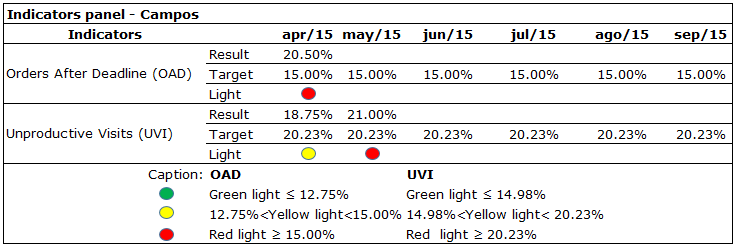
Source: The authors themselves
The data collection period was between the months of April and September 2015 and data from the same period of the previous year was used to allow comparison and analysis of the obtained results. The analysis of data began in April for the OAD indicator and in May for the UVI indicator, because during that period the results were below the targets (red light). A production engineering intern was hired with the necessary knowledge to perform data analyses. It should be noted that, prior to the hiring of the intern, the sector just compared the obtained results with the targets using the panel. The development and deployment of all quality tools followed from the hiring of the intern, with the accompaniment of the analysts.
The "orders after deadline (OAD)" are the services provided to customers outside of the time established by the Brazilian National Electricity Agency (ANEEL), which is the regulatory agency. For example, if there is a new demand to be accomplished within five days and for some reason the team fail to perform the service within that period, that indicator will be impacted. This control item is of great importance to the process, because it can evaluate the quality of services provided to customers and prevent future legal complaints.
The "unproductive visits (UVI)" indicator monitorsthe electrician teams that went to the customer to carry out a service order, but did not execute it or cancel this order for various reasons, among them: the client was not there when the electricians arrived (absent client); the consumer unit (CU) or residence has nostandard equipment required for the connection with the property (technical defect); the client does not know for sure which service he wants (service not in accordance with the request); the customer places two orders of the same service and when the team arrives at the site to run the service, the same has been done by another team (duplicated request); the CU of the client is in a protected area by the Environmental Agency (environmental area).
It is important to note that UVI not only result in rework for teams (since they will have to return to the site again do the work), but also generate unnecessary expenses, since labour has already been paid regardless of service completion.
2.2 Technical procedures
The first step of the study was to establish a continuous improvement plan based on the interests of company’s stakeholders to ensure that the outlined actions are aligned with the mission and vision of the business. The actions were planned, executed and controlled by the trainee and analysts from the perspective of the PDCA (Plan, Do, Check, Act) administrative model, whose main objective was to locate and eliminate possible bottlenecks in the productive processes and/or service provision.
Then, in order to obtain and store the data, a worksheet in Microsoft Office Excel 2010 software was prepared to compile all the anomalies arising from transactions carried out daily in the field, as shown in Figure 2. This database has been characterized as "the anomalies basis" and was modified and updated by all employees involved in the process (internal and field managers, electricians and administrative assistants) with information related to the month of the record, indicator that was affected, the type of occurrence/problem, the cause, and the consequence.
Figure 2. Anomalies basis
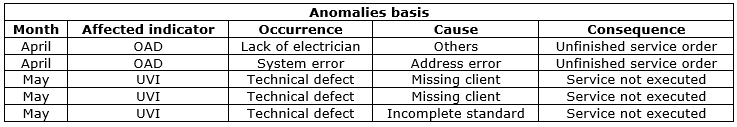
Source: The authors themselves
Subsequently, the base of anomalies was used for application of quality tools with the aim of identifying the main problems and the main causes that affect the non-compliance with the targets set by management for each indicator. First, the problems and the causes were presented with the Ishikawa diagram to facilitate both systemic analysis (covering all problems and causes at the same time) and stratified (by analyzing the causes according to each problem). Then, the problems and the causes were evaluated with the Pareto chart, in order to highlight the main problem and root causes. The next step was to discuss the results at a meeting under the leadership of the electrician engineer with internal and field managers, analysts and the trainee. An action plan 5W1H (What, When, Who, Why, Where, How) was drafted from that meeting.
After the implementation of the action plan, a comparative analysis of the existing targets and performance indicators was carried out. Once the problems were controlled and it was verified that the targets have been achieved, considering a monthly cycle, the routine management was deployed, registering and standardizing the formulated actions and implementing them through the standard operating procedure (SOP) document.
3. RESULTS AND DISCUSSION
The process of Total Quality Management (TQM) implementation, based on management (guidelines, process and routine), started with the PDCA (Plan, Do, Check, Act) cycle. At the planning stage (P) a meeting led by the electrician engineer was held with all internal and field managers, analysts and the trainee in order to explain what would be done to show the importance of complying with the company's operating procedures, the performance of the tasks within the time limits, and especially, to highlight the importance of recordingin the "Anomalies basis" sheet (Figure 2) all information that preventthem from carrying out the activity.
The planning stage, in addition to contemplating this awareness, included also data analysis by quality tools, Ishikawa diagram, and Pareto. In the next step, Do (D), the implementation of the action plan 5W1H was executed to correct the root causes that affected negatively the indicators. Then the results and goals were compared in step Check (C). For the results considered satisfactory, standardization of the actions was proposed by using the SOP tool on step Act (A).
Each step of continuous improvement planning for the electricity distribution company was synthesized in Figure 3.
Figure 3. PDCA
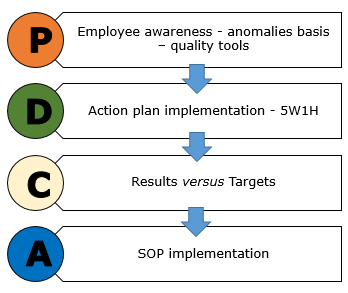
Source: The authors themselves
3.1 Indicator of "Orders After Deadline (OAD)"
After checking the panel, shown in Figure 1, it was established the need to perform an analysis on the anomalies basis for the month of April to develop a corrective action plan aiming to improve the OAD indicator. First, an analysis was made in light of the Ishikawa diagram, as shown in Figure 4.
Figure 4. Application of the Ishikawa diagram for the OAD indicator
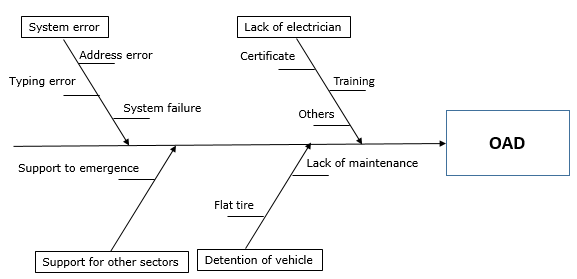
Source: The authors themselves
The Ishikawa diagram allowed visualizing all the problems and causes that were recorded by employees at the anomalies basis. The identified problems were "system error", "lack of electrician", "support for other sectors" and "detention of vehicle". For each problem, the causes that have been registered were also presented.
Then, the problems were analyzed with the Pareto chart in order to identify the main problem and, respectively, the root causes, as shown in Figure 5. It is possible to see through the Pareto chart that the problem "system error" affected 60% of the OAD indicator;thus, this is the main issueto be investigated.
Figure 5. Pareto chart applied to the problems of the OAD indicator
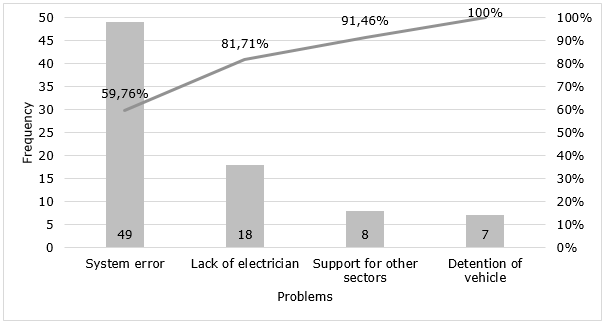
Source: The authors themselves
Again the Pareto chart was used to evaluate the frequency of the causes in order to highlight the one that most impacted the indicator. Therefore, it was verified in Figure 6 that the root cause was "address error" (error in registration of the client’s address when the request was made) with a rate of 69%.
Figure 6. Pareto chart applied to causes of the OAD indicator
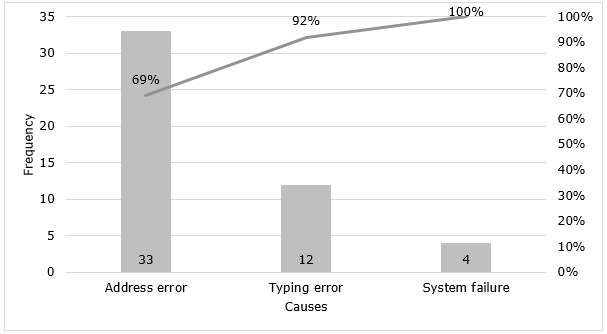
Source: The authors themselves
Based on the data analysis, an action plan was developed to solve the problems that affected the indicator using the 5W1H tool. Figure 7 illustrates the action plan carried out at the beginning of May 2015 to determine the steps and those responsible for the improvementprocess.
Figure 7. Action plan for the OAD indicator
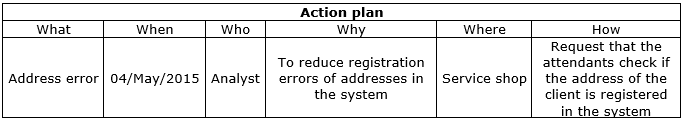
Source: The authors themselves
After the implementation of the action plan in May 2015, the panel shown in Figure 8 was fed and a significant improvement was found (yellow light) if compared with the previous month (red light), but still not reaching theestablished target. In June, a great performance (green light) was achieved in relation to previous months and the target. In July, the performance fell again (yellow light) if compared with the previous month, leading managers and analysts to be vigilant regarding the fundamental causes observed previously. In the coming months, August and September, the targets were met with success (green light).
Figure 8. OAD indicator panel
Source: The authors themselves
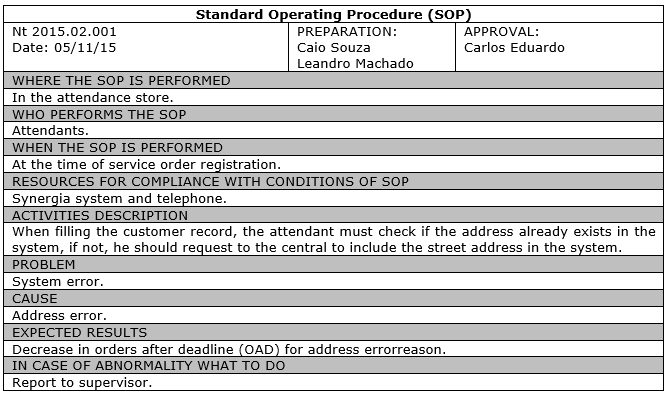
From the results, it was proposed to standardize the activity that eliminates the "address error", since there is a large turnover of attendants and the training process is time consuming. A standard operating procedure (SOP) was elaborated to ratify what each attendant embedded in the process of Campos dos Goytacazes should know to do about the activity, how to do and when to do it. Figure 9 shows the documented SOP for correction of the "address error" cause in order to be used every time the attendants are requesting a service order for a new customer. When performing the customer record, the attendant must check whetherthe address already exists in the Synergia system; if not, he/she should request to the central, located at the headquarters of the company, to include the street address inthe system, preventing failuresinthe return of the orders.
Figure 9. Application of SOP to the "address error" cause
Source: The authors themselves
3.2 Indicator of "Unproductive Visits (UVI)"
The analysis of the UVI indicator anomalies basis began on May 2015 in order to prepare a corrective action plan, due to the results obtained below the specified target. An analysis in the light of the Ishikawa diagram was initially made, as shown in Figure 10, in order to visualize all the problems and potential causes that were impacting the indicator. The most recurrent problems pointed out by employees on the anomalies basis were: "technical defect", "customer", "address", "service", "environment area" and "duplicate request".
Figure 10. Application of the Ishikawa diagram for the UVI indicator
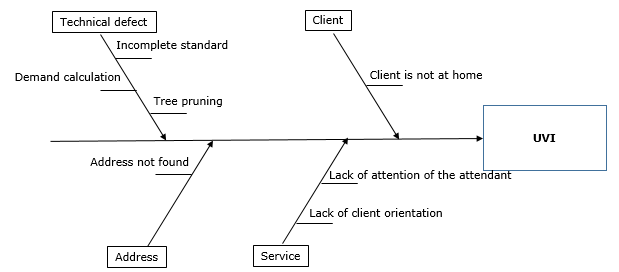
Source: The authors themselves
Then, the Pareto chart (Figure 11) was prepared in order to identify the most recurring problem. The problem that most affected the UVI indicator in May 2015 was "technical defect" with a rate of 43%.
Figure 11. Pareto chart applied to the problems of the UVI indicator
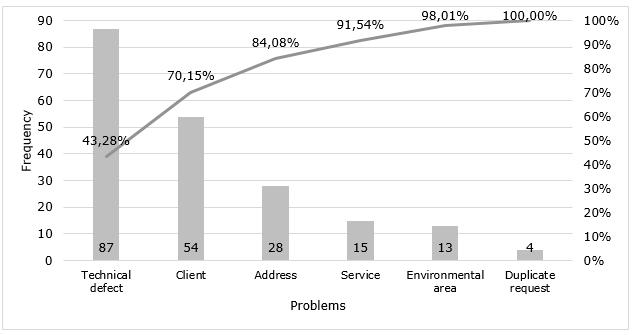
Source: The authors themselves
The Pareto chart was used again to evaluate the frequency of causes in order to highlight the one that more impacted the indicator. It was verified that the root cause was "incomplete standard", with a rate of 56% (Figure 12).
Figure 12. Pareto chart applied to causes of the UVI indicator
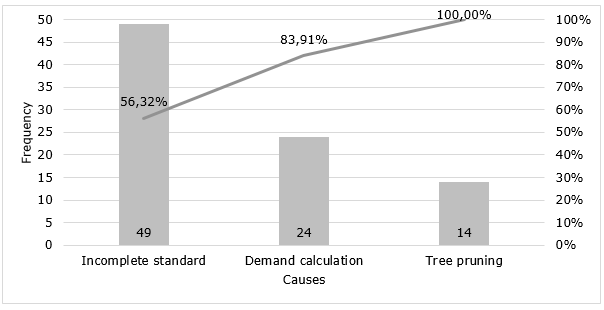
Source: The authors themselves
Figure 13. Action plan for the UVI indicator
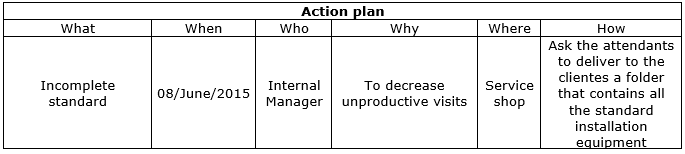
Source: The authors themselves
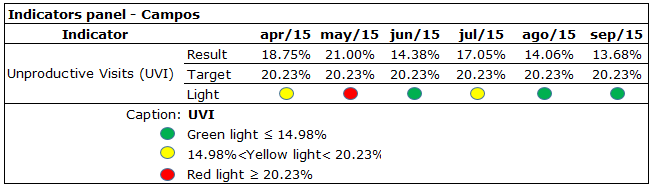
After the implementation of the action plan, it has been found from the indicators panel in Figure 14 that,in June, the result had a great performance (green light) in relation to the month of May (red light). In July, a lower result was obtained (yellow light) in relation to the previous month, leading managers and analysts to be vigilant in terms ofthe fundamental causes observed previously. In the months of August and September great results were obtained against the targets.
Figure 14. UVI indicator panel
Source: The authors themselves
As the action plan obtained the desired results, the tool responsible for the standardization of activities was prepared. Figure 15 presents the documented SOP for correction of the "incomplete standard" cause in order to be used every day by the attendants of the company store. They should inform the customer of his obligation to build the energy input standard outside of the consumer unit or residence. The energy input standard is made up of various equipment and electrical installations (circuit breakers, meter box, pole, secondary frame) required for connection of the electric network with the unit or residence. It is the duty of the attendant to clarify all doubts of the customersand deliver thema folder supplied by the company, containing the standard drawing and all the necessary information.
Figure 15. Application of SOP to the "incomplete standard" cause
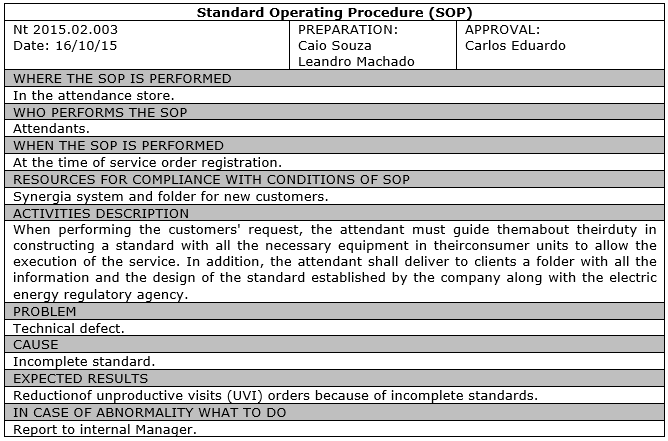
Source: The authors themselves
The SOP made possible the transmission of information and knowledge, ensuring the performance of processes and operations, allowing a high level of productivity to attendants, managers and electricians, through the continued use of certain standards. The end result was the achievement of targets for the performance indicators in the observed period and a best practice for the execution of the job. In addition, the SOP had the ability to make available to each person responsible for the activities, all the necessary information for the proper performance of the task, because prior to the implementation of routine management, there were no historical data for decision-making, no grouping of information, nor a diagnosis of the area.
3.3 Comparative analysis
The results obtained in the analyzed period of 2015 were compared with the same period of 2014. It can be noted that the implementation of Total Quality Management (TQM) and management (guidelines, process and routine) provided better results in 2015 as compared to the same period in 2014, according to Figures 16 and 17.
Figure 16 shows the results achieved with respect to the "Orders after Deadline" (OAD) indicator. There was an overall improvement in the indicator after May 2015, except for the month of July, whichcan be justified by the initial adhesion to the new measures. On the other hand, the months of August and September showed satisfactory results in relation to the previous period, with 6.00% and 7.23% reduction, respectively.
Figure 16. Comparative analysis of the OAD indicator
Source: The authors themselves
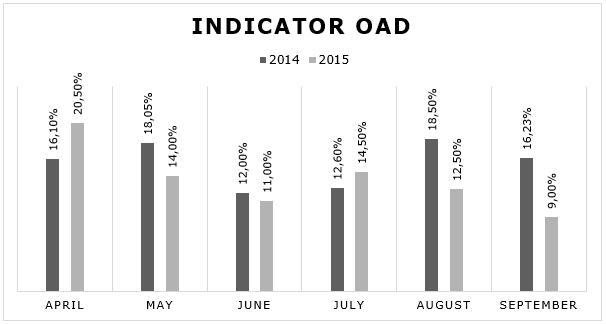
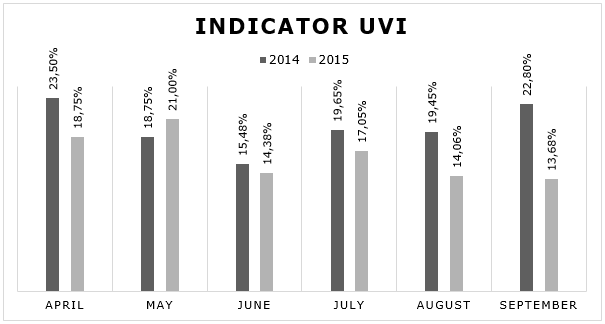
Figure 17 illustrates the results obtained in relation to the performance indicator "Unproductive Visits (UVI)". The graph shows a significant and gradual improvement after the month of June 2015, in which the new management method was implemented, highlighting the month of September with 8.4% reduction rate.
Figure 17. Comparative analysis of the VIM indicator
Source: The authors themselves
4. CONCLUSION
The present work consisted in applying Total Quality Management (TQM) in the new customers sector of an electricity distribution company, located in Campos dos Goytacazes in Rio de Janeiro state. For this purpose, three pillars of management were used: guidelines, processes and routine. The management by guidelines allowed the mapping of targets set by management at the strategic level, the management by processes presented the indicators used for new customers (Orders After Deadline – OAD and Unproductive Visits - UVI) on the tactical level and the routine management allowed the standardization of activities through Standard Operating Procedure documents (SOP), representing the third level of planning.
The integration of the three management levels allowed the implementation of TQM through tools such as PDCA, Pareto and Ishikawa charts, and 5W1H action plan. As a result of this joint application, both indicators obtained significant improvements in the examined periods when compared with the same periods of the previous year. There was a reduction of 12% in the "Orders After Deadline" (OAD) and 22% in the “Unproductive Visits" (UVI) indicators; therefore, this research has achieved the proposed objective.
It is important to note that the performed methodology depended on the involvement of employees, management commitment and, mainly, thehiring of a trainee attending the ninth period in production engineering, all considered fundamental for the integrated implementation of the tools.
Although the results have been promising, the research presented limitations during execution. Initially, there was resistance of some employees during the implementation of the tools. This fact happened mainly due to natural resistance generated by a new work philosophy with the vision that all employees are responsible for the process and not just for an isolated activity.
Another limitation in this study stems from the fact that the methodology was implemented only in a sector of the electricity distribution company, not allowing the inference of the performed methodology as a success case in other industries and segments.
As suggestions for future work, it is proposed to apply the tools used in this research in other sectors of the same segment or different segments in order to contribute to more relevant studies in the area. It is also suggested an analysis of the costs involved in the process and an analysis of performance and satisfaction according to the perspective of the internal clients before and after implementingthe integrated tools.
REFERENCES
Andrade, A.R.; Roseira, C. (2017), “A informação como elemento de integração entre propósito, processos e pessoas em instituições brasileiras e portuguesas”, Revista Eletrônica de Administração, Vol. 23, No. Especial, pp. 292–316.
Androniceanu, A. (2017), “The Three-Dimensional Approach of Total Quality Management, an Essential Strategic Option for Business Excellence”, Amfiteatru Economic, Vol. 19, No. 44, pp. 61–78.
ANEEL. (2012), Agência Nacional de Energia Elétrica, Folder Institucional, available at: http://www2.aneel.gov.br/arquivos/PDF/folder_intitucional_ANEEL_2012.pdf. (accessed 26 October 2018).
Aquilani, B.; Silvestri, C.; Ruggieri, A.; Gatti, C. (2016), “A systematic literature review on total quality management critical success factors and the identification of new avenues of research”, The TQM Journal, Vol. 29, No. 1, pp. 184–213.
Banuro, F.Y.; Ntiri-Ampomah, A.; Banuro, J.K. (2017), “Contradictions in TQM implementation”, The TQM Journal, Vol. 29, No. 4, pp. 564–578.
Bráz, C.C.; Quevedo, A.P.F.; Filho, H.P.C. (2016), “Implementação de uma Ferramenta de Gerenciamento de Rotina e produtividade”, Id on Line Revista Multidisciplinar e de Psicologia, Vol. 10, No. 30, pp. 78–91.
Chao, C.Y.; Hsu, H.M.; Hung, F.C.; Lin, K.H.; Liou, J.W. (2015), “Total quality management and human resources selection: A case study of the national teacher selection in Taiwan”, Total Quality Management and Business Excellence, Vol. 26, No. April, pp. 157–172.
Chiarini, A. (2016), “Corporate social responsibility strategies using the TQM”, The TQM Journal, Vol. 28, No. 3, pp. 360–376.
Gil, A.C. (2002), Como Elaborar Projetos de Pesquisa, 4th ed., Atlas, São Paulo.
Gupta, H.; Bisen, J.; Kumar, S.; Das, S. (2016), “Developing a model of critical success factors for TQM implementation in MSMEs in India and their effect on internal and external quality of organisation”, International Journal of Business Excellence, Vol. 10, No. 4, p. 449.
Khanna, H.K. (2010), “Quality management in Indian manufacturing organizations: Some observations and results from a pilot survey”, Brazilian Journal of Operations & Production Management, Vol. 7, No. 1, pp. 141–162.
Manhas, V.K.; Gupta, P.; Gupta, H. (2015), “Developing and validating critical success factors of TQM implementation in MSMEs of Punjab in India”, International Journal of Indian Culture and Business Management, Vol. 11, No. 4, p. 405.
MME. (2017), 2017 Statistical Yearbook of Electricity: 2016 Baseline Year, Empresa de Pesquisa Energética, Rio de Janeiro, available at: http://www.epe.gov.br/sites-pt/publicacoes-dados-abertos/publicacoes/PublicacoesArquivos/publicacao-160/topico-168/Anuario2017vf.pdf.
Nicholas, J. (2016), “Hoshin kanri and critical success factors in quality management and lean production”, Total Quality Management and Business Excellence, Vol. 27 No. 3–4, pp. 250–264.
Obeidat, B.Y.; Hashem, L.; Alansari, I.; Tarhini, A.; Al-Salti, Z. (2016), “The Effect of Knowledge Management Uses on Total Quality Management Practices: A Theoretical Perspective”, Journal of Management and Strategy, Vol. 7, No. 4, pp. 18–29.
Oliveira, M.; Zuliani, A.C.S.S.; Brescovit, M.R.; Kochhann, S.C.; Obregon, S.L. (2015), “Estudo De Caso: Levantamento e análise da realidade de uma cooperativa de energia elétrica”, Revista de Gestão e Organizações Cooperativas, Vol. 2 No. 4, pp. 83–98.
Pereira, K.A.; Sales, J.D.A. (2015), “The Executive Secretary as a Manager of Organizational Changes in the Automobile Sector”, Revista de Gestão e Secretariado, Vol. 6, No. 2, pp. 44–64.
Silva, E.L.; Menezes, E.M. (2005), Metodologia Da Pesquisa e Elaboração de Dissertação, 4th ed., UFSC, Florianópolis.
Received: 20 Nov 2018
Approved: 01 Jan 2019
DOI: 10.14488/BJOPM.2019.v16.n1.a5
How to cite: Santos, A. C. S. G; Carvalho, L. M.; Souza, C. F. et al. (2019), “Total Quality Management: The Case of an Electricity Distribution Company”, Brazilian Journal of Operations & Production Management, Vol. 16, No. 1, pp. 53-65, available from: https://bjopm.emnuvens.com.br/bjopm/article/view/639 (access year month day).