The Brazilian Innovation Award: Analysis of assessment instrument validity and reliability
Jamile Eleutério Delesposte
Mariana de Oliveira Vale Coutinho
Ramon Baptista Narcizo
Rodolfo Cardoso
Carlos Eduardo Lopes da Silva
ABSTRACT
Goal: This article presents an analysis of the validity and reliability of the assessment instrument used in the 2016–2017 Brazilian Innovation Award.
Design / Methodology / Approach: This study used multivariate analysis techniques on the data from 2,651 companies. Two hypotheses were tested. The first (H1), related to reliability, used Pearson’s Correlation and Cronbach’s alpha. The second hypothesis (H2), related to validity, used Confirmatory factor analysis (CFA).
Results: The instrument is reliable and valid and is an important mechanism for the assessment of the maturity of innovation management.
Limitations of the investigation: One of the constructs can still be improved in future studies and applications, although it has demonstrated acceptable levels of reliability and validity.
Practical implications: The combined use of the constructs “organizational dimensions” and “innovation outcomes” proved to be an accurate conceptual model for assessing the maturity level of innovation management in organizations.
Originality / Value: The instrument is a robust diagnostic instrument and, with appropriate adaptations, it can be replicated and used in other contexts and countries, providing international comparative studies.
Keywords: Brazilian Innovation Award, Innovation management, Assessment instrument, Reliability, Validity.
INTRODUCTION
Brazil has the opportunity to establish an institutional environment more conducive to innovation. In the Global Innovation Index, Brazil ranks 64th in a list of 126 countries (Cornell University et al., 2018). Considering its low innovation performance in comparison to other economies (Gonçalves and Ferreira Neto, 2016; Hui-bo and Bing-wen, 2011; Mehta, 2018), the Brazilian Entrepreneurial Mobilization for Innovation (MEI) launched the Brazilian Innovation Award (PNI) in 2006. The award is coordinated by the Brazilian Industry Confederation (CNI) and the Brazilian Service of Support for Micro and Small Enterprises (SEBRAE) and is intended to stimulate innovation in the Brazilian private sector.
Until 2015, the award evaluated only individual innovation projects, not the entirety of the organizational environment. The 2016–2017 award, in which 2,651 companies participated—including medium and large industrial companies and small companies from all sectors—underwent a profound reformulation of its objectives, its conceptual model, and its assessment instrument. From then on, the objective of the award was redefined to encourage and recognize successful efforts in innovation management within organizations operating in Brazil. The evaluation process also began to consider a more modern and comprehensive view of innovation, assessing the environment of the organization in a holistic and unified way, considering not only its innovation inputs and processes, but also its outputs and performance effects (CNI, 2018a).
The award process consists of several phases. In the first phase, the candidate companies respond to a sixty-question self-assessment questionnaire. Companies that advance to the second phase must present arguments (evaluated by a committee of innovation experts) that justify the performance obtained in the self-assessment. Companies that continue to the next stage undergo an audit visit. The finalists are then selected to be judged by a committee of experts and representatives of public and private innovation bodies in Brazil. The empirical results, derived from the application of the assessment instrument, allowed the construction of a comprehensive and diversified database, encompassing companies of different sizes, sectors, and levels of technological dynamism and complexity. According to Sekaran (1992) and Hayes (1992), the availability of this database makes it possible to carry out a statistical analysis of the validity (i.e., whether it measures what it was designed to measure) and reliability (i.e., whether it has any significant measurement errors) of the assessment instrument.
Using this opportunity, the present article analyzes the validity and reliability of the Brazilian Innovation Award’s assessment instrument, using multivariate analysis techniques on the data from 2,651 companies active in Brazil, with reference to the results of the 2016–2017 award. Two hypotheses are tested. The first hypothesis (H1), that the assessment instrument has satisfactory levels of reliability, was tested using Pearson’s correlation and Cronbach’s alpha. The second hypothesis (H2), that the assessment instrument presents satisfactory levels of correlation between the variables and their underlying constructs, was tested using confirmatory factor analysis (CFA). The article is structured as follows: the next section presents the theoretical basis and contextualizes the hypotheses to be tested. The methods section presents the approach used to analyze the validity and reliability of the instrument. The results and discussion section explores the results, implications, and limitations. The final section presents the conclusions.
THEORETICAL BACKGROUND
The theoretical and methodological foundation of the 2016–2017 PNI is based on studies about innovation assessment in organizations, such as Corsi and Neau (2015), Hervas-Oliver et al. (2015), Laforet (2013), Leal-Rodríguez et al. (2015), Saunila et al. (2014a) and Saunila et al. (2014b). Influenced by the characteristics of respected Brazilian and international reference models such as the Brazilian Quality Award (MEG-PNQ), the Capability Maturity Model Integration (CMM-I) and the Malcolm Baldrige National Quality Award were designed to measure the degree of maturity of innovation management in companies from a combined analysis of two perspectives: (1) the organizational dimensions of innovation capability, expressed in terms of its inputs and processes, and (2) the innovation results, expressed in terms of innovation outputs and outcomes (CNI, 2018b).
The dimensions include organizational aspects (Crossan and Apaydin, 2010; Francis, 2005; Narcizo et al., 2013; Saunila and Ukko, 2012) that enable and support innovation in companies in terms of initiatives, processes, and managerial practices. The main conceptual support for the definition of the organizational dimensions of innovation capability are initially linked to Narcizo (2012), in the preliminary assessment model, and later to Narcizo (2017), Narcizo et al. (2017) and Narcizo et al. (2018) as reference models for the maturity of innovation capability. The PNI’s conceptual model has ten organizational dimensions, each consisting of four variables. Table 1 presents the forty variables, grouped in their respective organizational dimensions.
Table 1. Organizational dimensions and evaluation variables of innovation capability
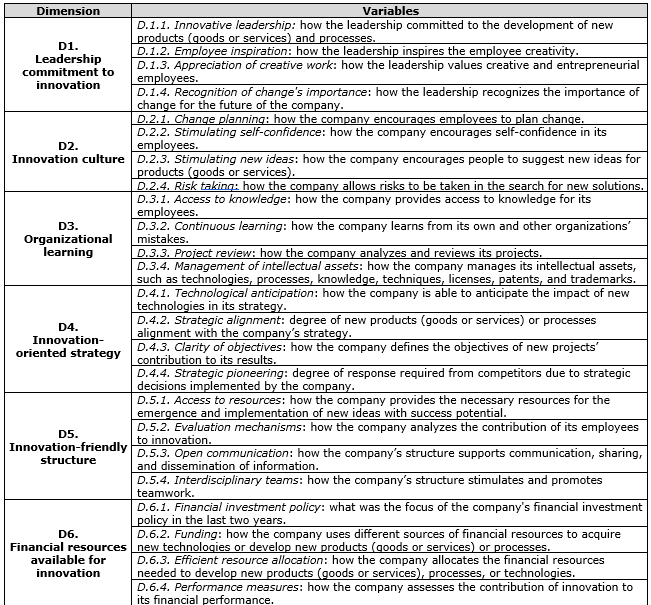
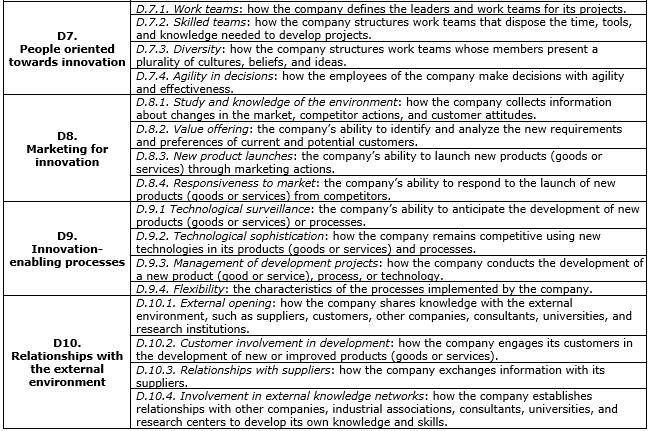
Source: CNI (2018b)
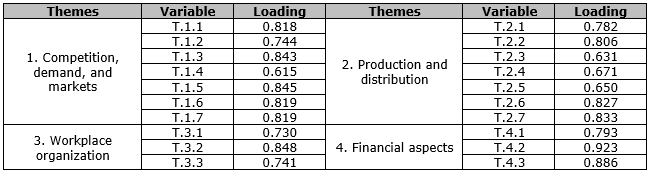
Considering different performance themes (Edwards et al., 2005; Hervas-Oliver et al., 2015; Ngo and O’Cass, 2012; OECD, 2005; Simpson et al., 2006; Stock and Zacharias, 2011), the innovation results measure the degree of success obtained by companies from their innovative outputs. Innovation results relate to the types of innovations that the companies successfully launch and are expressed in alignment with the third edition of the Oslo Manual (OECD, 2005) in terms of product, process, marketing, and organizational innovations. Table 2 shows the twenty performance variables, grouped into four themes for innovation results present in the PNI’s conceptual model.
Table 2. Themes and evaluation variables for innovation results
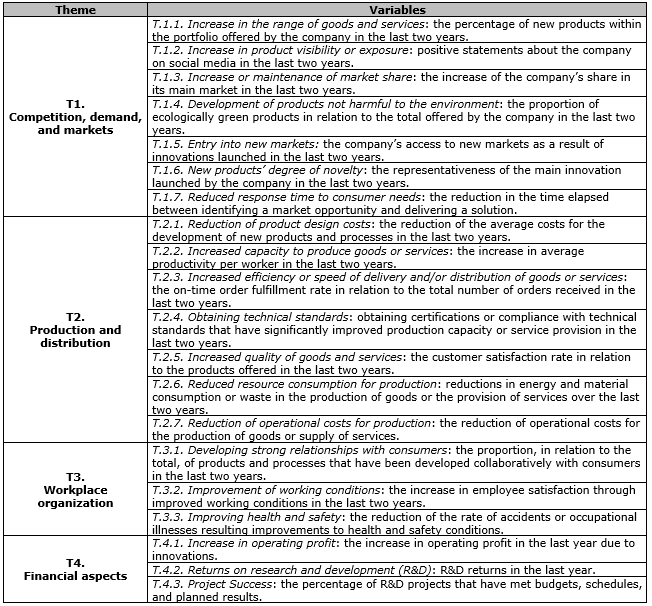
Source: CNI (2018b).
Based on Table 1 and Table 2, the variables connected to the dimensions of innovation capability and the themes of innovation results are the variables for PNI’s assessment instrument. This is not the only instrument for assessing innovation in organizations, however. The specialized literature presents many conceptual models and instruments to assess innovation in organizations, including those in Martínez-Román et al. (2011), Saunila and Ukko (2014) and Yang (2012).
The PNI’s assessment instrument uses an interval scale, where numbers are used to classify objects and events so that the distance between them is equal. These scales are adopted when one wants to measure concepts as perceptions about events through classification. Interval scales of classification typically evolve the use of affirmations accompanied by pre-coded categories (Hair et al., 2005). The application of the instrument recommends the use of metric scales, making possible the statistical treatment of the results. To facilitate the responses, the use of a semantic differential scale was adopted, as it is characterized by the use of five or seven points, with bipolar final labels, and may contain an intermediate point as well (Hair et al., 2005). The PNI instrument adopted a seven-point scale, with labels at the ends and at the center of the scale.
When developing this type of measuring instrument, it is essential to ensure that it is reliable and valid (Hayes, 2008). The accuracy of an instrument’s variables in measuring the associated concept represents the validity, while the instrument’s reliability is connected to its coherence (Hair et al. 2005). Bolarinwa (2015) has argued that, throughout the history of scientific research, scholars have been dedicated to the development of assessment instruments that are accurate enough, so that possible errors and deviations do not compromise the results of the research. The relevance of the reliability and validity of research instruments is shown in Martinez-Lorente et al. (1998), Moustakis et al. (2006), Saravanan and Rao (2006) and Torbica and Stroh (2000). Based on this context, the first hypothesis, H1, has been developed, as follows:
H1: The PNI assessment instrument presents satisfactory levels of reliability.
Complementarily, although an instrument’s reliability is one of the factors necessary to ensure its scientific value, it is not sufficient to support inferences. After the construction of an assessment instrument, it is therefore necessary to perform tests to verify that the instrument will measure what it was designed to measure. When it is possible to affirm that the assessment instrument measures what it has proposed to measure, one can then say that it has scientific validity (Bolarinwa, 2015; Hair et al., 2005; Nunnally, 1967; Sekaran, 2003).
To ensure the validity of an instrument, it is necessary to first guarantee its reliability. An instrument does not need to be valid to be reliable: an instrument can be internally aligned—and thus reliable—even if its indicators do not measure the desired construct. It is impossible for an instrument, whose indicators are not aligned, to measure a specific construct. Unlike reliability, the validity of an instrument is not a property of the instrument per se, but is defined by the degree to which the correct interpretations of the questions can be guaranteed. The validity of an instrument is therefore related to the respondent’s interpretation of the questions (Kimberlin and Winterstein, 2008). Drawing on this background, the hypothesis H2 was thus developed:
H2: The PNI assessment instrument presents satisfactory levels of correlation between the variables and their underlying constructs.
According to Sekaran (2003) and Hair et al. (2005) there are different types of tests to verify the validity of an assessment instrument. These tests can be classified into three main groups: content validation, which verifies how well the set of indicators delineates the concept to be measured; criterion validation, which verifies the ability of the instrument to differentiate the respondents, when it is expected to do so; and construct validation, which examines the relationships between variables and is derived from both content and criterion validation strategies. Validity can be obtained through factor analysis (Hair et al. 2005), which is an interdependence technique whose main purpose is to define the inherent structure among the variables in the analysis. Factor analysis was done by analyzing the structure of the relationships between the variables to identify the variables that are strongly interrelated and to group them together. A factor is a group of strongly intercorrelated variables (Hair et al., 2009).
METHOD
The data analysis of this study consisted of two main steps, as shown in Figure 1. In Step 1, it was prepared the data from the available database, which included the responses of 2,651 companies of different sizes, sectors of activity, and regions of Brazil. According to Hair et al. (2009), when using multivariate analysis techniques, it is important that the researcher prepare the data to avoid biased results or low significance. Data preparation included the following steps: (i) evaluation of lost data, (ii) identification of atypical observations, and (iii) testing of the assumptions inherent in multivariate analysis techniques.
Figure 1. Method overview.
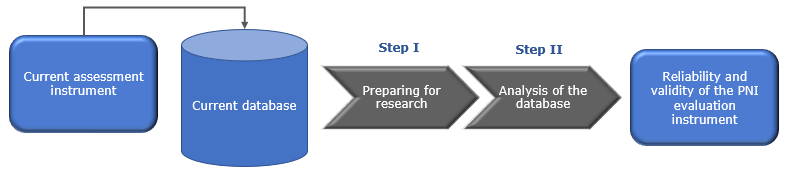
The evaluation of lost data sought to identify whether all the variables in the assessment instrument had valid values and if these data were available for analysis. There was no loss of data because it was mandatory to answer all questions in the instrument due to the diagnostic process adopted by the PNI, and the instrument included information control mechanisms to guarantee it. Similarly, due to the use of an information system to apply the instrument and collect the company responses, no atypical observations were identified that could cause distortions in the analysis. Finally, due to the analysis techniques used in this study, it was not necessary to perform tests to verify whether the data violated the requirements of normality, homoscedasticity, and linearity, as proposed by Hair et al. (2009).
In view of the considerations presented for the preparation of the data (Step 1), it was possible to proceed to the analysis (Step 2). Considering the two hypotheses, H1 and H2, Cronbach’s alpha and Pearson’s correlation were chosen to test H1 and CFA was chosen to test H2, as shown in Table 3.
Table 3. Techniques employed to test the hypotheses
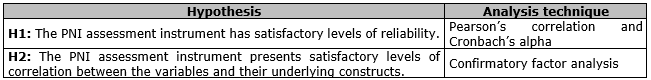
Hypothesis Analysis technique
H1: The PNI assessment instrument has satisfactory levels of reliability. Pearson’s correlation and Cronbach’s alpha
H2: The PNI assessment instrument presents satisfactory levels of correlation between the variables and their underlying constructs. Confirmatory factor analysis
Hypothesis H1 was tested using the internal consistency approach, which considers the degree to which the indicators measure the same object and is an indication of the homogeneity of the items that make up a questionnaire. When the condition of uniformity is not reached, the proper functioning of the instrument is not feasible, and it loses its scientific usefulness. The degree of an instrument’s internal consistency can be obtained through the Cronbach’s alpha and split-half methods. The split-half method determines the correlation between two halves of the same questionnaire, while Cronbach’s alpha verifies the degree of convergence of the indicators for the same construct in an assessment instrument, measured by the alpha correlation coefficient. This is one of the most commonly used methods for determining the reliability of an instrument based on internal consistency, and when using Cronbach’s alpha, the closer to the absolute value of 1.00 the coefficient is, the greater the correlation between the evaluated items (Bonett and Wright, 2015; Cronbach, 1951; Hayes, 1992; 2008; Nunnally and Bernstein, 1967; Sekaran, 1992; 2003).
Hayes (1992) suggests the use of Pearson’s equation to establish the correlation index and to start evaluating the reliability of an instrument. In this technique, the linear relationship between two variables can be represented by a single number, which is called the Pearson’s correlation coefficient. This coefficient indicates the intensity and direction of the correlation between two variables, where the intensity is given by the absolute value of the coefficient, and the direction is given by its signal. Thus, for Hypothesis 1, the reliability of the instrument was obtained through the analysis of its internal consistency, verified by the Pearson’s correlation and Cronbach’s alpha coefficients. Reliability is indicated by the value of this coefficient, considering the individual correlations acceptable by the Pearson’s correlation, calculated based on the values of the correlations between the questions of the assessment instrument. Sample size is important in defining the acceptance limit of Cronbach’s alpha. Samples greater than thirty cases are statistically sufficient and more reliable in the accuracy of the alpha, which can be considered to have a minimum limit of 0.6 (Flynn et al., 1994). The acceptance limit of Cronbach’s alpha was 0.60, as recommended by Hair et al. (2005) for the acceptance of Cronbach’s coefficient in management studies.
In turn, Hypothesis H2 sought to verify the validity of the assessment instrument. The construct validity test was performed. This was justified because the content validity analysis was already considered in the construction of the conceptual model to support the instrument (CNI, 2018b). Criterion validation was also considered unnecessary, because both the conceptual model and the assessment instrument were constructed from a universal perspective, without distinguishing between different types of respondent companies. Construct validation was therefore used to ensure that observable variables were adequately correlated with the concept to which they were associated. The validity was verified through CFA. Considering that there was already an instrument designed and in use, the purpose of this technique was to confirm or reject the previously formulated conceptual model and measurement theory.
CFA is applicable when there are already preconceived groupings before the calculations are executed and the allocation of each variable in the group has already been defined (Hair et al., 2009). In this situation, it is useful to formulate hypotheses about the distribution of variables by factors, considering which variables best fit a given factor or which the best quantity of factors is. It is not possible to perform a CFA without a theory of measurement, because in doing so, the researcher must define a priori the quantity of factors and the variables within each factor with theoretical support. The factors obtained through the application of CFA can serve as the input to estimate the reliability of constructs. This estimator is obtained by the square of the sum of the factor loads of each construct and the sum of the variances of the constructs. For confirmation of construct validation, Hair et al. (2009) suggests that the loads should be greater than 0.50 and that the measures of variance extracted should equal or exceed 50%, which is found with eigenvalues greater than 1.00 for a single factor (component).
RESULTS AND DISCUSSION
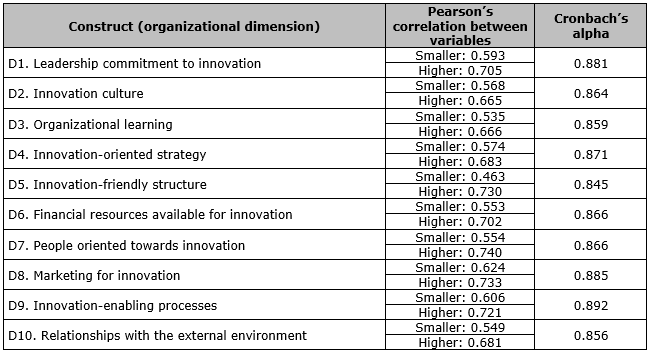
Regarding the evaluation of the internal consistency of the instrument, Figure 2 presents the Pearson’s correlation and Cronbach’s alpha coefficients found for the variables of each dimension. As can be observed, a Cronbach’s alpha greater than 0.60 was obtained for all of the instrument’s innovation capability dimensions. Furthermore, considering Hair et al. (2005), because Pearson’s correlations were between 0.2 and 0.9, the correlations among the variables were considered sufficient, and it is likely that there was a coherent and systematic relationship between variables. Correlation coefficients between 0.91 and 1.00 are very strong and indicate that covariance is decidedly shared between the two variables being examined. The coefficients 0.00 and 0.20, however, indicate the chance that the associated null hypothesis will not be rejected. This means that all the dimensions of the instrument have satisfactory internal consistency.
Figure 2. Cronbach’s alpha for the organizational dimensions
Following the evaluation of the internal consistency of the instrument, Figure 3 presents the Pearson’s correlation and Cronbach’s alpha coefficients found for the variables of each innovation result theme. As can be observed, a Cronbach’s alpha greater than 0.60 was obtained for all of them, so it appears that all of the themes have satisfactory internal consistency.
Figure 3. Cronbach’s alpha for the innovation results themes
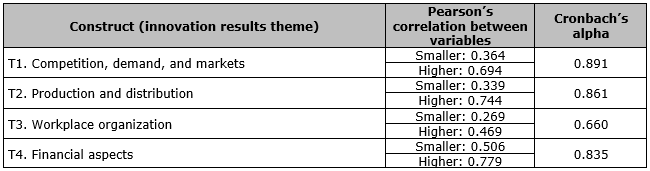
However, Theme 3 (Workplace organization) presented a Cronbach’s alpha lower than the values found for the other constructs analyzed. This construct also presented a correlation of 0.269 between variables, which is considered small, although it is sufficient. The three variables related to Theme 3 (T.3.1, T.3.2, and T.3.3) derived directly from the guidelines contained in the Oslo Manual (OECD, 2005). Verifying the individual relationships between the variables (suppressed in this article), it is noticeable that variable T.3.1 (development of strong relations with the consumers) may weaken the relationships among the others, consequently resulting in a Cronbach’s alpha that is less significant for the internal consistency of this theme. This interpretation suggests that there are still opportunities for further studies to analyze the clusters variables for innovation results derived from the Oslo Manual (OECD, 2005).
Once the internal consistency of Theme 3 was considered satisfactory via Cronbach’s alpha, no modifications were made to this construct. It would, however, be interesting to carry out further tests or new consistency analysis using the data from subsequent PNIs. Depending on the results obtained, it may be advisable to adapt variable T.3.1 or even to substitute another variable that is more conceptually adherent to the construct under evaluation.
Figure 4. Total variance explained for the organizational dimensions
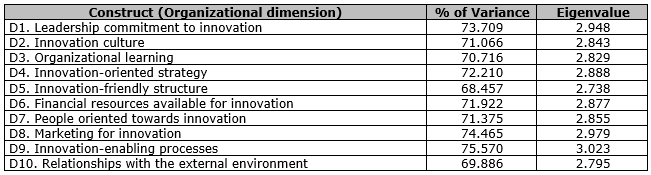
Regarding the validity of the constructs, Figure 4 shows that all dimensions have a variance greater than 50% and eigenvalues greater than 1, indicating that the extraction of a single factor was sufficient in each of the dimensions and ensuring the consideration of a single construct per dimension was appropriate. Each dimension possessed an adequate extraction of the representative basic concept; thus, it was possible to evaluate the loading of the variables associated with each of them, as shown in Figure 5.
Figure 5. Confirmatory factor extraction for the organizational dimensions
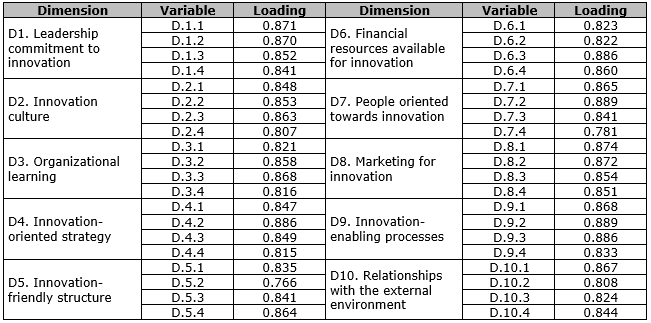
Figure 5 indicates that the variables, for all dimensions, had loads greater than 0.5, demonstrating the validity of these constructs. In addition to the loads being satisfactory, the load values of the variables in the same dimension were close to each other, suggesting that, in addition to the validity of the construct, there was a roughly uniform relationship between the variables and the concept underlying that dimension.
Figure 6. Total variance explained for the themes of innovation results
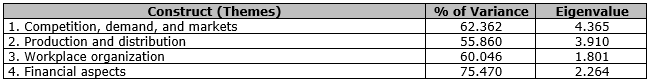
Regarding the validity of the constructs, Figure 6 also indicates that, for all themes, the variance of the variables exceeded 50% and had eigenvalues greater than 1. These results indicate that the extraction of a single factor was sufficient, confirming as adequate the consideration of a single construct per theme. As can be seen in Figure 7, the respective variables for each theme also had loads greater than 0.5, indicating the validation of these constructs.
Figure 7. Confirmatory factor extraction for the themes of innovation results
From the presented results, it is possible to verify hypotheses H1 and H2. The first hypothesis tested was H1; the PNI assessment instrument has satisfactory levels of reliability. The use of Cronbach’s alpha to verify the internal consistency of the instrument presented satisfactory results for all constructs. Thus, the hypothesis was accepted, and the reliability of the instrument was attested by its internal consistency. Although the tests presented results that met the established success variables, the variable T.3.1 (development of strong relationships with the consumers) was determined to be a point requiring attention. The interpretation of the results indicated that there was the possibility that this variable may weaken the consistency of this construct. For future studies and applications of this instrument, it would be recommended that special attention be paid to this variable and its relationship with Theme 3.
The second hypothesis tested was H2; the PNI assessment instrument presents satisfactory levels of correlation between the variables and their underlying constructs. The use of CFA to verify the validity of the instrument presented satisfactory results for all constructs. The hypothesis was therefore accepted, and the validity of the instrument attested through the correlations between the variables and the constructs in which they were inserted. Although the analysis presented results satisfying the minimum acceptable values, a review of the variables that compose the constructs referring to the “Innovation Results Themes” is recommended. The results suggest that the contents of these variables have underlying concepts that may possibly be more dispersed and diversified than the concepts for the dimensions’ variables, which behaved in a more homogeneous way. Although this does not imply low reliability or validity—nor even the existence of conceptual misunderstandings regarding the content or the allocation of these variables—it would be advisable to perform new tests and improvements in these items in other studies and future applications of the instrument.
CONCLUSION
This article sought to verify the reliability and validity of the assessment instrument used in the Brazilian National Innovation Award. Multivariate analysis techniques were employed on the database generated by the 2016–2017 award, which involved the participation of 2,651 companies of different sizes and sectors. Pearson’s correlation and Cronbach’s alpha coefficients were used to analyze the reliability of the instrument, while CFA was used to analyze the instrument’s validity.
The results obtained from the analysis indicated that the instrument was in adequate condition to use and demonstrated its accuracy in assessing the maturity level of the innovation management in organizations through a combined assessment of the organizational dimensions of innovation capability and themes of innovation outcome. In addition to the statistical validation of PNI’s assessment instrument, the analysis presented in this article also provided a better understanding of the relationships between the evaluation variables and their respective constructs, contributing to the increased robustness, reliability, and representativeness of the data obtained from the application of this instrument in future iterations of the award.
The organizational dimensions of innovation capability demonstrated significant reliability and validity. The themes of innovation results also demonstrated reliability and validity, but there were still opportunities for improvement. Theme 3 (Workplace organization) obtained a value below the recommended minimum for the Pearson’s correlation among its variables. However, these results do not compromise their quality. Therefore, the assessment instrument used in the Brazilian National Innovation Award does appear to be a robust diagnostic tool for the level of maturity of the innovation management in companies in Brazil. In view of the representative and heterogeneous number of organizations that responded to the questionnaire, in the case of appropriate adaptations—particularly in terms of translations, linguistic, and cultural adjustments—it is believed that this instrument could be successfully used in other contexts and countries.
REFERENCES
Bolarinwa, O. A. (2015), “Principles and methods of validity and reliability testing of questionnaires used in social and health science researches”, Nigerian Postgraduate Medical Journal, Vol. 22, No. 4, pp. 195, available from: https://doi.org/10.4103 / 1117-1936.173959 (access 20 Jan. 2018).
Bonett, D. G.; Wright, T. A. (2015), “Cronbach’s alpha reliability: Interval estimation, hypothesis testing, and sample size planning: Cronbach’s Alpha reliability”, Journal of Organizational Behavior, Vol. 36, No. 1, pp. 3–15, available from: https://doi.org/10.1002/job.1960 (access 20 Jan. 2018).
Confederação Nacional da Indústria – CNI (2018a), “Prêmio Nacional de Inovação - Edição 2016/2017”, available from: https://goo.gl/5WzBea (access 30 Oct 2018).
Confederação Nacional da Indústria – CNI (2018b), “Metodologia de Avaliação do Prêmio Nacional de Inovação”, available from: https://goo.gl/rV2N9X (access 22 Oct. 2018).
Cornell University; The Business Scholl for the World (INSEAD); World Intellectual Property Organization (WIPO) (2018), “The Global Innovation Index 2018: Energizing the World with Innovation”, Ithaca, Fontainebleau, and Geneva, available from: https://www.globalinnovationindex.org/gii-2018-report (access 20 Oct. 2018).
Corsi, P.; Neau, E. (2015), Innovation capability maturity model, John Wiley & Sons, London.
Cronbach, L. J. (1951), “Coefficient alpha and the internal structure of tests”, Psychometrika, Vol. 16, No. 3, pp. 297–334, available from: https://link.springer.com/article/10.1007/BF02310555 (access 20 Sep. 2018).
Crossan, M. M.; Apaydin, M. (2010) “A Multi-Dimensional Framework of Organizational Innovation: A Systematic Review of the Literature”, Journal of Management Studies, Vol. 47, No. 6, pp. 1154–1191, available from: http://dx.doi.org/10.1111/j.1467-6486.2009.00880.x (access 20 Out. 2018).
Edwards, T.; Delbridge, R.; Munday, M. (2005), “Understanding innovation in small and medium-sized enterprises: A process manifest”, Technovation, Vol. 25, No. 10, pp. 1119–1127, available from: https://doi.org/10.1016/j.technovation.2004.04.005 (access 21 Set. 2018).
Flynn, B. B.; Schroeder, R. G.; Sakakibara, S. (1994) “A framework of quality management research and an associated measurement instrument”, Journal of Operations Management, Vol. 11, No. 4, pp. 339-366.
Francis, D. (2005) “A reference model of innovation capability and implications for organisational development”, present in the 6th International CI Net Conference: Continuous Innovation - (Ways of) Making Things Happen, Brighton, United Kingdom, 4-6 sep. 2005.
Gonçalves, E.; Ferreira Neto A. B. (2016), "Intersectoral flows of technological knowledge in emerging countries: An input-output analysis", CEPAL Review, Vol. 2016, No. 118, available from: https://doi.org/10.18356/db371779-en (access 20 Oct. 2018).
Hair, J. F.; Black, W. C.; Babin, B. J.; Anderson, R. E.; Tatham, R. L. (2009), Análise Multivariada de Dados, 6ª ed., Bookman, Porto Alegre.
Hair, J. R.; Babin, B.; Money, A. H.; Samouel, P. (2005) Fundamentos de Métodos de Pesquisa em Administração, Bookman, Porto Alegre.
Hayes, B. E. (1992), Measuring customer satisfaction: Development and use of questionnaire, ASQC Quality, Milwaukee.
Hayes, B. E. (2008), Measuring customer satisfaction and loyalty: survey design, use, and statistical analysis methods, 3rd ed., ASQ Quality Press.
Hervas-Oliver, J. L.; Sempere-Ripoll, F.; Arribas, I. (2015), “Asymmetric modeling of organizational innovation”, Journal of Business Research, Vol. 68, No. 12, pp. 2654–2662, available from: https://doi.org/10.1016/j.jbusres.2015.04.005 (access 20 Oct. 2018).
Hui-bo, Z.; Bing-wen, Z. (2011), “A comparative study on NIS (national innovation system) in the Bric economies, in: 2011 International Conference on Management Science & Engineering 18th Annual Conference Proceedings”, presented at the 2011 International Conference on Management Science and Engineering (ICMSE), IEEE, Rome, Italy, 13-15th set. 2011.
Kimberlin, C. L.; Winterstein, A. G. (2008), “Validity and reliability of measurement instruments used in research”, American Journal of Health-System Pharmacy, Vol. 65, No. 23, pp. 2276–2284, available from: https://doi.org/10.2146/ajhp070364 (access 20 Oct. 2018).
Laforet, S. (2013), “Organizational innovation outcomes in SMEs: Effects of age, size, and sector”, Journal of World Business, Vol. 48, No. 4, pp. 490–502, available from: https://doi.org/10.1016/j.jwb.2012.09.005 (access 15 Oct. 2018).
Leal-Rodríguez, A. L.; Eldridge, S.; Roldán, J. L.; Leal-Millán, A. G.; Ortega-Gutiérrez, J. (2015), “Organizational unlearning, innovation outcomes, and performance: The moderating effect of firm size”, Journal of Business Research, Vol. 68, No. 4, pp. 803–809, available from: https://doi.org/10.1016/j.jbusres.2014.11.032 (access 15 Oct. 2018).
Martinez-Lorente, A. R.; Gallego-Rodriguez, A.; Dale, B. G. (1998), “Total quality management and company characteristics: an examination”, Quality Management Journal, Vol. 5, No. 4, pp.59-71, available from: https://doi.org/10.1080/10686967.1998.11919168 (access 10 Oct. 2018).
Martínez-Román, J. A.; Gamero, J.; Tamayo, J. A. (2011), “Analysis of innovation in SMEs using an innovative capability-based non-linear model: A study in the province of Seville (Spain)”, Technovation, Vol. 31, No. 9, pp. 459–475, available from: https://doi.org/10.1016/j.technovation.2011.05.005 (access 30 Set. 2018).
Mehta, S. (2018), “National Innovation System of India: An Empirical Analysis”, Millennial Asia, Vol. 9, No. 2, pp. 203–224, available from: https://doi.org/10.1177/0976399618786343 (access 20 Oct. 2018).
Moustakis, V.; Tsironis, L.; Litos, C. (2006), “A Model of Web Site Quality Assessment”, ASQ: Quality Management Journal, USA, Vol. 13, No. 2, pp. 22–37, available from: https://doi.org/10.1080/10686967.2006.11918547 (access 05 Oct. 2018).
Narcizo, R. B. (2012), Desenvolvimento de um método orientado para a avaliação da capacidade de inovação das micro e pequenas empresas instaladas na região da Bacia de Campos (RJ), Dissertação de mestrado em Engenharia de Produção, Universidade Federal do Rio de Janeiro, Rio de Janeiro, RJ. available from: https://doi.org/10.13140/RG.2.1.4381.4160 (access 05 Oct. 2018).
Narcizo, R. B. (2017), Um modelo de referência para a maturidade da capabilidade de inovação em micro e pequenas empresas de baixa tecnologia, Tese de Doutorado em Engenharia de Produção, Universidade Federal do Rio de Janeiro, Rio de Janeiro, RJ. available from: https://doi.org/10.13140/RG.2.2.36390.22083 (access 05 Oct. 2018).
Narcizo, R. B.; Canen, A. G.; Tammela, I. (2013), “SME's innovation capability as a resource to meet future logistical demands of Brazilian oil industry”, Annals of the Faculty of Engineering Hunedoara, Vol. XI, pp. 157-162, available from: http://annals.fih.upt.ro/pdf-full/2013/ANNALS-2013-1-21.pdf (access 05 Oct. 2018).
Narcizo, R. B.; Canen, A. G.; Tammela, I. (2017), “A conceptual framework to represent the theoretical domain of ‘innovation capability’ in organizations”, Journal of Entrepreneurship, Management and Innovation, Vol. 13, No. 1, pp. 147–166, available from: https://doi.org/10.7341/20171316 (access 20 Oct. 2018).
Narcizo, R. B.; Canen, A. G.; Tammela, I. (2018), “A framework for Innovation Capability performance assessment in Brazilian low-tech small business”, article presented in 14th International Conference on Industrial Logistics, Beer-Sheva, Israel, 14-16th may. 2018.
Ngo, L. V.; O’Cass, A. (2012) “In search of innovation and customer-related performance superiority: The role of market orientation, marketing capability, and innovation capability interactions”, Journal of Product Innovation Management, Vol. 29, No. 5, pp. 861–877, available from: https://doi.org/10.1111/j.1540-5885.2012.00939.x (access 02 Oct. 2018).
Nunnally, J. C. (1967), Psychometric theory, Vol. 226, McGraw-Hill, New York.
Nunnally, J. C.; Bernstein, I. H. (1967), Psychometric Theory, 3rd Edition, McGraw-Hill, New York.
Organisation for Economic Co-Operation and Development – OECD (2005), Oslo Manual: Guidelines for Collecting and Interpreting Innovation, 3rd ed., OECD/Eurostat, Paris.
Saravanan, R.; Rao, K (2006), “The Impact of Employees’s Characteristics on Total Quality Service Implementation: An Empirical Study”, ASQ: Quality Management Journal, USA, Vol. 13, No. 4, pp. 22–35, available from: https://doi.org/10.1080/10686967.2006.11918570 (access 02 Oct. 2018).
Saunila, M.; Mäkimattila, M.; Salminen, J. (2014a), “Matrix structure for supporting organisational innovation capability”, International Journal of Business Innovation and Research, Vol. 8, No. 1, pp. 20–35, available from: https://doi.org/10.1504/IJBIR.2014.058044 (access 18 Sep. 2018).
Saunila, M.; Pekkola, S.; Ukko, J. (2014b), “The relationship between innovation capability and performance”, International Journal of Productivity and Performance Management, Vol. 63, No. 2, pp. 234–249, available from: https://doi.org/10.1108/IJPPM-04-2013-0065 (access 15 Sep. 2018).
Saunila, M.; Ukko, J. (2012), “A conceptual framework for the measurement of innovation capability and its effects”, Baltic Journal of Management, Vol. 7, No. 4, pp. 355–375, available from: https://doi.org/10.1108/17465261211272139 (access 10 Out. 2018).
Saunila, M.; Ukko, J. (2014), “Intangible aspects of innovation capability in SMEs: Impacts of size and industry”, Journal of Engineering and Technology Management, Vol. 33, pp. 32–46, available from: https://doi.org/10.1016/j.jengtecman.2014.02.002 (access 10 Out. 2018).
Sekaran, U. (1992), Research methods for business: A Skill-Building Approach, 2nd ed., John Wiley & Sons, New York.
Sekaran, U. (2003), Research methods for business: A Skill-Building Approach, 4th ed., John Wiley & Sons, New York.
Simpson, P. M.; Siguaw, J. A.; Enz, C. A. (2006), “Innovation orientation outcomes: The good and the bad”, Journal of Business Research, Vol. 59, No. 10/11, pp. 1133–1141, available from: https://doi.org/10.1016 / j.jbusres.2006.08.001 (access 15 Out. 2018).
Stock, R. M.; Zacharias, N. A. (2011) “Patterns and performance outcomes of innovation orientation”, Journal of the Academy of Marketing Science, Vol. 39, No. 6, pp.870–888.
Torbica, M.; Stroh R., (2000), “HOMBSAT – An Instrument for Measuring Home-Buyer Satisfaction”, ASQ: Quality Management Journal, USA, Vol. 7, No. 4, pp.32-44, available from: https://doi.org/10.1080/10686967.2000.11918919 (access 12 Out. 2018).
Yang, J. (2012), “Innovation capability and corporate growth: An empirical investigation in China”, Journal of Engineering and Technology Management - JET-M, Vol. 29, No. 1, pp. 34–46, available from: https://doi.org/10.1016/j.jengtecman.2011.09.004 (access 10 Oct. 2018).
Received: 06 Nov 2018
Approved: 08 Jan 2019
DOI: 10.14488/BJOPM.2019.v16.n2.a4
How to cite: Delesposte, J. E.; Coutinho, M. O. V.; Narcizo, R. B. et al. (2019), “The Brazilian Innovation Award: Analysis of assessment instrument validity and reliability”, Brazilian Journal of Operations & Production Management, Vol. 16, No. 2, pp. 201-212, available from: https://bjopm.emnuvens.com.br/bjopm/article/view/625 (access year month day).