University of Campinas – UNICAMP, Campinas, São Paulo, Brazil.
Federal University of Paraná – UFPR, Curitiba, Paraná, Brazil.
Federal University of Paraná – UFPR, Curitiba, Paraná, Brazil.
Federal University of Paraná – UFPR, Curitiba, Paraná, Brazil.
Goal: This work aims to compare performance indicators of the pulled, pushed and hybrid production schedule, with those of a specific production environment of the printing industry, using computational simulation.
Design / Methodology / Approach: Through a case study, it was possible to create a conceptual model, from which a computational model that was verified and validated as representative of the real productive system was developed. There are generated fictional models of the production environments to compare cycle time, work in process and attendance to the demand, varying the quantity of orders confirmed by the final clients.
Results: The CONWIP (Constant Work in Process) system presented very high cycle times and failure to meeting the demand, although it was kept in the format of the work in process. The real system and the pushed system obtained the worst performances regarding the work in process, besides presenting failures to meeting the demand and very high cycle times. The pulled system obtained the best performance to meet the demand, and cycle times adequate to the production requirement and moderate work in process.
Limitations of the investigation: The application of the methodology was limited to the study of a single productive system of a print industry and cannot be extended to the entire sector.
Practical implications: This work presents a practical application of computer simulation tools applied to Production Planning and Controls which may be replicated by other organizations or educational institutions for system performance analysis in different scenarios.
Originality / Value: The original contribution of this work is the application of computational simulation for a production system in a print industry without interference in a real system.
Keywords: Production Schedule; Pushed and Pulled; Performance of systems; Simulation.
In recent years, according to Wolfsgruber and Lichtenegger (2016), there was a great technological advance that allowed the increase of variety of products, besides the shortening of their life cycles. These changes caused an increase in the demands of the customers, in terms of deadlines, price and quality of the products, leading the organizations to seek changes in their productive environment, aiming at a better performance. Thereby, it became possible to meet demand quickly and, at the same time, maintain low production costs without losing the quality of the processes and products (Güçdemir and Selim, 2017).
To adapt to this scenario, Güçdemir and Selim (2017) suggest that complex decisions about order processing and manufacturing, lot size, production capacity determination, and production scheduling approaches should be taken. The Production Planning and Control (PPC), according to Vollman et al. (2006), aims to help these decisions, ensuring good management of all sectors of the organization through the link between the strategic, tactical, and operational levels.
At the operational level of the PPC, it is carried out a production scheduling which can use a pushed system when it is based on demand forecasting, pulled when it is based on customer orders or hybrid, and which combines the pulled and pushed methods (Hopp and Spearman, 2013; Vollman et al., 2006).
The choice of the production system must be in accordance with the performance objectives of the organization; however, each productive environment has its peculiarities, which makes this choice not trivial. Some authors, such as Wolfsgruber and Lichtenegger (2016), Gong et al. (2014), Pettersen and Segerstedt (2009), Takahashi and Hirotani (2005), Krishnamurthy et al. (2004), Geraghty and Heavey (2003), Huang et al. (1998), Bonvik et al. (1997), Roderick et al. (1994), Spearman and Zananis (1992), Spearman et al. (1990), and Lee (1989) proposed comparative experimental studies, pointing out the differences of production systems in specific environments. It is a consensus among the authors that the performance of different systems may be different in each productive environment, although the characteristics pertinent to the type of scheduling are kept similar in all experiments.
This work proposes a comparative analysis of a production environment, through the evaluation of the scheduling approaches of pulled, pushed and hybrid production, in different scenarios. Computational modeling and simulation are used to evaluate performance indicators related to production times, levels of materials in process and finished products, and demand meeting.
For the accomplishment of this work, it was chosen a national graphic industry, whose production combines the pulled and pushed approaches. Field research was done to conceptually model the real system through a case study. From the conceptual model a computational model was made. Both were validated according to the real system. Three fictitious models have been generated, which represent the pulled, pushed, and hybrid approaches, as well as the different simulation scenarios. By simulating the different scenarios, qualitative analyzes were carried out, allowing a comparison between the four proposed models.
The importance of this work is justified by the number of variables involved in the analysis and by the difficulty of evaluating production scheduling decisions using conventional tools. With the advent of productive flow simulation software with easy-to-use configuration interfaces, it is possible to study the problem with a high level of details, as well as to evaluate different scenarios without interference in real systems.
The three most frequently used systems in the literature for production scheduling are differentiated by the way the demand-corresponding orders will be produced.
According to Wolfsgruber and Lichtenegger (2016) the choice of the best approach is complex because the main objective of the PPC and production scheduling is to respond promptly to the market that has volatile characteristics. According to the authors, a flexible system that can combine the best of each approach at different stages and times of production tends to perform better than systems with fixed and single production scheduling. Pereira et al. (2017) argue that the implementation of lean manufacturing with pull scheduling does not guarantee the same results for companies even though they are similar, which makes the choice of production scheduling even more complex.
Production systems with pushed programming can be characterized by planning and releasing production orders based on demand forecasts. In order to assist the scheduling of the production, there are production planning and control systems such as MRP, Material Requirements Planning, MRP II, Manufacturing Resources Planning and ERP, Enterprise Resources Planning (Hopp and Spearman, 2013; Gstetter and Kuhn, 1996).
According to Bonney et al. (1999) in the pushed approach, the material and information flows follow the same direction, as the products are processed from the purchase of raw material to the exit of finished products.
Ohno (1997) presented the pulled system, justifying that customers are ahead of the market, requesting products in the quantity and moment they need, and it is up to the organizations to provide them promptly.
Moreira (2008) states that in pulled scheduling the last productive season or even the final customer will request an item from the previous process and then the production request will occur backwards along the system in the opposite direction of the production flow. The request is made using the Kanban system cards. If there is no request, the system does not produce, which implies not producing in excess, manufacturing as little as possible and, consequently, with the lowest possible cost. The same logic should be used in the purchase of raw materials, component manufacturing, sub-assemblies and final assembly of the products. According to Carvalho et al. (2017), the kanban system is the tool with more applications documented in the literature for application of lean manufacturing.
According to Spearman et al. (1990), the CONWIP (Constant Work in Process) system was developed in the late 1980s with the objective of establishing a hybrid production, combining the pulled and pushed approaches with the possibility of using a card system in more industrial environments, whose WIP level was constant along the production line.
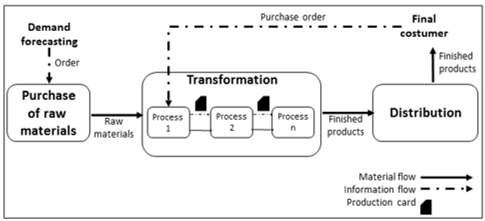
The operating principle of the CONWIP system, shown in Figure 1, consists of a card system where a fixed number of cards is allocated to a line and, when a card exits the finished product stock, it is sent to the beginning of the productive process. The cards are withdrawn from the stock of finished products when the customer's request is made, that is, the production starts with an order placement. The card is sent to the beginning of the process and follows along with the flow of materials in production. The card follows from the first production station to the last one, following FIFO (First In First Out), accompanying the production (Hopp andSpearman, 2013).
Figure 1. Hybrid scheduling information and production flow.
Source: The authors.
This way, the card behaves in the hybrid approach as a traditional card of the pulled approach (kanban) and a production order of the pushed approach.
As it is a more recent production system than the pulled and pushed systems, some authors have proposed works of performance evaluation of the CONWIP system since it was proposed by Spearman et al. (1990).
Duenyas and Hopp (1990) and Duenyas et al. (1993) proposed a method to estimate the output flow variance in the production line. Di Mascolo et al. (1996) and Di Mascolo (1996) proposed a method to analyze a kanban production system with the incorporation of CONWIP. Duri et al. (2000) proposed a method to measure the performance of a CONWIP system.
Park and Lee (2013) proposed a method to evaluate the performance of a CONWIP system for multiple products processed on the same production line. Hoose et al. (2016) implemented a CONWIP system in an agricultural machine industry, observing a reduction of the material in process and an increase in productivity. Leonardo et al. (2017) implemented the CONWIP system in a factory of electro-mechanical components, reducing cycle time and increasing production volume. Dallasega and Rauch (2017) have used the CONWIP system principle to synchronize demand and supply in manufacturing leading to the formation of sustainable supply chains in on-demand project companies.
Hopp and Spearman (2013) pointed out the differences between pushed, pulled and hybrid systems, from the perspective of modeling. According to the authors, the CONWIP system is similar to a network of closed queues, in which clients (works) circulate indefinitely within the network. The MRP system, whose scheduling is pushed, behaves as an open network of queues, in which the works enter the line and leave as soon as they are finalized, that is, they do not return to the beginning of the system. The Kanban system, whose scheduling is pulled, behaves as a closed and blocked queue network. This block is given by the maximum number of WIPs in the system that is proportional to the number of cards in the system (Hopp and Spearman, 2013).
Some works have pointed out, through simulation of production systems, the advantages of using the CONWIP system in relation to the Kanban or MRP systems (Onyeocha et al., 2015; Gong et al., 2014; Bonvik et al., 1997; Spearman and Zananis, 1992; Buzacott and Shanthikumar, 1992; Spearman et al., 1990):
Lower total inventory of finished products and less material in process, under the same production conditions.
Lower variability of the quantity of material in process, leading to a better control over this item.
Better meeting a constant demand, keeping less quantity of material in process.
The better the performance compared to the Kanban system, the greater the number of jobs and/or variability of the production process.
Gong et al. (2014) compared the CONWIP, Kanban and MRP systems, also concluding that the first presents a smaller amount of information processed during the production stages, which can facilitate decision making in the organization.
Comparative studies of the three systems, conducted under different Kanban card allocations, bottleneck position and processing times, suggested the following results (Lee, 1989):
Pushed production performs better in terms of the total quantity produced, although it presents a large amount of material in process;
As for lead time variation, the Kanban system has less variation, followed by the CONWIP system;
Under large variations in demand, the pulled systems presented better performance, maintaining a controlled level of material in process.
Pettersen and Segerstedt (2009) compared the Kanban and CONWIP systems through the simulation of a production line and obtained the following results:
The CONWIP system has lower transfer rates and time between jobs than the Kanban system.
Both systems have the same average flow of production in the line.
The Kanbam system has less use of physical space for storage than the CONWIP system.
In general, the performance of CONWIP was more satisfactory in this simulation; however, because it is not a widely used technique in the industry, it shows implementation difficulties.
Li et al. (2017) combined lean manufacturing, pull production and CONWIP in a simulation model to evaluate the performance of productive systems. The CONWIP system was used to prefabricate part of the components and after customer request the remainder of the production was pulled. The authors observed that the combination of the systems had fewer queues, less quantity of materials in process, shorter cycle times and lower costs than the fully drawn system.
Onyeocha et al. (2015) proposed comparisons between the combination of Kanban and CONWIP (BK-CONWIP) and Theory of Constraints and CONWIP (HK-CONWIP) systems. According to the authors, the BK-CONWIP shows better results in terms of production efficiency than the HK-CONWIP. They also pointed out that the larger the product mix, the greater the quantity of materials in process in both cases, suggesting that the CONWIP system works best in low variety production systems.
Pulled and pushed production systems are widely used by companies. It is up to them to confront their characteristics to determine the most appropriate way of producing or even adopting a hybrid system which, although more recent, has proved to be efficient in relation to different variables of production systems.
Müller (2003), states that the competitiveness of companies depends on the strategies adopted by them, which must be aligned with their objectives. The performance evaluation aims to measure the state of the system, current and future, in order to generate information that allows analyzing whether the strategies adopted are leading to the fulfillment of the established objectives.
Tubino and Danni (1997), state that the aim of a performance evaluation system is to measure the company seeking to manage its performance in order to achieve certain objectives. According to the authors, measures of performance of production systems are production volume, crossing time, lead time, stock in process, resource utilization rates, and safety margin. Figure 2 presents a performance evaluation system for the productive environment.
Figure 2. Performance evaluation of a production system. Source: The authors.
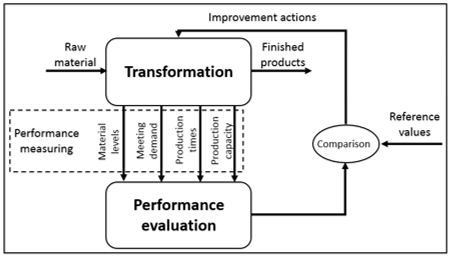
As raw material is transformed into finished product, the indicators are measured to evaluate the performance. The results of the evaluation are compared with reference values, aligned with the company's objectives and, based on the results of this comparison, improvement actions can be proposed for the production, aiming to approximate the measured levels to the reference values.
In order to reach the proposed objective, a case study was used, thus allowing understanding the operation of a specific system to be modeled computationally. The steps adopted were determined by combining the case study methodologies proposed by Miguel (2007) and the computational simulation proposed by Chwif and Medina (2015):
Delineation of the theme and propositions of the research.
Definition of the methods used and the unit of study.
Surveys to collect information about the studied company.
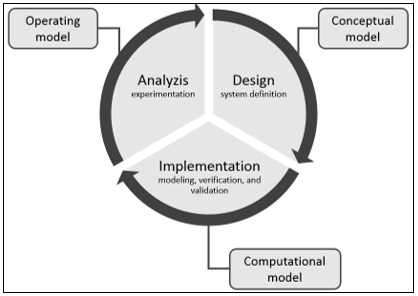
Creation of conceptual, computational and operational models, and also the fictional model that represent the pull, push and hybrid approaches; simulation of different scenarios; and qualitative analysis of the results obtained. This step is illustrated in Figure 3.
Documentation of methods and results enabling a replication structure.
Figure 3. Modeling and simulation process. Source: The authors, adapted from Chwif and Medina (2015).
One way to evaluate the performance of productive systems is through modeling and simulation. According to Wolfsgruber and Lichtenegger (2016) the simulation of different scenarios of a productive system allows evaluating strategies that are not yet physically implemented to consider possible future deployments.
Computer modeling and simulation have been widely used as support for decision making by analyzing the problems encountered in a production environment. Simulation models have the capacity to capture the peculiarities of productive systems, even if they are dynamic and random in nature. They also allow the analysis of different scenarios without interference in the real system (Montevechi et al., 2010).
Simulation also allows the evaluation of the performance of the production system simultaneously to the production, as presented by Reschke and Schuh (2017), allowing solving problems in real time.
The print industry studied in this work is located in the metropolitan region of Curitiba in Paraná, Brazil. Its production is focused mainly on didactic materials, developed by a publisher of the own group, with an annual circulation of around 800,000 didactic units. It has a high degree of variety of products, including customization, but a standardized production process, in which all types of products undergo the same production activities. A part of the products are make-to-stock (MTS) and the rest are assembly-to-order (ATO).
The productive process is divided into a completely pushed step and another step that combines pulled and pushed approaches, as illustrated in Figure 4.
Figure 4. Production process of the print industry under study.
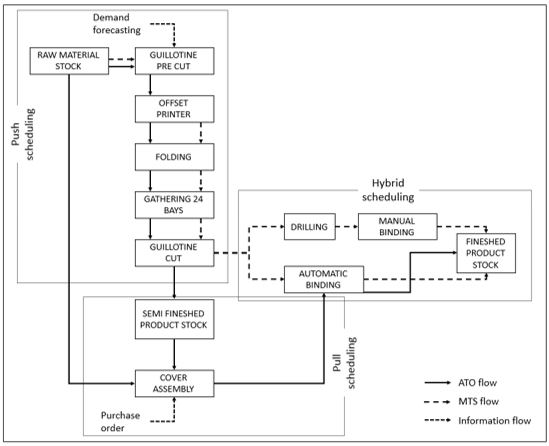
Source: The authors.
The PPC department performs demand forecasting four times a year, based on annual historical sales. The forecast of demand determines the purchase of raw material, the treatment of the graphic arts of the products by the publisher, and the preparation of the printing plates.
In the first production process the paper passes through the pre-cut, which aligns its margins according to the size of the notebook to be printed. It follows to a two-sided printing process. It is necessary to use a printing plate which must be prepared specifically for the product model and can be reused a second time before being discarded.
Afterwards, the paper is folded into notebooks that should compose the textbooks in page order. The notebooks and covers go through the collation that will unite the parts in order. Soon after the ordering, a cut is made in the original size of the textbook, in order to cut the folds of the paper and align the sheets, finishing the completely pushed step of the production.
Some of the products generated until the cutting process have a cover processed simultaneously to the processing of the textbooks and await the next steps in the stock of products in process. The other part of the products awaits the stock of semi-finished products without covers, as these will be customized at the customer's request.
The MTS products follow to manual or automatic binding, according to the size of the batch in production. The ATO products go through a stage of assembly of the cover in the body of the book and are then bound. After the binding, all products are stored in the stock of finished products in specific areas of immediate shipment (ATO) or waiting for customer order (MTS).
The conceptual modeling implies an abstraction of the real productive system, seeking to represent the processes related to the research problem. Some simplifications of the real system were made, such as:
The receipt of raw material is not restrictive to the beginning of the production.
Six production stations are considered in the conceptual model: printing, sheet folding, notebook collation, cutting, cover assembly, and automatic binding.
Three classes of products are considered: textbooks for elementary education, textbooks for high school and didactic material for preschool.
The system has 12 operators and 12 auxiliary employees. 8-hour shifts are considered, 5 days a week.
An ANSI (American National Standards Institute) flowchart of the flow of materials along the production line is shown in Figure 5.
Figure 5. Flowchart of the productive process of the print industry under study.
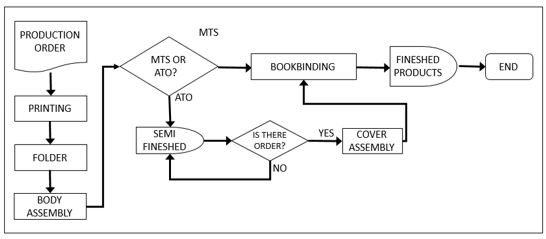
Source: The authors.
From the arrival of the production order, going through the processes of printing, folding and body assembly, the flow follows in line. After the formation of the notebook, there is the first decision point where the material can follow the production, if it is MTS, or to be stocked as a semi-finished product, if it is ATO.
Following the line, the MTS product is bound and stocked in the finished product area. The covers are inserted during the assembly process of the body.
When on hold as semi-finished, the second decision point is necessary, as it determines that the ATO products only follow for cover assembly, binding and storage in the area of finished products when the customers order.
The computational model was implemented using the SIMUL8® software, which meets the modeling needs. Initially, the transformed resources, transformation resources and activities (production processes) of the system were determined. The transformed resources are:
Product 1: production orders of textbooks for basic education;
Product 2: production orders for high school textbooks;
Product 3: production orders for teaching materials for preschool;
Request: customer request that implies a customization of product 3.
The transformation resources are: Printer, Folder, Collation and Guillotine unit, Automatic Binder, Operator and Assistant. The processing activities for products 1, 2 and 3, which compete with the same resources, were determined: Print 1/2/3, Fold 1/2/3, Body Assembly 1/2/3, Automatic Binding 1/2/3.
The average times between the inputs of the production orders and the batch sizes for each type of product were provided by the company. It was assigned an exponential distribution to the orders because it represents the arrival times in the system, since the arrivals have characteristics of high variance and independence between one value and another (Freitas, 2008; Chwif and Medina, 2015).
The printing, folding and automatic binding activities are performed on all types of products and each one has an average processing time and a particular standard deviation.
The assembly of the body activity is different between the types of products. For products 1 and 2 (MTS), the body of the textbook and the cover are assembled together and the entry consists of notebooks and the output of loose textbooks (without binding).
For the product 3 (ATO), only the body of the textbook is assembled and the cover is inserted later. The processing time of the product 3 cover assembly has not been considered since it is an activity that occurs simultaneously to the assembly process of the body.
The averages of the processing times of each activity, as well as the standard deviations, were provided by the company. The processing time considers the total time between the entry of a batch in a process until the output of this complete batch. For all three types of orders, the processing times are distinct because each involves a number of pages and a number of characters and different printed figures. The normal distribution was chosen because it is applicable when the probability of occurrence of values above or below the average is the same and when the total time is the sum of the times of different processes in sequence, both characteristics of the real system. In addition, it is a distribution that best represents manual or partially automated processes, such as the processes of the real system (Freitas, 2008; Chwif and Medina, 2015).
A detailed description of the features and activities, as well as their timing settings (processing and setup), batch size, and resource sharing, can be found in Pinheiro (2016).
The verification of the simulation model was performed using two techniques proposed by Chwif and Medina (2015):
Modular implementation and verification: the model was developed in parts that were simulated individually and added to the final model only after verification of its correct functioning.
Constant or simplified values versus manual calculations: a simulation round was performed with unit values of lots and time of one month. The output values were calculated manually and compared to the values obtained in the Simulation.
To validate the computational model, the techniques proposed by Chwif and Medina (2015) were used:
Validation in black box: A simulation round was performed with the input values defined in the conceptual modeling. The obtained output values were compared with the production registered in the print industry in the two-year period preceding the experiment. With a reliability level of 95%, the output values generated by the model were equivalent to the values measured in the analyzed period.
Sensitivity analysis: Experiments were performed simulating possible occurrences of the real system, such as the increase and decrease of the frequency of the customer orders and reduction of the capacity of the bottleneck resource, and the behavior of the model was similar to what one would expect in the factory.
Face-to-face validation: The company's PPC coordinator was consulted about the results obtained in the experiments and it was verified that they are representative of the occurrences in the real system.
After verifying and validating the proposed model, it can be considered that it has no syntax and/or logic errors and it is a representative model of the real system.
In the operational modeling, scenarios were created to evaluate the performance of the system in relation to the aims of the research, for four models: the real model and three other theoretical models representing the production of the real model in fully pushed, fully pulled or hybrid based on CONWIP production systems, as shown in Figure 6.
Figure 6. Dynamics of simulations for comparative analysis of production systems. Source: The authors.
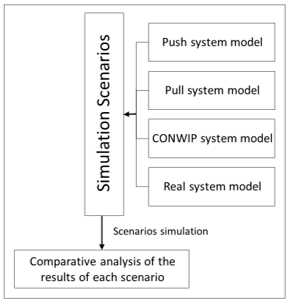
After generation of the three models, the scenarios and performance indicators to be measured were defined. They will allow inferring about the performance of the four proposed systems.
The pushed system was modeled considering the production of the three types of products based on demand forecasting. In the proposed computational model, entities represent the orders of production of the products and all the production follows in line, going through the activities of printing, folding, assembly of the body and binding, until the exits of finished products. All activities can occur as long as they have all the necessary resources available and are within the forecast of demand that follows the input distribution along with the raw materials.
The pulled system was modeled considering the production of the three types of products from the customer order arrival in the system, starting at the last stage of production and requesting materials from the previous stages in succession. The production process begins with the customer's request, which initiates the production of the binding. In order for the binding to occur, it is necessary that, in addition to the customer's request, there is at least one batch of products in process stock. When these two conditions are met, the binding is started and at the end of the activity, it initiates a production order for the previous process of body assembly. The same logic is used until it reaches the printing activity, which needs raw material and production order. The same dynamic happens for the three types of products that, when delivered, feed the stocks of finished products.
The CONWIP system was modeled considering the productions of the three types of products initiated by the customer order arrival in the system, starting from the first stage of production, following the line to the last stage in constant processing batches. Raw materials enter the system by demand forecasting and production is only started from the customer's order. The model differs from pulled because the customer's order goes into the system and all the activities are performed online and differs from the pushed environment because, if there is no order confirmation, the production is not started.
The verification of the theoretical models followed the same procedures adopted for the real system model. For the validation, the calculations presented by Hoop and Spearman (2013) for the pulled, pushed and hybrid (CONWIP) environments were used in each individual process of the models.
After the implementation of the four models, three simulation scenarios were generated:
First scenario: the current conditions of the real system were used in relation to the forecast and confirmation of demand and product mix.
Second scenario: the real system forecast is maintained and a 30% increase in the confirmed demand is proposed, maintaining the proportion of the production mix.
Third scenario, the real system forecast is maintained and a 30% reduction in the confirmed demand is proposed, maintaining the proportion of the production mix.
In order to evaluate the performance of production environments, the following indicators were used:
Average cycle time in the system for the three products;
Average stocks of the three finished products;
WIP levels for the three products at each stage of the process;
Balance of finished products in stock.
The first scenario aims to compare the models of the real system and the pushed, pulled and hybrid environments with demand forecasting and the confirmation in customer orders similar to the actual data of the real system in the four models. The analysis of the simulation results of the first scenario allows stating that:
In the real system model, there was a positive balance of products 1 and 2; however, there was failure in supplying product 3. There was a high quantity of work in process, mainly in raw material and products awaiting body assembly. Cycle times were low.
In the pushed model, the behavior was similar to the real system.
In the pulled model, the demand was perfectly met, not generating balance of any type of product and the cycle time was synchronized with the demand. Work in process was zero.
In the CONWIP model, there was a considerable reduction in demand and cycle times were very high, although all stocks were minimized.
The second scenario aims to compare the models of the real system, as well as the pushed, pulled and hybrid environments, when there is a 30% increase in the confirmed demand. The analysis of the results of the simulation of the second scenario allows stating that:
In the model that represents the real system, it was not possible to meet the demand of any product. Work in process remained low.
In the pushed model, the behavior was similar to the real system.
In the pulled model, there was failure to meet the demand in a product 1lotf; the other products had demands met perfectly. Work in process was zero.
In the CONWIP model, there was failure meeting the demand in all products, and cycle times were very high, even though work in process was low.
The third scenario aims to compare the models of the real system and of the pushed, pulled and hybrid environments, when there is a 30% reduction in confirmed demand. The analysis of the results allows stating that:
In the model that represents the real system, it was not possible to meet the demand for the product 3. The work in process remained low and finished products is high.
In the pushed model, there was a surplus of products 1 and 2, and product 3 had the demand met perfectly.
In the pulled model, the demand was met perfectly, not having failures or surpluses in all the products. Work in process was zero.
In the CONWIP model, there was failure meeting the demand in all products and cycle times were very high, although work in process was minimized.
Chart 1 presents the indicators analyzed through the scenarios developed, the desirable performance for each of them, the results obtained in general, and the production system that obtained the best results for each indicator.
Two indicators related to the finished products were analyzed: stock of finished products in the system at the end of the simulation and balance of products remaining in the system after consumption of the demand at the end of the simulation. It can be concluded that for both indicators the pulled system obtained better performance, since it reached the objective of maintaining low inventories, but, guaranteeing service to the demand.
Regarding work in process (WIP), it is concluded that the best performance is attributed to the CONWIP system, since it kept its WIP stable and smaller than the other models, and is minimal for some products.
Table 1. Results of performance indicators
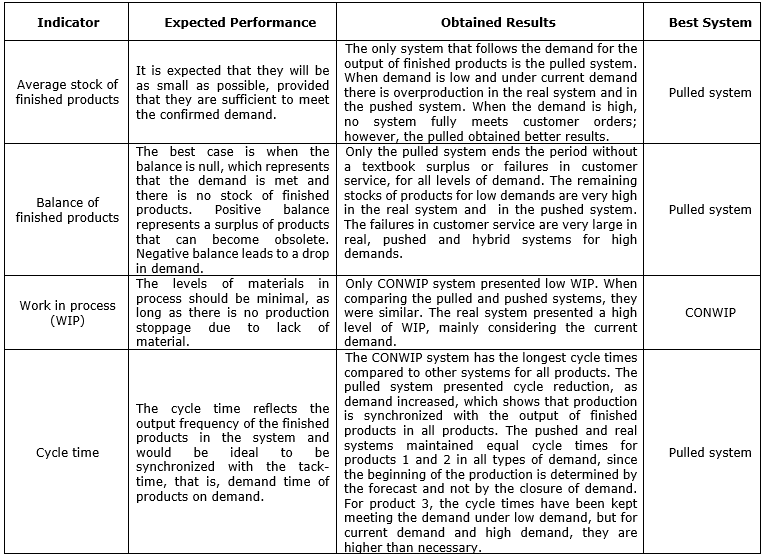
Source: The authors.
The cycle time was the last indicator analyzed and the pulled system obtained the best performance, since it presented cycle times synchronized with the tack time, showing that the production follows the evolution of the demand. However, it is important to emphasize that, in cases of low demands, there may be idleness in productive resources and in cases of high demand there may be an overload in their use.
One constraint that can be attributed to the pulled production system is that, because the production batches are smaller than the economic one, and the print array can only be reused twice, it would have to be replaced every two batches of the same product. This would imply an additional cost to the production that would have to be faced with the cost of the stock of materials in process and finished products and the cost of the products that are lost by obsolescence in the stock of finished products, since periodically the materials undergo didactic changes. Another issue raised about the use of the pulled production system is that it could also affect the setup times, since, in production, the order of passage of the different models in the production line is determined by the customer's request of similar models.
The objective of this work was to propose a comparative analysis of a production environment, through the evaluation of the scheduling approaches of pulled, pushed and hybrid production, in different scenarios, through computer simulation.
A study was carried out in a print industry, leading to the construction of the conceptual model that represented the real production environment. Through the conceptual model, a computational model was generated, using the simulation software SIMUL8®.
Three models representing pulled, pushed, and CONWIP approaches were generated, which allows evaluating the performance of the different environments in three simulation scenarios.
Through simulation of the scenarios, it is possible to conclude that the pulled system model obtained the best performance regarding the finished product inventory levels, year-end remaining product balance and cycle times. Regarding the work in process, the CONWIP system obtained the best performance.
However, although the CONWIP system has obtained excellent results for work in process, which represents a great economy for the production, it is not always the best choice, since it presents non-meeting demand.
For the real system, currently installed in the print industry, the simulation allowed confirming the characteristics detected in the field research: high levels of work in process and finished products, and high non-meeting demand.
The work was limited to analysis of a single print industry, through the case study, and the replicability of the results is considered applicable only to other similar industries, not to the whole sector. Thus, a proposal of future work would be to extend the analysis to other print industries, aiming to obtain results applicable to the print sector.
Another proposal for future work is to estimate the costs of printing matrices, inventories of products in process and finished products, as well as a survey of the amount of materials lost due to obsolescence.
Bonney, M. C., Zhang, Z., Head, M. A. et al. (1999), “Are push and pull systems really so different?”, International Journal of Production Economics, Vol. 59, No. 1, pp. 53-64. DOI: 10.1016/S0925-5273(98)00094-2.
Bonvik, A. M., Couch, C. E., and Gershwin, S. B. (1997), “A comparison of production-line control mechanisms”, International journal of production research, Vol. 35, No. 3, pp. 789-804. DOI: 10.1080/002075497195713.
Buzacott, J. A., and Shanthikumar, J. G. (1992), “A general Approach for coordinating production in multiple-cell manufacturing systems”, Production and Operations Management, Vol. 1, No. 1, pp. 34-52. DOI 10.1111/j.1937-5956.1992.tb00338.x.
Carvalho, E. R., Mota, A. E. A. S., Martins, G. M. S. et al. (2017), “The current context of Lean and Six Sigma Logistics applications in literature: A Systematic Review”, Brazilian Journal of Operations & Production Management, Vol. 14, No. 4, pp. 586-602. DOI: 10.14488/BJOPM.2017.v14.n4.a14.
Chwif, L., and Medina, A. C. C. (2015), Modelagem e simulação de eventos discretos, Elsevier, Rio de Janeiro.
Dallasega, P., and Rauch, E. (2017), “Sustainable Construction Supply Chains through Synchronized Production Planning and Control in Engineer-to-Order Enterprises”, Sustainability, Vol. 9, No. 10, 1888. DOI: 10.3390/su9101888.
Di Mascolo, M. (1996), “Analysis of a synchronization station for the performance evaluation of a kanban system with a general arrival process of demands”, European Journal of Operational Research, Vol. 89, No. 1, pp. 147-163. DOI: 10.1016/S0377-2217(96)90066-1.
Di Mascolo, M. D., Frein, Y., and Dallery, Y. (1996), “An analytical method for performance evaluation of kanban controlled production systems”, Operations Research, Vol. 44, No. 1, pp. 50-64. DOI: 10.1287/opre.44.1.50.
Duenyas, I., and Hopp, W. J. (1990), “Estimating variance of output from cyclic exponential queueing systems”, Queueing Systems, Vol. 7, No. 3-4, pp. 337-353.
Duenyas, I., Hopp, W. J., and Spearman, M. L. (1993), “Characterizing the output process of a CONWIP line with deterministic processing and random outages”, Management Science, Vol. 39, No. 8, pp. 975-988. DOI: 10.1287/mnsc.39.8.975.
Duri, C., Frein, Y., and Di Mascolo, M. (2000), “Comparison among three pull control policies: kanban, base stock, and generalized kanban”, Annals of Operations Research, Vol. 93, No. 1-4, pp. 41-69.
Freitas Filho, P. J. (2008), Introdução à modelagem e simulação de sistemas: com aplicações em Arena, Visual Books, Florianópolis.
Geraghty, J., and Heavey, C. (2003), “A comparison of hybrid push/pull and CONWIP/pull production inventory control policies”, International Journal of Production Economics, Vol. 91, No. 1, pp. 75-90. DOI: 10.1016/S0925-5273(03)00210-X.
Gong, Q., Yang, Y., and Wang, S. (2014), “Information and decision-making delays in MRP, KANBAN, and CONWIP”, International Journal of Production Economics, Vol. 156, pp. 208-213. DOI: 10.1016/j.ijpe.2014.06.010.
Gstettner, S., and Khun, H. (1996), “Analysis of production control systems Kanban and CONWIP”, International Journal of Production Research, Vol. 34, pp. 3253-3273.
Güçdemir, H., and Selim, H. (2017), “Customer centric production planning and control in job shops: A simulation optimization approach”, Journal of Manufacturing Systems, Vol. 43, pp. 100-116. DOI: 10.1016/j.jmsy.2017.02.004.
Hoose, A., Consalter, L. A., and Durán, O. M. (2016), “Implementación de un Sistema Híbrido Tipo Trabajo Constante en Progreso (CONWIP) para Control de Producción en una Industria de Implementos Agrícolas”, Información Tecnológica, Vol. 27, No. 2, pp. 111-120. DOI: 10.4067/S0718-07642016000200014.
Hopp, W. J.; Spearman, M. L. (2013), A ciência da fábrica, Bookman.
Huang, M., Wang, D., and Ip, W. H. (1998), “A simulation and comparative study of the CONWIP, Kanban and MRP production control systems in a cold rolling plant”, Production Planning & Control, Vol. 9, No. 8, pp. 803-812. DOI: 10.1080/095372898233579.
Krishnamurthy, A., Suri, R., and Vernon, M. (2004), “Re-examining the performance of MRP and Kanban material control strategies for multi-product flexible manufacturing systems”, International Journal of Flexible Manufacturing Systems, Vol. 16, No. 2, pp. 123-150.
Lee, L. C. (1989), “A Comparative Study of the Push and Pull Production Systems”, International Journal of Operations and Production Management, Vol. 9, No. 4, pp. 5-18. DOI: 10.1108/EUM0000000001233.
Leonardo, D. G., Sereno, B., Silva, D. S. A. D. et al. (2017), “Implementation of hybrid Kanban-CONWIP system: a case study”, Journal of Manufacturing Technology Management, Vol. 28, No. 6, pp. 714-736. DOI: 10.1108/JMTM-03-2016-0043.
Li, X., Li, Z., and Wu, G. (2017), “Lean precast production system based on the CONWIP method”, KSCE Journal of Civil Engineering, pp. 1-11. DOI: 10.1007/s12205-017-2009-4.
Miguel, P. A. C. (2007), “Estudo de caso na engenharia de produção: estruturação e recomendações para sua condução”, Revista Produção, Vol. 17, No. 1, pp. 216-229.
Montevechi, J. A. B., Costa, R. F. S., Leal, F. et al. (2010), “Economic Evaluation of Scenarios for Manufacturing Systems Using Discrete Event Simulation Based Experiments”, Brazilian Journal of Operations & Production Management, Vol. 7, No. 1, pp. 77-103.
Moreira D. (2008), Administração da Produção e Operações, Saraiva, São Paulo.
Müller, C. J. (2003), “Modelo de gestão integrando planejamento estratégico, sistemas de avaliação de desempenho e gerenciamento de processos”, PhD diss., Federal University of Rio Grande do Sul.
Ohno, T. (1997), O Sistema Toyota de Produção: além da produção em larga escala, Bookman, Porto Alegre.
Onyeocha, C. E., Wang, J., Khoury, J. et al. (2015), “A comparison of HK-CONWIP and BK-CONWIP control strategies in a multi-product manufacturing system”, Operations Research Perspectives, Vol. 2, pp. 137-149. DOI: 10.1016/j.orp.2015.07.001.
Park, C. W., and Lee, H. S. (2013), “Performance evaluation of a multi-product CONWIP assembly system with correlated external demands”, International Journal of Production Economics, Vol. 144, No. 1, pp. 334-344. DOI: 10.1016/j.ijpe.2013.02.021.
Pereira, C. M., Anholon, R., and Batocchio, A. (2017), “Obstacles and difficulties implementing the lean philosophy in Brazilian enterprises”, Brazilian Journal of Operations & Production Management, Vol. 14, No. 2, pp. 218-227. DOI: 10.14488/BJOPM.2017.v14.n2.a10.
Pettersen, J. A., and Segerstedt, A. (2009), “Restricted work-in-process: A study of differences between Kanban and CONWIP”, International Journal of Production Economics, Vol. 118, No. 1, pp. 199-207. DOI: 10.1016/j.ijpe.2008.08.043.
Pinheiro, N. M. G. (2016), “Avaliação de desempenho da produção puxada, empurrada e híbrida através de modelo de simulação: um estudo de caso em indústria gráfica”, MSc diss., Federal University of Paraná.
Reschke, J., and Schuh, G. (2017), “Scheduling parameters in Production Planning and Control”, Systemics, Cybernetics and Informatic, Vol. 15, No. 1, pp. 62-66.
Roderick, L. M., Toland, J., and Rodriguez, F. P. (1994), “A simulation study of CONWIP versus MRP at Westinghouse”, Computers & Industrial Engineering, Vol. 26, No. 2, pp. 237-242. DOI: 10.1016/0360-8352(94)90058-2.
Spearman, M. L., and Zazanis, M. A. (1992), “Push and Pull Production Systems: Issues and Comparisons”, Operations Research, Vol. 40, No. 3, pp. 521-532.
Spearman, M. L., Woodruff, D. L., and Hopp, W. J. (1990), “CONWIP: a pull alternative to kanban”, The International Journal of Production Research, Vol. 28, No. 5, pp. 879-894.
Takahashi, K., and Hirotani, D. (2005), “Comparing CONWIP, synchronized CONWIP, and Kanban in complex supply chains”, International Journal of Production Economics, Vol. 93, pp. 25-40. DOI: 10.1016/j.ijpe.2004.06.003.
Tubino, D. F, and Danni, T. S. (1997), “Uma proposta de sistema de avaliação operacional no ambiente JIT”, Máquinas e Metais, Vol. 378, pp.120–130.
Vollman, E.T. Berry, W. L., Whybark, D. C. et al. (2006), Sistema de Planejamento & Controle da Produção para o Gerenciamento da Cadeia de Suprimentos, Bookman, Porto Alegre.
Wolfsgruber, C., and Lichtenegger, G. (2016), “Optimal Configuration in Production Planning and Control”, BHM Berg-und Hüttenmännische Monatshefte, Vol. 161, No. 5, pp. 221-224. DOI: 10.1007/s00501-016-0474-6.
Received: 01 Nov 2018
Approved: 13 Feb 2019
DOI: 10.14488/BJOPM.2019.v16.n4.a13
How to cite: Pinheiro, N. M. G.; Cleto, M. G.; Zattar, I. C. et al. (2019), “Performance evaluation of pulled, pushed and hybrid production through simulation: a case study”, Brazilian Journal of Operations & Production Management, Vol. 16, No. 4, pp. 685-697, available from: https://bjopm.emnuvens.com.br/bjopm/article/view/621 (access year month day).