Computational simulation applied in choosing the best solution in a product development using design for manufacturing and assembly approach
Nathália Marcia Goulart Pinheiro
nath.mgp@gmail.com
University of Campinas – UNICAMP, Campinas, São Paulo, Brazil
Robert Eduardo Cooper Ordoñez
cooper@fem.unicamp.br
University of Campinas – UNICAMP, Campinas, São Paulo, Brazil
Gustavo Lemes Leite Barbosa
pregustavomium@gmail.com
University of Campinas – UNICAMP, Campinas, São Paulo, Brazil
Franco Giuseppe Dedini
dedini@fem.unicamp.br
University of Campinas – UNICAMP, Campinas, São Paulo, Brazil
ABSTRACT
Highlights: The product development methodology aims to assist the planning and design of the product throughout its life cycle. Using selection criteria it is possible to choose a solution will be followed until the end of the development process and this process is known as optimization of product solutions. Design for Manufacturing and Assembly (DFMA) is an approach that allows selecting a product solution with better manufacturing and assembly performance. Computational modeling allows representing systems in virtual environment in order to reproduce its characteristics and to compare scenarios through simulation.
Goal: The objective of this work was to apply the computer simulation to compare the productive performance, according to production times, productivity and resource utilization rate, of three solutions proposed for a raincoat for pets with thermal protection.
Methodology: Initially, conceptual models representing the production systems for the three product solutions were generated. The systems were modeled in discrete event simulation software, enabling different scenarios testing, resulting in production performance indicators for each product solution.
Results: The analysis of the performance indicators allow identifying that the third solution proposed for the product obtained the best productive performance in all proposed scenarios; therefore, it was chosen as the best solution for the product according to the DFMA approach.
Limitations of the investigation: The application of the methodology indicated in this work was limited to the study of a single productive system of a specific product.
Practical implications: This work presents a practical application of computer simulation tools applied to product development.
Originality / Value: The original contribution of this work is the application of computational simulation of production systems in product development following the DFMA approach.
Keywords: Product Design; DFMA; Computational Modeling; and Simulation.
1 INTRODUCTION
The product development methodology aims to assist the planning and design of the product throughout its life cycle. Once a market need is identified, several possible solutions are proposed to solve it. The Design for Manufacturing and Assembly (DFMA) makes it possible to adapt product design to manufacturing and assembly, optimizing the performance of the manufacturing system (Back et al., 2008).
Modeling and computational simulations, according to Chwif and Medina (2015), allow analyzing scenarios and understanding relations without interfering in the real system, and are used to evaluate the performance of productive systems through indicators.
In this context, and aiming to find an alternative to develop an innovative product, a research was conducted on consumer markets, more specifically, in the pet market, which is a fast growing market, as presented by Exame magazine (2016). The research was restricted to the Brazillian city of Curitiba. According to the Brazilian National Institute of Meteorology (Instituto Nacional de Meteorologia – INMT) (2018) the city has low temperatures and high volume of rainfall throughout the year. In order to develop a product that meets the requirements of sustainable design, a market research was conducted. This research considered the reutilization of materials, recycling, and usage of materials that may represent an environmental threat to postpone the end of its useful life.
Based on the given factors, a product was designed to be made out of a recyclable material and the goal of the designed product was to provide greater comfort for pets in their walks on cold and rainy days. The conceptual product was a low cost raincoat with thermal protection. Research was conducted to determine the target market and the money expenditure regarding the willingness of possible consumers in this targeted market. The conclusion was that prices could not be high and, therefore, the cost of production should be reduced.
To compose the raincoat three alternatives were proposed, each with a different productive process. The three proposed solutions meet all the needs of reduction of environmental impacts.
The objective of this work is to compare the productive performance of the three proposed alternatives through computational modeling and simulation, generating information to enable the choice of the best solution according to the DFMA approach.
2 THEORETICAL FRAMEWORK
Rozenfeld et al. (2006) defined the development of products as the activities that begin with the identification of market needs, which are transformed into project specifications, and from these activities are determined the development of a product, its production process, and methods of follow-up in the market.
Back et al. (2008) defined development process optimization as the choice of a solution that can better meet the requirements of the product. Design for X (DFX) is an optimization tool that accompanies all stages of product development, adapting it to factors that lead to the optimal solution according to an attribute represented by variable X. This tool can be used to filter solutions that meet the requirements of the product (Rozenfeld et al., 2006).
Design for Manufacturing and Assembly (DFMA) is one of the DFX approaches that proposes the reduction and/or modularization of product components, facilitating their manufacture and assembly, resulting in lower raw material cost and reduction of production times (Rozenfeld et al., 2006; Back et al., 2008).
According Boothroyd et al. (2000) DFMA emerged from the joint application of Design for Assembly (DFA), and proposes methods to simplify products and Design for Manufacturing (DFM), thus aiming to minimize production costs.
The DFA approach provides guidelines for reducing the processing time in assembling the parts of a product through its structural simplification (Boothroyd et al., 2000).
Back et al. (2008) described DFA as an approach that allows reducing assembly costs through the design of modular parts. According to the authors, some of the objectives of DFA are: product simplification and reduction of the number of components; standardization of materials, components and activities; use of common parts; design of parts to facilitate assembly; project of efficient union; and fixation between parts.
Dowtatshahi (1994) defines DFM as the guidelines for standardizing product design, aiming the reduction of the total cost of production while maintaining the quality required by customers. The objectives of DFM, according to Back et al. (2008), are: making product manufacturing easier; quality of the final product; better utilization of manufacturing resources; reduction of costs, times and quantities of work in process.
Some examples of DFMA applications can be found in the papers presented by Emmatty and Sarmah (2011). These authors have applied DFMA in the development of mechanisms for clocks, concluding that the tool allows reducing the manufacturing cost of the product and the times of production. Barbosa and Carvalho (2013) proposed the application of DFMA to design an aircraft, concluding that it was efficient. The application of the methodology must be considered since the initial phases of the project. Prakash et al. (2014) proposed the application of DFMA and rapid prototyping for the development of new products. Tasalloti et al. (2015) proposed the application of DFMA with Product Data Management (PDM) to develop products for welding operations. Favi et al. (2016) suggested that DFMA can be used for decision-making along with product development as a selection criterion. Harlalka et al. (2016) applied DFMA to design a food processor reengineering, obtaining improvements in product architecture, cost reduction, and manufacturing times.
As for modeling and simulation, according to Montevechi et al. (2010), these have been widely used for decision making in organizations since they allow systems analysis that do not yet exist, generating useful information for future application decisions.
Freitas Filho (2008), asserted that simulation comprises the representation of a system in a computational model, allowing the evaluation of its performance in different scenarios with the objectives of describing the behavior of the system, constructing theories and hypotheses, considering observations that have been made, and using a model to predict the effects produced by the methods employed in its operation.
According to Chwif and Medina (2015), modeling and simulation allow representing the cause and effect relationships of a system permitting information generation about these relationships. In this way, modeling and simulation must be used to represent real systems without inner interferences or to represent systems that do not yet exist, aiming at a future application. The modeling and simulation methodology, proposed by the authors in this document, is composed of three stages: conception, implementation, and experimentation of the proposed scenarios.
The performance evaluation of a system has as objective of measuring its current and/or future state, generating information to verify whether the strategies adopted have met the objectives established through system performance indicators (Müller et al., 2003).
Hopp and Spearman (2013) and Tubino (2015) defined some production system performance indicators:
i. Lead time is the time spent by the system in transforming raw materials into finished products.
ii. Tack time represents the production rate, that is, the time between outputs of finished products on the production line.
iii. Productivity is the average of units of finished products per unit time.
iv. Utilization rate (U) of a resource is the fraction of time that the resource is not idle because of the lack of items to process.
v. Bottleneck resource is one whose process has the longest processing time in the line.
Kim (2000) presented the following items as system performance measures: inventory values of materials, work in process and finished products units, level of service to the demand, productive times, and total production capacity.
3 MODELING AND SIMULATION APPLICATION
In order to develop this work, the modeling and simulation methodology proposed by Chwif and Medina (2015) was adopted. The methodology is composed of three stages as follows:
i. In the conception stage, the problem is determined and information about the system is collected, to create a conceptual model.
ii. In the implementation stage the conceptual model is used to generate a computational model that will be used in simulations and experiments.
iii. In the last stage, through the experimentation of different scenarios, the results are analyzed and inferences are made about the system, identifying the best solutions according to the proposed objective.
In the study developed by the authors of this paper, a research was conducted to determine the target market and the willingness for spending money of possible consumers in the targeted market. The conclusion was that prices could not be too high and therefore the cost of production should be reduced.
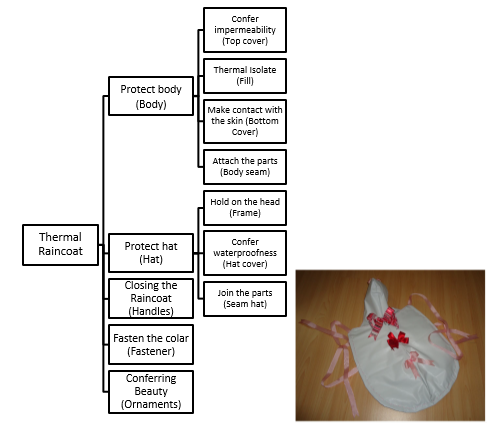
Through market research desirable characteristics for the product have been raised, pointing out that quality and price are fundamental. A benchmarking with similar products from other companies and interviews with potential clients was executed to determine the functional requirements. A value analysis was performed through the Mudge Diagram and the Cost-Importance relation of the functionalities of the final product. These methodologies have determined the desired functionalities for the product: impermeability, thermal insulation, head protection, comfort when in contact with the animal's body, safe and convenient to use clasp, collar fastener, and good appearance.
Three solutions were determined for a product whose scope was already defined, considering different manufacturing processes for each one.
Once the desired functionalities were determined, the concept of the product, shown in Figure 1, was created through a functional tree diagram.
To develop the conceptual model, some considerations have been made. These considerations imply in an abstraction of the system:
-
Production scheduling in all three models is pushed through demand forecasting that defines the amount of raw material input to the system.
-
Times of internal movement were disregarded.
-
The times of each process were measured from three samples. Their probability distributions were theoretically inferred according to the type of process.
-
All processes could only be started if their transformation and transformed resources were available at the beginning of the process.
-
Assembly, seam and trim operations are carried out on the same workstation by the same operators.
-
Setup times were not considered due to process characteristics.
-
Each workstation had dedicated operators.
-
The shifts are 4 hours a day, 5 days a week.
Figure 1. Raincoat concept with thermal insulation - functional tree and prototype. Source: The authors.
The necessary activities for the three possible product alternatives are described in Table 1. These activities have to be carried out in a predefined sequence and, to start each one, it is necessary that the pertinent resources are available.
Table 1. Productive processes for each component/function of the three raincoat alternatives
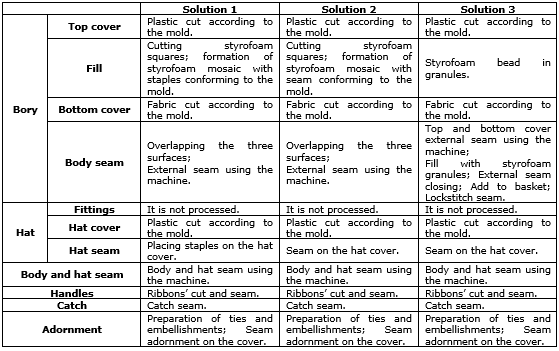
Source: The authors.
Chwif and Medina (2015) describe the Activity Cycle Diagram (ACD) as a modeling tool that allows representing the interaction between objects in a system and the creation of a conceptual model. In an ACD, each entity in the system has a life cycle, in which it rows through queues and activities alternately. The activities are different for each product solution, according to the ACDs presented in Figure 2.
Modeling through ACDs made possible to conceptualize the production system of each solution, showing the processes, resources and sequence followed by each entity in the model. Using the logic presented in the ACDs, the computational models were generated for the three solutions and they are shown in Figure 3.
Figure 2. ACDs representing the manufacturing processes of the three solutions proposed for the product.
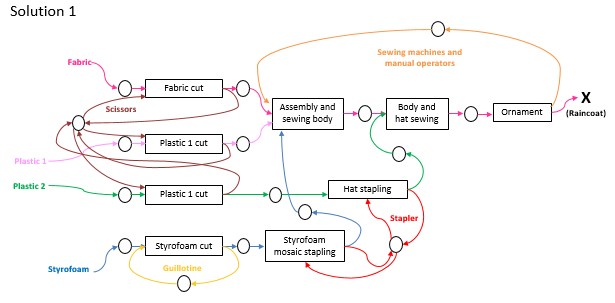
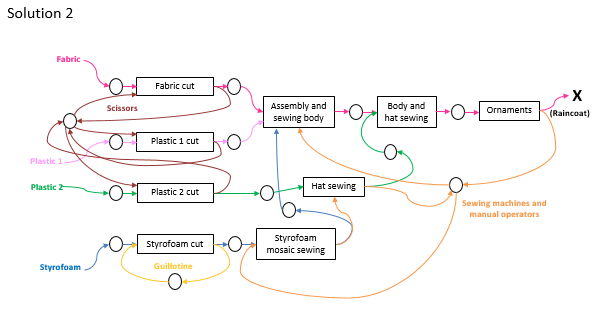
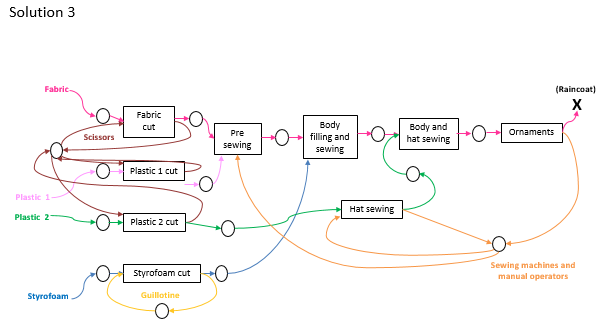
Source: The authors.
Three models representing the production systems were developed, each of these representing one of the proposed solutions. Under the same initial conditions and in different scenarios these models were simulated and confronted against each other allowing a performance evaluation.
Figure 3. Computational models representing the manufacturing processes of the three solutions proposed for the product.
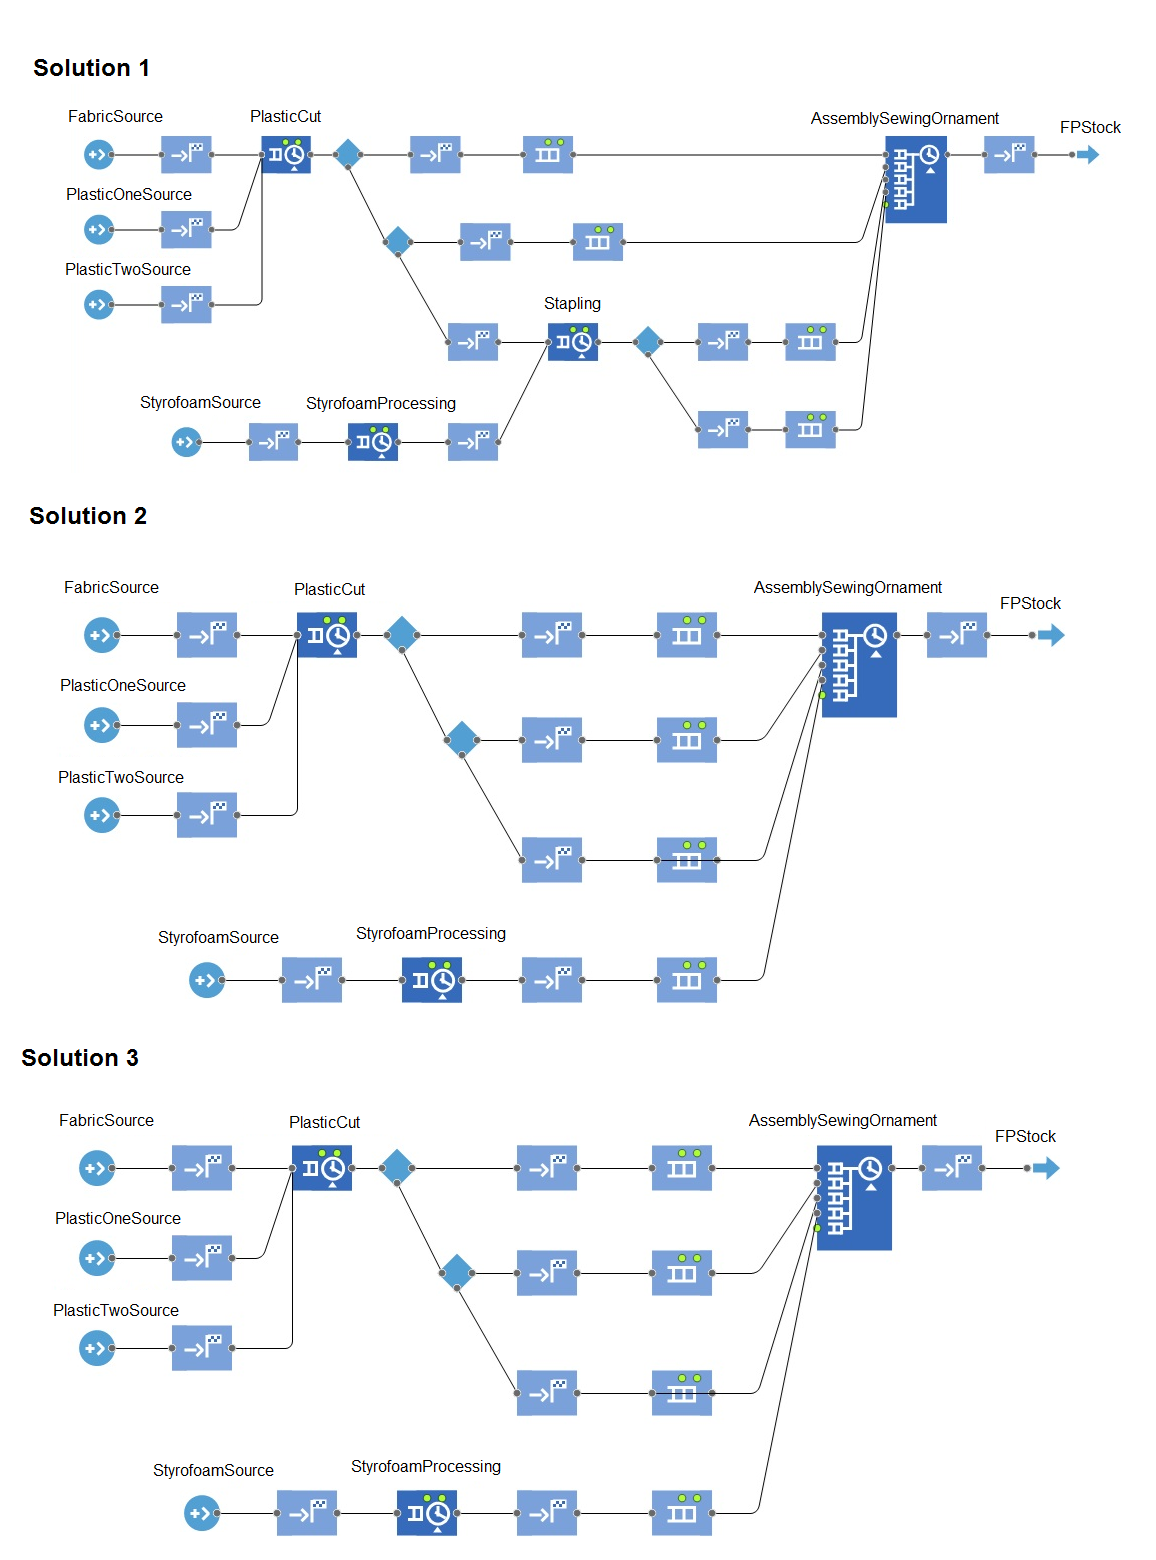
Source: The authors
For the three solutions, five agents were created for the transformed resources, as presented in Table 2.
Table 2. Resources transformed of the computational model for solutions 1, 2, and 3.
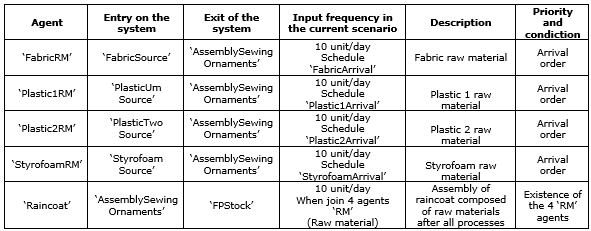
Source: The authors.
Agents that start with the 'RM' prefix represent the inputs of raw material in the system. Each of them with its own schedule of entry with times defined to meet the demand. The raw material agents follow through the system, going through the pertinent activities. The assembling activity covers are assembled to form the fifth agent that represents the finished raincoat. This agent is created when the assembly activity of the cover begins, which only occurs after the arrival of at least one agent of each type of raw material. At the end of the process, this final agent is stored in a stock of finished products.
In the computational models, four agents were created to represent transformation resources, as presented in Table 3. The transformation resources are associated with the activities that use them. The work shifts of operators and machines are defined by a schedule. Preventive maintenance times in the sewing were estimated machine with the parameters and probability distributions recommended by the software.
Table 3. Transformation resources in the computational model of solutions 1, 2, and 3
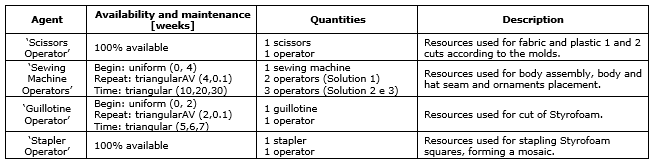
Source: The authors.
In the computational models of solutions 1, 2 and 3 activities were created to represent the productive process, as shown in Table 4. These activities are represented separately for each solution because they have different processing times.
A normal probability distribution was adopted for all activities since each time estimate of the processes is the sum of the times of its activities and, according to Chwif and Medina (2015), the normal distribution is the one that best represents these cases. The time means and standard deviations were calculated through three measurements performed during the prototype fabrication tests of the solutions.
The activities of the computational model begin when the resources demanded are all available and closed, which represents reaching time of the process.
Table 4. Activities of the computational model for solutions 1, 2 and 3
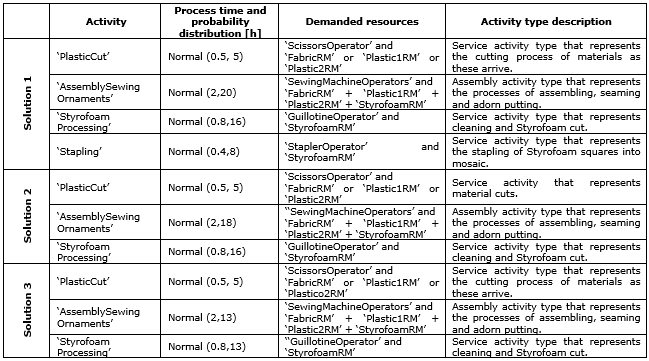
Source: The authors.
Two techniques proposed by Chwif and Medina (2015) were used to verify the computational models:
i. Modular implementation and verification: the model was developed in modules that were individually simulated and aggregated to the final model only after its verification.
ii. Constant or simplified values versus manual calculations: a simulation with reduced time was generated. The values related to the quantity of finished products, demand and lead time were calculated manually and checked with the values obtained in the simulation, verifying the correct functioning of the model.
In the operational model, simulation scenarios were determined, as well as performance indicators and analyzed variables. The simulation clock configuration mode and the number of responses were also determined.
Two scenarios were determined:
i. Current scenario: In the current scenario it is considered that the demand forecast in market research for the sale of 200 raincoats per month at local handicraft fairs on weekends. This demand foresees a partial occupation of resources allowing quantity expansions without investment in new resources.
ii. Future scenario: In the future scenario, the sale of raincoats extends to stores that are located near to the production, in addition to handicraft fairs. In this new scenario a demand of 260 raincoats per month is intended to be met.
Average occupancy and productivity are automatically displayed by the software at the end of each replication. Lead time and takt time were measured through variables implemented exclusively for measurement.
The simulation started in steady state, with daily shifts of four hours, which is the current time dedicated to production, the shifts start at 08:00 in the morning and close at 12:00 o'clock, five days a week. The total simulation time has been set for one month. The replications number was defined using the method proposed by Chwif and Medina (2015), indicating that for a level of 95% confidence and accuracy of 0.5, 19 replications were required.
4 RESULTS
The results obtained for the performance indicators in the current and future scenarios, of the simulation with 19 replications, are presented in Table 5.
The experiments carried out in the two proposed scenarios converged to similar results, allowing some inferences about the productive systems of the three solutions:
a) Solution 3 presents the lowest average lead time and higher productivity in both scenarios.
b) Solution 1 presents the highest lead time and lowest productivity in both scenarios.
c) Solution 2 presents an intermediate lead time between the three solutions.
d) Takt time follows the demand in the three solutions of the two proposed scenarios, confirming that in all cases the demand was met.
e) Solutions 1 and 2 present the sewing machine as a bottleneck resource in the two proposed scenarios, while in solution 3 the bottleneck resource was the scissors.
f) No solution has a resource utilization rate above 80% for the current demand scenario; however, in the future demand scenario, the solutions 1 and 2 have all the resources with an occupancy rate of more than 80%. Solution 3 has occupancy rate of more than 80% only for the bottleneck resource, even in the future scenario.
Table 5. Simulation results for the current (S1) and future (S2) scenarios of solutions 1, 2 and 3. R1 is the scissors, R2 is the sewing machine, R3 is the guillotine, and R4 is the stapler used only on solution 1.
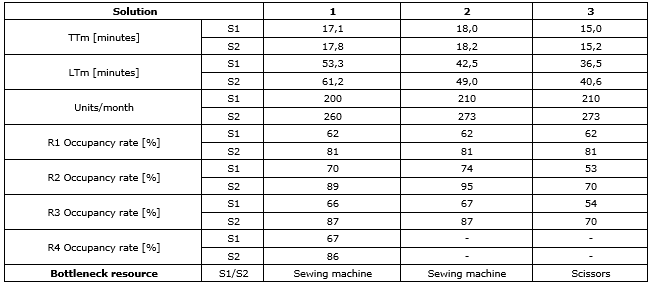
Source: The authors.
In the three solutions, the results obtained considered the usage of five workers, which means, in terms of human resources, investment where the three solutions are equivalent. As for the machinery resources, solution 1 presents greater initial investment since it needs a stapler besides the same resources of the other two solutions.
5 CONCLUSIONS
This work aimed to apply the computational simulation to compare the productive performance of three solutions proposed for a product raincoat with thermal protection. From the inferences presented in the results, it can be concluded that the best solution for the product, according to DFMA, is solution 3 because it has the following characteristics: shorter lead time and takt time synchronized with demand; higher productivity, that is, greater quantity produced per unit of time; lower resource utilization rates; lower cost bottleneck resource, and it may be considered to acquire a second unit in case of increased demand with less investment.
The solution that presented the best productive performance in the proposed experiments has some characteristics, when compared with the other solutions that meet some of the objectives of the DFMA defined in the literature:
i. Smaller number of product components – does not have Styrofoam mosaic, only granules to fill the raincoat;
ii. Standardization of materials and activities – does not use staplers or metal staples, just seam and thread;
iii. Design of parts that facilitate assembly – the making of the Styrofoam mosaic proved to be more costly than the filling with granules;
iv. Bonding and fixation between parts design efficient – the junction of the body parts of the raincoat is more efficient;
v. Better utilization of manufacturing resources – lower resource utilization rates and bottleneck resource less expensive;
vi. Reduction of production times - lower lead time.
This work evidenced that it is possible to identify the best solution for a product, among some alternatives, according to the production performance, using computational modeling and simulation.
In a previous work, in which a market research was carried out to determine the concept of the product, the three solutions confronted in this work were determined. Although all of them were designed to meet the reduction of environmental and social impacts, working with recycled and reused materials, and proposing income generation for artisan cooperatives in the city of Curitiba, the best alternative, considering Design for Sustainability (DFS), was solution 1. The result obtained in the two studies allows concluding that the DFX can compete with each other, making it necessary to establish priority criteria to determine the best solution, although the results of the individual analysis, according to a specific DFX, point to an optimal solution in relation to its requirements.
As a proposal for future work it is suggested to extend the research to other productive systems to verify the applicability of modeling and simulation of systems in the optimization of product development projects and also to other DFX associated to productive systems, such as Design for Lean (DFL) and Design for Six Sigma (DFSS).
REFERENCES
Back, N.; Ogliari, A.; Dias, A.; Silva, J.D. (2008), Projeto integrado de produtos: planejamento, concepção e modelagem, Malone, Barueri, SP.
Barbosa, G. F.; Carvalho, J. (2013), “Design for Manufacturing and Assembly methodology applied to aircrafts design and manufacturing”, IFAC Proceedings Volumes, Vol. 46, No. 7, pp. 116-121, 2013, available from https://doi.org/10.3182/20130522-3-BR-4036.00044 (Access: July 2018).
Boothroyd, G.; Dewhurst, P.; Knight, W. A. (2000), Product Design for Manufacture and Assembly, Marcel Dekker, NY.
Chwif, L.; Medina, A. (2015), Modelagem e simulação de eventos discretos, 4 ed., Teoria e aplicações, Elsevier Brasil.
Dowlatshahi, S. (1994), “A comparison of approaches to concurrent engineering”, The International Journal of Advanced Manufacturing Technology, Vol. 9, No. 2, pp. 106-113, available from https://doi.org/10.1007/BF01750417 (Access: July 2018).
Emmatty, F. J.; Sarmah, S. P. (2012), “Modular product development through platform-based design and DFMA”, Journal of Engineering Design, Vol. 23, No. 9, pp. 696-714, available from https://doi.org/10.1080/09544828.2011.653330 (Access: July 2018).
Exame (2016), Mercado pet cresce graças a mudanças no comportamento dos donos de animais de estimação, available from: https://exame.abril.com.br/carreira/mercado-pet-cresce-gracas-a-mudancas-no-comportamento-dos-donos-de-animais-de-estimacao/ (Access: April 2018).
Favi, C.; Germani, M.; Mandolini, M. (2016), “Design for manufacturing and assembly vs. design to cost: toward a multi-objective approach for decision-making strategies during conceptual design of complex products”, Procedia CIRP, Vol. 50, pp. 275-280, available from https://doi.org/100.1016/j.procir.2016.04.190 (Acess: July 2018).
Freitas Filho, P. J. (2008), Introdução à modelagem e simulação de sistemas: com aplicações em Arena. 2 ed., Visual Books, Florianópolis.
Harlalka, A. et al. (2016), “Redesign of an in-market food processor for manufacturing cost reduction using DFMA methodology”, Production & Manufacturing Research, Vol. 4, No. 1, pp. 209-227, available from https://doi.org/10.1080/21693277.2016.1261052 (Access: Jult 2018).
Hopp, W. J.; Spearman, M. L. (2013), A ciência da fábrica, 3 ed., Bookman. Instituto Nacional de Meteorologia – INMT (2018), available from http://www.inmet.gov.br/portal/ (Access: June 2018).
Kim, I. (2000), “Asynchronous Waste: An Alternative Performance for Pull Production Control Systems”, International Journal of Management Science, Vol. 6, No. 1.
Montevechi, J. A. B.; Costa, R. F. S.; Leal, F.; Pinho, A. F. (2010), “Economic Evaluation of Scenarios for Manufacturing Systems Using Discrete Event Simulation Based Experiments”, Brazilian Journal of Operations & Production Management, Vol. 7, pp. 77-103, available from https://bjopm.emnuvens.com.br/bjopm/article/view/V7N1A4 (Access: July 2018).
Müller, C. J. (2003), Modelo de gestão integrando planejamento estratégico, sistemas de avaliação de desempenho e gerenciamento de processos. Doctoral thesis of Universidade Federal do Rio Grande do Sul.
Prakash, W. N.; Sridhar, V. G.; Annamalai, K. (2014), “New product development by DFMA and rapid prototyping”, ARPN Journal of Engineering and Applied Sciences, Vol. 9, No. 3, pp. 274-279.
Rozenfeld, H.; Forcellini, F. A.; Amaral, D. C.; Toledo, J. C.; Silva, S. L.; Alliprandini, D.H.; Scalice, R. K. (2006), Gestão de desenvolvimento de produtos: uma referência para a melhoria do processo, Saraiva, São Paulo.
Tasalloti, H. et al. (2015), “An integrated DFMA–PDM model for the design and analysis of challenging similar and dissimilar welds”, Materials & Design, Vol. 89, pp. 421-431, available from https://doi.org/10.1016/j.matdes.2015.10.012 (Access: July 2018).
Tubino, D. F. (2015), Manufatura Enxuta como Estratégia de Produção: A Chave para a Produtividade Industrial, Atlas, São Paulo.
Received: 30 Oct 2018
Approved: 30 Oct 2018
DOI: 10.14488/BJOPM.2018.v15.n4.a15
How to cite: Pinheiro, N. M. G.; Ordoñez, R. E. C.; Barbosa, G. L. L. et al. (2018), “Computational simulation applied in choosing the best solution in a product development using design for manufacturing and assembly approach”, Brazilian Journal of Operations & Production Management, Vol. 15, No. 4, pp. 618-628, available from: https://bjopm.emnuvens.com.br/bjopm/article/view/609 (access year month day).