How connectivity and search for producers impact production in Industry 4.0 networks
Adriano Pereira
peradri@gmail.com
Federal University of Santa Maria - UFSM, Santa Maria, Rio Grande do Sul, Brazil
Eugênio de Oliveira Simonetto
eosimonetto@ufsm.br
Federal University of Santa Maria - UFSM, Santa Maria, Rio Grande do Sul, Brazil
Goran Putnik
putnikgd@dps.uminho.pt
University of Minho, Braga, Portugal
Helio Cristiano Gomes Alves de Castro
heliodecastro@gmail.com
Polytechnic Institute of Cávado and Ave, Braga, Portugal; School of Engineering, Polytechnic of Porto, Porto, Portugal
ABSTRACT
Technological evolutions lead to changes in production processes; the Fourth Industrial Revolution has been called Industry 4.0, as it integrates Cyber-Physical Systems and the Internet of Things into supply chains. Large complex networks are the core structure of Industry 4.0: any node in a network can demand a task, which can be answered by one node or a set of them, collaboratively, when they are connected. In this paper, the aim is to verify how (i) network's connectivity (average degree) and (ii) the number of levels covered in nodes search impacts the total of production tasks completely performed in the network. To achieve the goal of this paper, two hypotheses were formulated and tested in a computer simulation environment developed based on a modeling and simulation study. Results showed that the higher the network's average degree is (their nodes are more connected), the greater are the number of tasks performed; in addition, generally, the greater are the levels defined in the search for nodes, the more tasks are completely executed. This paper's main limitations are related to the simulation process, which led to a simplification of production process. The results found can be applied in several Industry 4.0 networks, such as additive manufacturing and collaborative networks, and this paper is original due to the use of simulation to test this kind of hypotheses in an Industry 4.0 production network.
Keywords: Industry 4.0; Complex production networks; Simulation.
1 INTRODUCTION
Manufacturing scenarios are becoming more complex and dynamic, which increases the importance of cross company network cooperation projects, in order to support market competition (Mourtzis et al., 2013). Production paradigms have been changed over the years (Lasi et al., 2014), and the last Industrial Revolution, which will guide next transformations in production processes, has been called Industry 4.0 – or the Fourth Industrial Revolution (Hermann et al., 2016). Digital technologies advances are the basis of Industry 4.0, involving resources of Internet and smart objects in modular production systems, capable of managing manufacturing processes (Lasi et al., 2014).
Unlike the previous three industrial revolutions, Industry 4.0 is being studied before it happens, or while it happens, which brings a set of opportunities in both academic and enterprise environments (Hermann et al., 2016). Testbeds are used to simulate Industry 4.0 production processes, in complete industry level as well as specific machines; these environments allow evaluating bigger complexity applications and simulating function conditions, which contribute to improve manufacturing as a whole (ABDI, 2017).
Industry 4.0 is related to Cyber-Physical Systems (CPS) (Drath and Horch, 2014). CPS include smart machines, storage systems, and facilities capable of changing information and making autonomous decisions, building global networks (Kagermann et al., 2013) that connect their different components (Brettel et al., 2014). A network is a set of nodes related to each other by edges (Newman, 2003). Complex networks are networks that have an irregular structure that can be changed along the time (Boccaletti et al., 2006), as Industry 4.0 networks.
Complex production networks are made of connected work units. These units share information and solve tasks in an integrated way, with the participation of more than one element. This can be seen as cooperation, when a specific unit cannot solve a task, but it is solved by a set of connected units (Putnik et al., 2012).
Industry 4.0 allows personalization without price increase (Lasi et al., 2014). Even though its networks are not widely spread, it is possible to see this kind of large production network structure, for example, in additive manufacturing scenarios (also known as 3D printing manufacturing). Additive manufacturing is a way to build components, parts, models, prototypes, etc., from 3d-models in a layer-by-layer process, which uses different materials, such as plastic, metal, and ceramics (Conner, et al. 2014, Thomas and Gilbert, 2014). Huge additive manufacturing networks composed of producers and consumers has been made: 3DHubs.com is an example, in which more than 250,000 components are made each quarter by 6,000 international suppliers (3D Hubs, 2018).
Industry 4.0 has integrated many new manufacturing concepts, usually related to technologies, and it can be seen “from the lens of collaborative networks”, connecting manufacturing systems, products, value chains, etc. It is necessary to understand the interactions among Industry 4.0 networks to reach effectiveness, agility, and resilience of future systems (Camarinha-Matos et al., 2017). Based on that, it is possible to understand that Industry 4.0 networks can have different topological structures, related to their nodes connectivity. Furthermore, the search for work units capable to answer and execute a production task can go through different depth levels in the network. This paper aims to check how (i) network's connectivity and (ii) the number of levels taken in the search for nodes to contributed with a task execution affect the total number of complete production tasks. In order to achieve this goal, two hypotheses was formulated and analyzed based on simulations taken in a computational environment developed. It is expected that this paper's results can be applied in different kinds of large production network, in the Industry 4.0 context, such as additive manufacturing networks and collaborative networks.
The paper is organized in 4 sections, including this introduction. Section 2 brings a bibliographic review about the main topics of this work. In section 3, the method of the work is described. In section 4, the two hypotheses and the simulation made in this work are shown. Finally, in section 5, the results are discussed, and the research is concluded, with reference to future works.
2 LITERATURE REVIEW
In this section, concepts related to this paper are discussed.
Industry 4.0
“Industry 4.0” refers to the Fourth Industrial Revolution. It was first used in the Hanover Fair, Germany, in 2011, to define the phenomenon that follows the three first industrial revolutions (Drath and Horch, 2014), which resulted of (i) mechanization, (ii) electricity, and (iii) information technology (Kagermann et al., 2013).
Industry 4.0 aims to create smart products, processes, and procedures, and its key elements are the smart factories: plants capable of treating bigger complexities, with less interruptions and a more natural human-machine communication, as in a social network (Kagermann et al., 2013). This fourth industrial revolution will deliver better quality in fields such as engineering, management, manufacturing, operations, and logistics, with bigger flexibility and robustness; it can lead to self-organizable, optimized supply chains based on a set of criteria (Kagermann et al., 2013).
Hermann et al. (2016) cite four components of Industry 4.0, based on a literature review: (i) Cyber-Physical Systems; (ii) Internet of Things; (iii) Internet of Services; and (iv) Smart Factories. The CPS are responsible for integrating both real and virtual worlds; they are devices with capacity to store their state and to make operations. The Internet of Things (IOF) treats the connection of ordinary objects, which leads to the construction of a large communication network between devices and human beings (Xia et al., 2012). The Internet of Services (IOS) allows offering and demanding services on the Internet (Buxmann et al., 2009). Both IOF and IOS allow the construction of networks that integrate all manufacturing process, leading to the construction of networks of Smart Factories, capable of managing big complexities (Kagermann et al., 2013).
The Industry 4.0 structure, therefore, is a big and complex network, built by its different elements, as the Smart Factories and CPS. Thus, it is possible to study Industry 4.0's phenomena through analysis of complex network.
Complex networks
Networks represent many structures of society and are made of discrete elements, that have connections or interactions with other elements. In order to understand a network, it is necessary to understand its elements and its structure. Examples of networks are the Internet, social networks (on the Internet or not), the interaction of proteins and the human brain (Lovász, 2012).
A network structure is defined by the connection of its objects; the study of these structures is important, because there are many phenomena that occur over them. It is important to characterize the network's structure, i. e., “to enumerate many of the aspects that summarize the network's structure” (p. 306, translated by the authors), as well as to understand network's properties, because it is possible to extend behaviors based on this information (Figueiredo, 2011).
Nowadays, bigger networks have been studied, due to better computational capacities available: from networks with dozens or hundreds of nodes, today it is possible to analyze networks with thousands or millions of nodes (Newman, 2003). Networks have been called “complex networks” because the “typology and evolution of networks in the real world show robust organizational properties, differently from random networks” (Metz et al., 2007, p. 3, translated by the authors).
Even if they represent different structures of the real world (from information systems to biological and social systems), most of the real networks share topological features, as small-world and big clustering coefficient that make them different from regular structures, as the random graphs (Boccaletti et al., 2006).
It is necessary to study the processes that generate networks in order to generalize results; these processes are determined by math models (Figueiredo, 2011). The use of graphs, made of nodes and edges, to represent real networks are a simplification, due to networks' changes in proprieties over time; but they have been an informative way to represent the whole system (Boccaletti et al., 2006). Some topological proprieties, used in this work, are discussed as follow:
- The node degree is the number of edges that are related to it, and the average degree of a network is the arithmetic average of all its nodes' degree (Figueiredo, 2011);
- A path between two nodes in a graph is a sequence of nodes, without repetition, in which there is always an edge connecting each pair of nodes on the sequence (Figueiredo, 2011). In this work, the number of edges between two nodes was called the number of levels to go from one to the other.
3 METHODOLOGICAL PROCEDURES
In this paper, two hypotheses were formulated and tested, based on a modeling and simulation study. Modeling is the process of building models, which are representations of a system (Maria, 1997). According to Maria (1997), a model should be as close as possible to the real system, although it is a simplification; a model cannot be so complex that it makes its understanding and experiment impossible. A model is a simplified representation of the interactions among the parts of a system (Chwif and Medina, 2006).
Simulation aims to predict a system's behavior over input values, based on a set of rules; simulations can have mathematical formulas, but they cannot be summarized in only a single equation. Computational simulation is the simulation performed in a computer (Chwif and Medina, 2006) and it is the simulation used in this paper.
This work followed the steps proposed by Law and Kelton (2000) to a simulation study, which are:
- Problem formulation and study plan: problem definition and study plan was made based on the investigations exposed in the introduction and literature review of this article;
- Collecting data and defining a model: the model definition was based on previous studies. The works of Skulj et al. (2014) and Putnik et al. (2015) were selected for this definition, which is describe in the following sections of this paper;
- Validation: model validation was made with experts, as indicated by Law and Kelton (2000);
- Constructing a computer program and verifying it: based on the built model, a software was implemented, using the program language Java;
- Making pilot runs: at this moment, controlled simulations were made, in order to get output data that can be validated in the following step;
- Validation: the sixth step consists in the analysis of the data gathered in the previous one. Due to the impossibility to obtain real data for comparison, controlled tests were made to check whether input changes would result in the expected outputs;
- Design experiments: the experiments with the hypotheses were defined in this step and they are described in the following sections of this paper;
- Making production run: the simulations about the hypotheses were run based on the developed model, over the implemented software;
- Analyzing output data: this step is also described in the following sections of this paper, based on the obtained results;
- Documenting, presenting and implementing results: the presentation of the results is indicated in the following sections of this article, as the previous step.
The production network model developed in this paper was based on Skulj et al. (2014) and Putnik et al. (2015). The network's nodes represent work units, which can be both producers and/or consumers. The edges indicate relationships between these units: if two nodes are connected, they can exchange information and execute a task together. Letters (A, B, C, …, Z) are used to represent production (or consumption) items. A node has a list of skills, which are a set of production items the node is able to produce in order to execute a demand. A demand (task) is made up of a set of items, and is always directed to a specific node; this node can execute the whole task, or just a part, if it has the needed production items in its set of skills. If the node cannot execute the whole task, it can send the remaining part to its neighbors, i.e., the nodes that are directly connected to it. This delegation process can be done recursively, up to a predefined limit of levels. Figure 1 shows the visited nodes, from A, when the number of levels is 0, 1 or 2.
Figure 1. Nodes of a network visited from A (0, 1 or 2 levels)
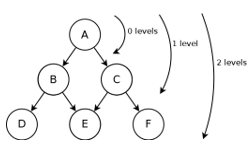
Source: authors (2018)
The search for nodes to execute a task is made as in a breadth search in a graph, i.e., starting from a specific node s, firstly, all nodes directly connected to s are visited. Then, this procedure is repeated, taking a new node as a source, which has to be a node directly connected to s (Cormen, 2009). Figure 2 shows a breadth search in a network.
Figure 2. Breadth search
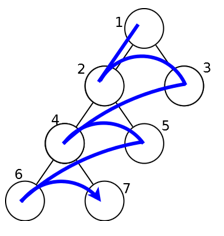
Font: authors (2018)
4 RESEARCH HYPOTHESES
Two hypotheses were made to achieve this paper's goals. They were made based on Putnik et al. (2015). In their article, the robustness of production networks was checked in relation to its size and the size of the existent social connections. The hypotheses' elaboration are the seventh step of Law and Kelton's method to a simulation study. The hypotheses are:
- Hypothesis 1 (H1): in an Industry 4.0 network production, the number of tasks completely executed is related to the network's average degree. A more connected network could make easy the search for nodes with capacity to execute a task. Because of this, this network is expected to complete a big number of demands;
- Hypothesis 2 (H2): in an Industry 4.0 network, the number of production tasks completely executed is related to the maximum of levels that can be traveled in the search for nodes, and it is affected by the network's average degree. It is expected that, going through more levels, more nodes will be reached and, then, more tasks can be complete. This behavior can be affected by the network's average degree, which can help to reach a bigger number of nodes faster.
Computing simulations were performed to evaluate the hypotheses. This corresponds to the eighth step of Law and Kelton's method. To do this, five random scale free networks were created with 128.000 nodes each one; their average degrees were defined in 2, 4, 8, 16, 32. The five networks were created using Pajek software, a computer software “for analysis of large networks” (Batagelj and Mrvar, 1998, p. 1). Each node in the networks received a set of random skills, each one having between 1 and 10 different items. The evaluations of the two hypotheses are discussed as follows.
H1 indicates that “in an Industry 4.0 network production, the number of tasks completely executed is related to the network's average degree”. To check H1, a simulation was run, trying to execute 1000 production tasks in each one of the 5 previously generated random networks. The tests were repeated 100 times to each network, and the showed results refer to the executions' averages. The maximum number of levels to this analysis was defined as 10. The simulator avoids loops, i.e., one node never is checked more than once. Table 1 summarizes the results to H1 executions. Figure 3 shows a graph relating the network's average degree with the number of tasks completely executed.
Table 1. Number of tasks completely run by networks' average degrees
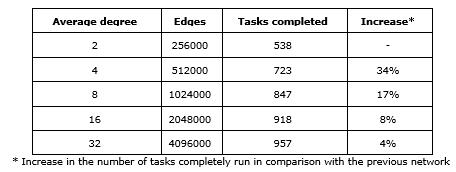
Source: the authors (2018)
Figure 3. Number of tasks completely run by networks' average degree.
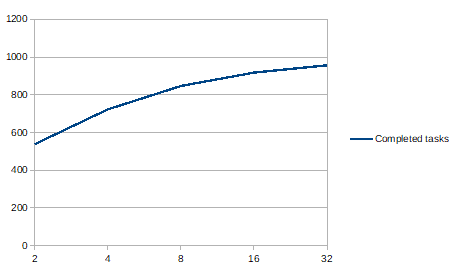
Source: the authors (2018)
For the first hypothesis, results showed an increase in the total number of tasks completely run with the increase of network's average degree. The biggest increase in the number of completely run tasks occurred from the networks with average degree 2 to 4: around 34%. The total number of tasks completed increased in 78% from the network with average degree 2 to the network with average degree 32. Based on this data analysis, H1 was confirmed, i.e., network's connectivity influences the number of completely run tasks in an Industry 4.0 production network.
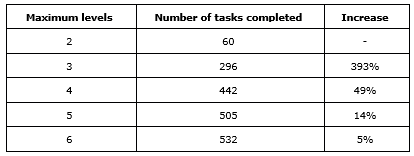
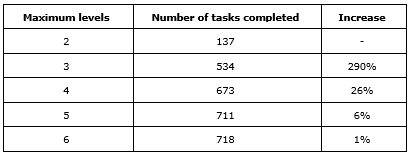
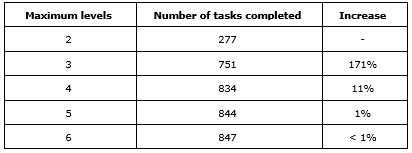
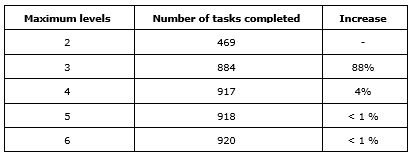
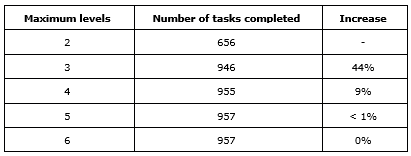
The second hypothesis is: “in an Industry 4.0 network, the number of production tasks completely executed is related to the maximum number of levels that can be traveled in the nodes search, and it is affected by the network's average degree”. To verify this hypothesis, 1000 tasks were simulated in each network, and the maximum number of levels was defined as 2, 3, 4, 5 and 6. Therefore, 25 different scenarios were checked, combining the different average degrees with the numbers of levels. As in H1, each test was repeated 100 times, and the results, summarized in tables 2, 3, 4, 5 and 6, show the average values.
Table 2. Number of tasks completely run - network with average degree 2
Source: the authors (2018)
Table 3. Number of tasks completely run - network with average degree 4
Source: the authors (2018)
Table 4. Number of tasks completely run - network with average degree 8
Source: the authors (2018)
Table 5. Number of tasks completely run - network with average degree 16
Source: the authors (2018)
Table 6. Number of tasks completely run - network with average degree 32
Source: the authors (2018)
Based on the results analysis, it was noticed that the maximum level increase raises the total number of tasks completely run in almost all scenarios. The only case in which this did not occur was in the network with average degree 32, when it was changed from 5 to 6 levels. The raise in the degree intensified the behavior: networks with a bigger average degree and bigger maximum defined level completed a larger number of tasks.
The raise in levels was more intense in networks with smaller average degrees. In networks with average degree 2, the level increase from 2 to 3 led to a raise of 393% in the number of tasks completely run. To the networks with average degrees 4 and 8, respectively, the rise from 2 to 3 levels led to increases of 290% and 171% in the number of tasks completely run. For the networks with average degrees 16 and 32, the increase from 2 to 3 levels led to a raise of 88% and 44% in the total tasks completely run.
Based on the results, H2 was confirmed only in part, because in one case there was no change in the number of completely run tasks with the change of maximum levels defined.
5 CONCLUSION AND FUTURE WORKS
The last step proposed by Law and Kelton (2000) is the documentation and presentation of the simulation results. Based on the simulations, it is possible to conclude that more connected networks are more capable of completing production tasks in Industry 4.0 scenarios. In average degree 2 network, 54% of tasks were completely run, while in the network with average degree 32 this value raised to 96%. The impact of connectivity increase was not linear: from the average degree 2 to 4, the number of tasks totally run was raised around 34%; on the other hand, from the average degree 16 to 32, the increase was 4%. This shows a stabilizing behavior in the number of tasks completely run with the increase in connectivity (network average degree).
As to the number of levels taken in nodes search, only one situation did not lead to an increase of tasks completely run: in average degree 32 network, the raising from 5 to 6 levels. This may have happened due to the network high connectivity, which may not lead to reach more nodes with 6 levels than the same search with 5 levels. The number of levels had bigger impact in less connected networks; for example, in the average degree 2 and 4 networks, when the number of levels increased from 2 to 3 levels, the number of completely run tasks raised in 323% and 290%, respectively.
Therefore, based on simulations and results analysis, this papers' goal was reached. Thus, taking an additive manufacture scenario with thousands of producers and consumers as a large production network example, it is important to have greater average degrees, that is, each node should be as connected as possible. Furthermore, it is necessary to search as thoroughly as possible in the network, thus increasing the chances of completing a task.
As future works, the construction of a method to choose which nodes will participate in task running and the inclusion of restrictions in this process can be cited. One limitation of the research was the simplification of the production process in the developed model inherent in any modeling and simulation process.
6 REFERENCES
3D Hubs (2018), Digital Manufacturing Trends Q3/2018, Netherlands.
ABDI (2017), Inovação, Manufatura Avançada e o Futuro da Indústria: uma Contribuição ao Debate sobre as Políticas de Desenvolvimento Produtivo, Brasília.
Batagelj, V.; Mrvar, A. (1998), “Pajek-program for large network analysis”, Connections, Vol. 21, No. 2, pp. 47–57.
Boccaletti, S.; Latora, V.; Moreno, Y.; Chavez, M.; Hwang, D.-U (2006), “Complex networks: Structure and dynamics”, Physics reports, Vol. 424, No. 4-5, pp. 175–308.
Brettel, M.; Friederichsen, N.; Keller, M.; Rosenberg, M. (2014), “How virtualization, decentralization and network building change the manufacturing landscape: An Industry 4.0 Perspective”, International Journal of Mechanical, Industrial Science and Engineering, Vol. 8, No. 1, pp. 37–44.
Buxmann, P.; Hess, T.; Ruggaber, R. (2009), “Internet of services”, Business & Information Systems Engineering, Vol. 1, No. 5, pp. 341.
Camarinha-Matos L.M.; Fornasiero R.; Afsarmanesh H. (2017), “Collaborative Networks as a Core Enabler of Industry 4.0”, Collaboration in a Data-Rich World, Vicenza, Italy, September 18-20, 2017.
Chwif, L.; Medina, A. C. (2006), Modelagem e simulação de eventos discretos. Afonso C. Medina, São Paulo.
Conner, B. P.; Manogharan, G. P.; Martof, A. N.; Rodomsky, L. M.; Rodomsky, C. M.; Jordan, D. C.; Limperos, J. W. (2014). Making sense of 3-D printing: Creating a map of additive manufacturing products and services. Additive Manufacturing, Vol. 1, pp. 64-76.
Cormen, T. H. (2009), Introduction to algorithms, MIT press.
Drath, R.; Horch, A. (2014), “Industrie 4.0: Hit or hype?”, IEEE industrial electronics magazine, Vol. 8, No. 2, pp. 56–58.
Figueiredo, D. R. (2011), “Introdução a redes complexas”, in Souza, A. F.; Meira Jr., W. (Org.), Atualizações em Informática, Editora PUC Rio, Rio de Janeiro, RJ, pp. 303–358.
Hermann, M.; Pentek, T.; Otto, B. (2016). “Design principles for industrie 4.0 scenarios”, 49th Hawaii International Conference on System Sciences, Koloa, HI, USA, pp. 3928–3937, jan. 5-8, 2016.
Kagermann, H.; Wahlster, W.; Helbig, J. (2013). Securing the future of German manufacturing industry: Recommendations for implementing the strategic initiative INDUSTRIE 4.0, Acatech, Germany.
Lasi, H.; Fettke, P.; Kemper, H.-G.; Feld, T.; Hoffmann, M. (2014), “Industry 4.0”, Business & Information Systems Engineering, Vol. 6, No. 4, pp. 239–242.
Law, A. M.; Kelton, W. D. (2000). Simulation modeling and analysis. McGraw-Hill.
Lovász, L. (2012), Large networks and graph limits, American Mathematical Soc, USA.
Maria, A. (1997), “Introduction to modeling and simulation”, Proceedings of the 1997 Winter Simulation Conference, Atlanta, GA, USA, pp. 7-13, Dec. 07-10, 1997.
Metz, J.; Calvo, R.; Seno, E. R.; Romero, R. A.; Liang, Z. (2007), Redes Complexas:conceitos e aplicações, Relatórios Técnicos do ICMC-USP, São Carlos.
Mourtzis, D.; Doukas, M.; Psarommatis, F. (2013), “Design and operation of manufacturing networks for mass customization”, CIRP Annals-Manufacturing Technology, Vol. 62, No. 1, pp. 467–470.
Newman, M. E. (2003), “The structure and function of complex networks”, SIAM review, Vol. 45, No. 2, pp. 167–256.
Putnik, G. D.; Castro, H.; Ferreira, L.; Rui, B.; Vieira, G.; Alves, C.; Shah, V.; Putnik, Z.; Cruz-Cunha, M. M.; Varela, L. (2012). Advanced Manufacturing Systems and Enterprises – Towards Ubiquitous and Cloud Manufacturing, School of Engineering, LabVE, University of Minho, Braga, Portugal.
Putnik, G. D.; Škulj, G.; Varela, L.; Butala, P. et al. (2015), “Simulation study of large production network robustness in uncertain environment”, CIRP Annals, Vol. 64, No. 1, pp. 439–442.
Škulj, G; Vrabic, R.; Butala, P. (2014), “Experimental study of work system networking in production environment”, CIRP Annals, Vol. 63, No. 1, pp. 401-404.
Thomas, D. S., & Gilbert, S. W. (2014). Costs and cost effectiveness of additive manufacturing. NIST Special Publication, Applied Economics Office, Engineering Laboratory, USA.
Xia, F.; Yang, L. T.; Wang, L.; Vinel, A. (2012) “Internet of things”, International Journal of Communication Systems, Vol. 25, No. 9, pp. 1101-1102.
Received: 15 Jun 2018
Approved: 23 Oct 2018
DOI: 10.14488/BJOPM.2018.v15.n4.a6
How to cite: Pereira, A.; Simonetto, E. O.; Putnik, G. et al. (2018), “How connectivity and search for producers impact production in Industry 4.0 networks”, Brazilian Journal of Operations & Production Management, Vol. 15, No. 4, pp. 528-534, available from: https://bjopm.emnuvens.com.br/bjopm/article/view/511 (access year month day).