Computer Simulation Model for Outpatient Clinics in a Brazilian Large Public Hospital Specialized in Cardiology
João Chang Junior
chang.joao@gmail.com
Centro Universitário FEI, São Bernardo do Campo, São Paulo, Brazil
Fábio Lima
flima@fei.edu.br
Centro Universitário FEI, São Bernardo do Campo, São Paulo, Brazil
Alfredo Manoel da Silva Fernandes
alfredo.fernandes@incor.usp.br
Instituto do Coração do Hospital das Clínicas da Faculdade de Medicina da Universidade de São Paulo - InCor do HCFMUSP, São Paulo, Brazil
Felipe de Almeida Guardia
felipe_fag.27@hotmail.com
Centro Universitário FEI, São Bernardo do Campo, São Paulo, Brazil
Vanessa Dias da Silva
silva.vanessadias@hotmail.com
Centro Universitário FEI, São Bernardo do Campo, São Paulo, Brazil
Giovanni Augusto Maccheri
maccherig@gmail.com
Centro Universitário FEI, São Bernardo do Campo, São Paulo, Brazil
ABSTRACT
Goal: the main objective of this study is to analyze the behavior of the outpatient department of a large public hospital specialized in cardiology, understanding how the components of this system are related, in order to improve the hospital’s performance.
Design / Methodology / Approach: a case study was carried out in a public hospital specializing in cardiology with the aid of Modeling and Simulation of System Dynamics.
Results: the result showed that variables such as doctor availability and average consultation time have great influence on the service capacity.
Limitations of the investigation: the proceedings and times related to the medical staff are particular to each team and they are not standardized. However, in the system dynamics modeling these particularities cannot be included.
Practical implications: for theory, there is the state-of-the-art development in terms of how to manage and regarding the methodologies should be applied in a complex referential model composed of several moderating variables, in order to obtain the best use of the available resources (human and material) of the hospital. For practice, the flow of patients in the hospital should be predicted and optimized, adding value to the services provided to its users.
Originality / Value: the originality of the work is based on the unprecedented application of quantitative methods for solving problems in Brazilian hospitals.
Keywords: System Dynamics; Ambulatories; Simulation in Healthcare; VenSim 6.0.
1 INTRODUCTION
Brazil took the 72nd place in a ranking compiled by the WHO - World Health Organization - about investments in health, behind neighboring countries such as Argentina, Uruguay and Chile, as presented in Barrocal and Nassif (2011). The public hospitals in Brazil suffer from overcrowding and lack of financial resources. Considering that it is impossible to raise the investments in the public Brazilian hospitals at this moment, an alternative to alleviate the system is the use of methods of Operational Research (OR) to improve some critical hospital processes.
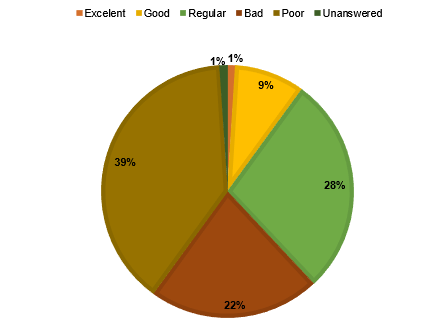
According to a survey on health in Brazil, conducted by the National Confederation of Industry (CNI) and IBOPE - Brazilian Institute of Public Opinion and Statistics (2013), more than half of the population disapproves the Brazilian health system. According to the survey, 61% of 2002 respondents in 141 municipalities in Brazil evaluated the health of the country as “poor” or “bad”, and only 10% as “excellent” or “good” as shown in Figure 1.
The same survey revealed that 85% of people interviewed saw no improvement in the health service during the three years preceding the survey. More specifically, 42% of respondents indicated that the service remained at the same level, and 43% that it worsened from 2009 to 2012.
CNI and IBOPE also concluded that, overall, 79% of respondents used more recently (during the twelve months preceding the survey) outpatient hospital services, compared to 4% of hospitalizations, 7% of emergency services and 8% of examinations laboratory.
Figure 1. Brazilian health evaluation – adapted from CNI and IBOPE (2013)
Our study is relevant because the use of ambulatory is the highest among other hospital departments as well as patient satisfaction with respect to the Brazilian health service is very poor and most of them have not seen development of this service in recent years. Another important factor is that the aging of the population increases the demand for hospital services.
The flow of people who spend a day in these sectors, especially in mega-cities like São Paulo, is significant. It is therefore crucial and mandatory that studies be done to improve the dynamics of these processes. Thus, the service itself is valued and customer satisfaction increases.
In most cases, patients are admitted to a hospital through the clinic, whose focus is on medical consultation. However, depending on the case, the person will be transferred to sectors such as surgery or examination. Therefore, this study is useful regarding issues of hospital care and organization, and the outpatient sector aims to optimize all the outpatient system, since an efficient service at the admission leads to the reduction of losses in any subsequent proceedings.
This article is an extended version of the work presented at the POMS 2014 congress (Chang et al., 2014).
2. OBJECTIVES
The main objective of this study is to analyze the behavior of the outpatient department of a large public hospital specialized in cardiology, understanding how the components of this system are related, in order to improve the hospital’s performance. The specific objectives are: a) The specification of the patients’ flows through the sectors of the outpatient clinics; b) The data acquisition about discharges, returns and new patient appointments.
3. LITERATURE REVIEW
3.1 General Applications
In Moreno et al. (1998) and Moreno et al. (1999), the authors mentioned the difficult of constructing hospitals models using the Petri Net approach. Therefore, they propose a process oriented approach. The application has proved its utility as a valuable resource to improve the hospital performance.
The objective of the work of El-Darzi et al. (1998) is to simulate the flow of patients through geriatric hospitals in terms of acute (short-stay), rehabilitation (medium stay), and long-stay states where the bed occupancy at a census point is modelled by a mixed exponential model using BOMPS (Bed Occupancy Modeling and Planning System). The authors consider the problem as a queueing system to assess the effect of blockage on the flow of patients in geriatric departments. The results show that the flow model and the unconstrained simulation are equally viable tools to measure bed occupancy in a geriatric department. Different constrained simulation configurations were used to model the internal process and measure its effectiveness. Statistics such as emptiness, waiting time and number of rejected patients can be easily derived from this model.
The objective of the paper from McClean and Millard (1998) is to discuss a three-compartment model where the compartments may be described as consisting of acute care, rehabilitation and long-stay care in a geriatric hospital. A Markov model is used to count and evaluate the movements of geriatric patients within a hospital system. By attaching costs to various parts of the system, the model may facilitate the evaluation and comparison of different strategies and scenarios.
The paper of Thorwarth and Arisha (2009), structured as a quick reference guide, presents a comprehensive review of process simulation applications in healthcare areas, which summarizes projects applied in health care facilities such as hospitals, emergency departments, intensive care units, surgical procedures, outpatient clinics, and facilities allocated in the health care supply chain. Seventy articles are reviewed covering a range of the last decade that present the potential of simulation as a strategic tool for decision makers in the aforementioned areas. In the fore coming studies of health care operations, various types of simulation are encountered: Discrete Events Systems (DES) is the most common, because it is possible to integrate other solution techniques such as mathematical programming, various optimization strategies, scheduling, and animation.
Applying What-If questions to DES is a favored approach to understanding the mechanism influencing the complex system. Other simulation approaches are based on stochastic simulation or apply mathematical models to retrieve results.
In Reynolds et al. (2011), the authors presented the findings of a discrete event simulation study of the hospital pharmacy outpatient dispensing systems in two London hospitals. They tested scenarios to estimate the likely impact of changes in prescription workload, staffing levels and skill mix, and utilization of the dispensaries automatic dispensing robots.
Rohleder et al. (2011) used, in their work, the discrete event modeling and simulation to support process improvements at an orthopedic outpatient clinic. The modeling helped to identify improvement alternatives including optimized staffing levels, better patient scheduling, and an emphasis on staff arriving promptly.
Thunhurst’s (2012) work explores the role of systems thinking and operational research in furthering the understanding of and the control over complex public health systems. The article is focused on the public health systems of both developed and developing countries. The proposal is to develop a whole systems approach considering all the aspects related to a health system.
In Griffin et al. (2012), the authors developed a simulation model applied to an obstetric unity in the DeKalb Medicals Women Center in Atlanta, GA. To implement the simulation model the authors used the Arena 10.0 software package. The authors identified the bottlenecks and proposed actions to solve them with good results achieved.
The study conducted in Rau et al. (2013) uses a simulation model as a tool for strategic capacity planning for an outpatient physical therapy clinic in Taipei, Taiwan. They constructed a discrete event simulation model to study the dynamics of patient mixes with realistic treatment plans to estimate the practical capacity of the physical therapy room.
The paper of Li et al. (2014) presents a robust reconfiguration method based on Petri nets and integer programming for supervisory control of Resource Allocation Systems (RAS) subject to varying resource allocation relationships. They applied the methodology to a hospital emergency service. Works based on modeling could use the reconfiguration of resource allocation to support it.
In Shi et al. (2014) the authors developed a simulation model to study the performance of clinic operations based on the settings of a typical Veterans Affairs (VA) hospitals primary care clinic with complex characteristics. Due to the complexity of the clinic operation, they adopted the discrete event simulation approach and developed the model by using Arena software.
In Valdmanis et al. (2015), the authors assess the capacity of Florida’s public health departments. They achieve this by using bootstrapped Data Envelopment Analysis (DEA) applied to Johansen’s definition of capacity utilization.
3.2 System Dynamics Applications
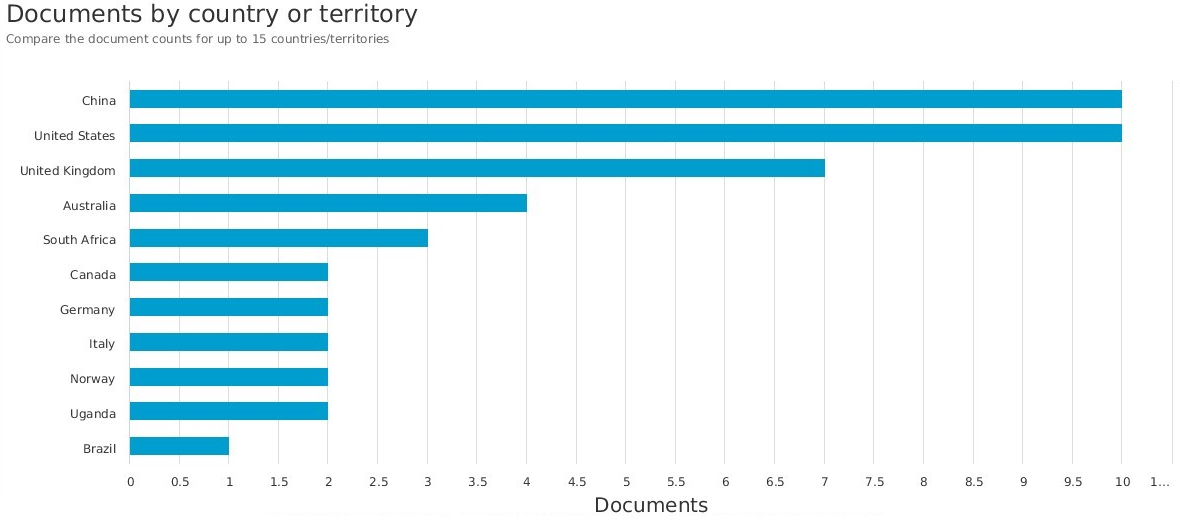
In the following, some works considering the application of the system dynamics theory are presented. A research using then Scopus database was performed with the keywords “Health” and “System Dynamics” in the title field. Figure 2 presents the areas where the papers came from and Figure 3 shows the distribution of the number of publications for the several countries.
Figure 2. Distribution of publications by area – adapted from Scopus (2019)
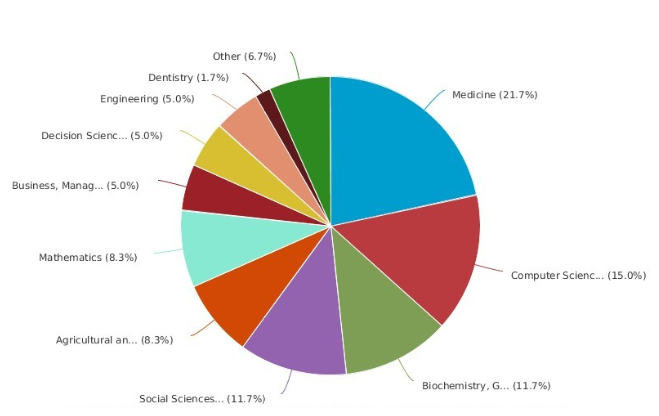
Figure 3. Number of publications by country– adapted from Scopus (2019)
Andrade et al. (2014) conducted a Brazilian study using system dynamics. In that work, they evaluated the factors related with delays in the treatment of STEMI (ST segment elevation myocardial infarction) patients to support a strategic plan toward structural and personnel modifications in a primary hospital, aligning its process with international guidelines.
Atkinson et al. (2015) performed a review of applications of system dynamics modeling to support health policy. The aim of the review was to determine the effectiveness of system dynamics modeling for health policy and explore the range and nature of its application. The authors concluded that advances in software are allowing the participatory model building approach to be extended to more sophisticated multimethod.
Lyons and Duggan (2015) investigated the use of system dynamics modeling to support policy analysis for sustainable health care. They present two contributions compared to other works: the continuous simulation of health-care infrastructure adequacy and the conceptual modeling of the wider public policy context for health-care sustainability.
The paper of Newell and Siri (2016) explores the potential for low-order system dynamics (LOSD) models to contribute towards generating reliable predictions of health-policy outcomes.
Semwanga et al. (2016) applied a system dynamics modeling approach to explore policy options to improve neonatal health in Uganda. They “developed a neonatal health simulation model (NEOSIM) to explore potential interventions that could possibly improve neonatal health within a health system context” (p. 1).
Xie et al. (2017) used a system dynamics approach to understanding the One Health concept. According to the authors, the One Health concept has not been well described. A large review of the literature was performed and, afterwards, a theoretical model, regarding interactions of various disciplines and complex problem descriptors engaged in One Health problem solving, was constructed.
Hill and Camacho (2017) used a system dynamics modeling approach to assess the impact of launching a new nicotine product on population health outcomes. The results suggested an overall beneficial effect from launching e-cigarettes and that system dynamics could be a useful approach to assess the potential population health effects of nicotine products when epidemiological data are not available.
Edaibat et al. (2017) examined the health information exchange (HIE) adoption barriers, challenges, influencing factors, and the impacts of policy interventions among ambulatory providers and acute-hospitals in the State of Maryland health care system.
Alonge at al. (2017) used system dynamics methods to explore effective implementation pathways for improving health systems performance through pay-for-performance (P4P) schemes. A causal loop diagram was developed to delineate primary causal relationships for service delivery within primary health facilities. A quantitative stock-and-flow model was developed next. The stock-and-flow model was then used to simulate the impact of various P4P implementation scenarios on quality and volume of services.
In the work of Yafei (2018), a method of health policy system evaluation based on system dynamics and complex network has been proposed in order to improve index planning rationality of health policy evaluation system.
Liu et al. (2018) published a review paper about the use of agent theory and system dynamics modeling in population health and healthcare research. They concluded that there was a higher diffusion of the agent-based modeling compared to the system dynamics modeling. According to the authors, the motive is the higher number of journals dedicated to first approach.
Another review about the application of system dynamics modeling to environmental health decision-making and policy is presented by Currie et al. (2018). In the paper the authors investigate if, and in what contexts, system dynamics modeling is being used to inform policy or decision-making processes related to environmental health.
3.3 Literature Gap and Contributions
From the general literature review, it is possible to notice that the most common approach to modeling and simulating healthcare system is the DES tool. Therefore, the system dynamics theory presented in this paper brings a contribution to the subject.
From the specific literature of the system dynamics and the analysis of Figures 2 and 3 it is possible to conclude that the number of the contributions to the system dynamics field in the engineering field as well as the Brazilian contributions should be improved.
This paper contributes to the field when using a system in the modeling of processes in the large Brazilian cardiology hospital. Beyond the use of the technique, the application in the Brazilian public hospital, which suffers from lack of resources, is an important contribution of this work.
4. THEORETICAL REASONING
4.1. Modeling
According to Borshchev (2013) modeling is one of the ways to solve problems that appear in the real world. A model is a simplification of a real system; the main variables that act in the system are chosen and the rules that govern the system are established. These rules can be expressed by differential equations, state charts, process flowcharts, schedules, etc.
As in Seila (1995), the model´s description includes the probability distribution of the variables that are not deterministic. In manufacturing systems, for example, time charts for the broken machine, or machine repair times are generally unknown. In the computer communication system, the number of packets to be transmitted and the time when it will be transmitted are also random. In both cases, the model must describe the structure of the probability of these processes.
4.2. Simulation
Simulation is always associated with an executable model that you can run and a set of rules will show the next state of the system from the current one (Borshchev, 2013).
For example, engineers construct simulations for ship’s system to verify how they float in the water, and airline pilots are trained using simulators that recreate the responses of the aircraft for various actions they can take, allowing them to learn how to control the plane. Physical systems, such as manufacturing or more abstract systems, such as network computers, can be simulated in software programs.
Oliveira (1994) defines simulation as a set of abstract entities that represent real objects that are related to each other to demonstrate a real system.
As in Fu (2014) the simulation is a tool to validate ideas. Simulation is an experimental process that uses representative models of a real system to determine how it will respond to environmental changes. The simulation analyses the impacts of a change in a complex systems environment and supports decision makers.
According to Hillier and Lieberman (2014), simulation is a mathematical modeling method to reproduce the characteristics of a real system. According to the authors, it is not possible to obtain conditions that improve the real system from the outset. However, you can use the simulation in experiments for different situations or scenarios.
4.3. Systems and System Dynamics
Rardin (2000) says that the discipline of system dynamics was proposed and developed in 1950 by the electrical engineer Jay Forrester at the Sloan School of Management at MIT (Massachusetts Institute of Technology). Forrester worked during World War II in MIT’s servomechanism laboratory for the U.S. armed forces developing automatic military weapons controls. He also made a major contribution to the administrative, economic and social sciences, using the same concepts of control theory and servomechanisms, well developed in electrical engineering. The system dynamics is a method that employs the structure of causal relations among the variables of a system to define its behavior. In addition, it makes use of feedbacks (circular causality).
System Dynamics is a technique in which nonlinear, dynamic, and complex social systems can be understood and analyzed through the interactions of their variables. Ogata (1998) states that a system is dynamic when its present behavior depends on past situation.
4.4. Simulation and System Dynamics
According to Madachy (2007), system dynamics offers an environment that allows the use of equations, graphs and tabular data. Employing quantitative variables interconnected in feedback loops and circular causality. According to Rardin (2000), the models that represent the system dynamics are the Causal Diagrams and the Models of Actions and Flows. Causal Diagrams represent qualitatively the components of a system, while Stock and Flow Models are good for quantitatively expressing cause and effect relationships.
4.5. Stock and Flow Models
The Stocks and Flows Model as in Forrester (1961) was based on the metaphor of hydraulics, where a flow of water gets in and out of a reservoir. It is interesting to think of stocks as a tub with water: the amount of water in the tub at one time is the accumulated water that entered subtracting accumulated water that went down the drain.
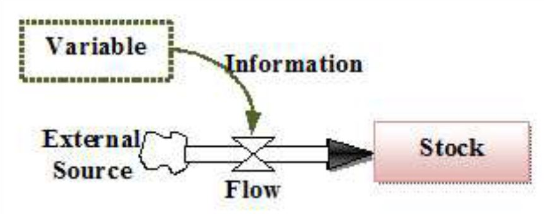
Rardin (2000) defines five basic elements that make up a Stock and Flow model. They are: a) Variables that are the parameters of a system and can assume constant values; b) Flows that indicate the transport of resources being controlled by flow equations; c) Stocks that represent the accumulation of resources. These are variables whose current state depends on what happened in the previous period; d) Information that is represented by simple dashed arrows and shows the relations between the components of the system; e) External Source that is represented in a "cloud" form.
Figure 4 shows the relationship between these model components.
Figure 4. Representation of the stock and flow model
5. METHODOLOGY
According to Cosenz and Noto (2016) System Dynamics (SD) is a methodological approach – developed during the 1950s by Jay Wright Forrester – for modeling and simulating complex physical and social systems and experimenting with the models to design policies for management and change (Forrester, 1958). In this work, SD was used to modeling the outpatient flow considering the evaluation of the variables as: quantity of patients, attending times, waiting times and patients’ stock. The results from this modeling, therefore, are related to the described variables.
6. MODELING
The Clinic is composed of two sectors: the General Clinic, through which all patients enter and whose objective is to provide an initial treatment; and Clinics of Specialties, which will continue with the treatment of patients who were not discharged in the General Clinic.
Most of the patients come from the SUS (Single Health System, acronym in Portuguese) in the State of São Paulo. Initially, a new patient enters the General Clinic sector. On the scheduled day, he should go to the entrance booth, complete a registration form, and head to the waiting room. After the consultation, the patient should return to the booth and deliver a card with the information regarding the next steps of the treatment.
Usually, the doctor asks for some tests that can be performed at the Clinic itself. The sector consists of an entrance booth, two booths to request the return, registration or discharge, as well as five medical offices.
Upon returning to the General Clinic, the patient goes to the booth, where his chart is prepared and he goes to the waiting room. In this return of consultation the doctor must certify, based on the exams, what the specific problem of the patient is. If the patient can be treated at home, he will be discharged; otherwise he will follow his treatment at the Specialty Clinic. In some cases, more tests are needed and the patient should return.
Once registered, the treatment will follow at the Specialty Clinic.
The clinic has 19 specialties and follows the same dynamic of the General Clinic: the patient arrives for an appointment, opens a registry at the counter and waits in the waiting room; after being examined, he goes to the booth at the entrance to the clinic and picks up his record with the information for the next steps.
There is also the possibility of returning to the General Clinic. Depending on the severity of the patient's comorbidity, the physician may request that he or she perform other tests or even refer the patient to the surgical center. In this case, after surgery, the patient should make follow-up appointments. If the patient does not present any more illness, he will be discharged from the clinic.
The database of 117,794 queries between January and September 2016 was used to perform the simulation of outpatient appointments. Of the total number of visits during this period, 19,282 were attended at the general outpatient clinic and 98,512 were attended at the specialty outpatient clinic.
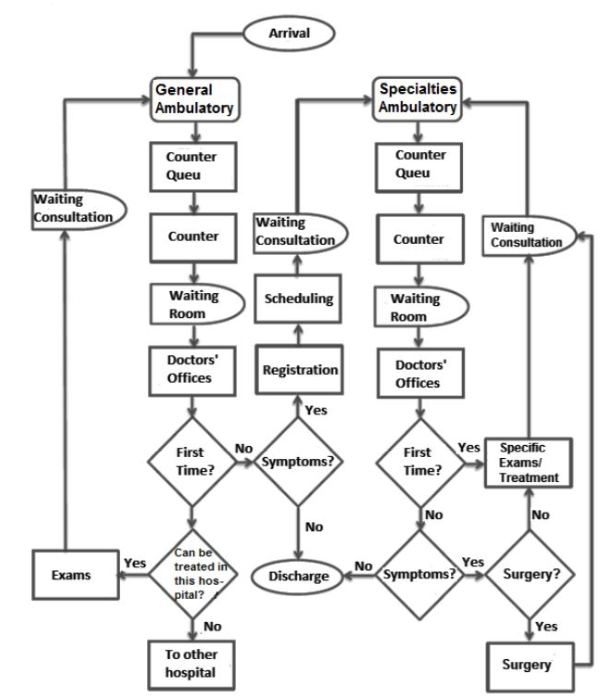
Appendix A shows the clinic-wide flowchart. The following variables were considered for the modeling of the General and Specialties Clinics: a) The number of patients, b) The frequency of patients in the entrance window; c) The queue size in the entrance window; d) The waiting time in the queue at the entrance window; e) The number of available entrance windows; f) The frequency of attendance at the entrance window; g) The frequency of consultations; h) The consultation time; i) The waiting time at the entrance window; j) The number of doctors available; k) The delay time for a return; l) The amount of returns; m) The amount of discharges; n) The amount of entries; o) the amount of hospitalizations (Ambulatory Specialty only).
The hospital outpatient system was assembled in the VenSim 6.1 software through its diagram of causal relationships between the variables of this system (Appendix B). Figure 5 represents the General Clinic cycle. This diagram can be divided into small cycles that together represent the dynamics of the General Clinic system.
Figure 5. General Clinic causal diagram
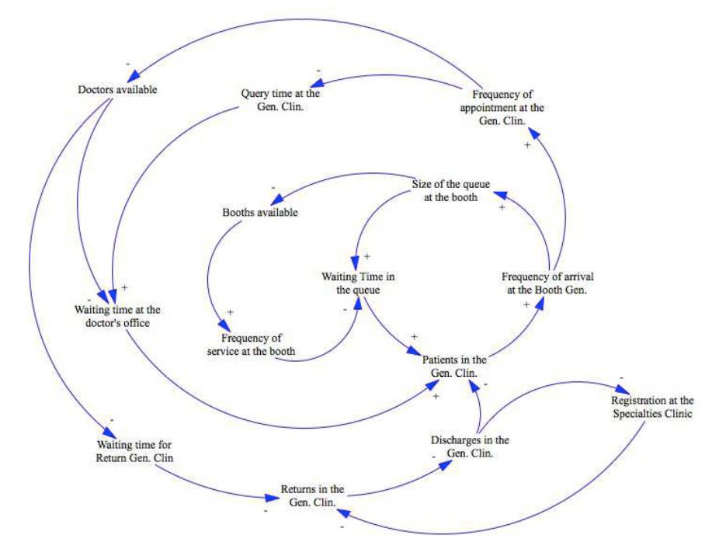
For example, the diagram in Figure 6 shows the cycle of entry to the General Clinic. By increasing the amount of patients in the General Clinic, the frequency of arrival at the booth will grow; it will increase the queue size at the booth, which will increase the waiting time for patients in the queue. It is a reinforcing cycle, since all polarities are positive, which indicates that it contributes to increase patient’s stock.
Figure 6. Cycle of entry into General Clinic
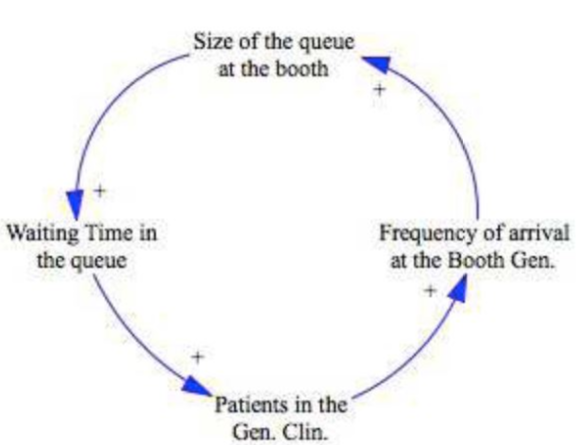
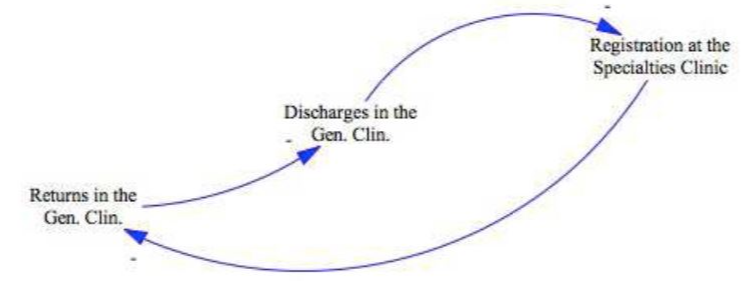
Figure 7 shows the output cycle of the General Clinic. When the amount of returns increases in the General Clinic, the number of discharges falls. If the amount of discharges increases, the quantity of patients registered in the Specialty Clinic falls; the more patients register in the Specialty Clinic the lower the amount of returns in General Clinic.
Figure 7. Cycle of exit into General Clinic
The diagram in Figure 8 represents the cycle of Specialty Clinic, which will be divided into smaller cycles for better understanding.
Figure 8. Casual diagram of the Specialty Ambulatory
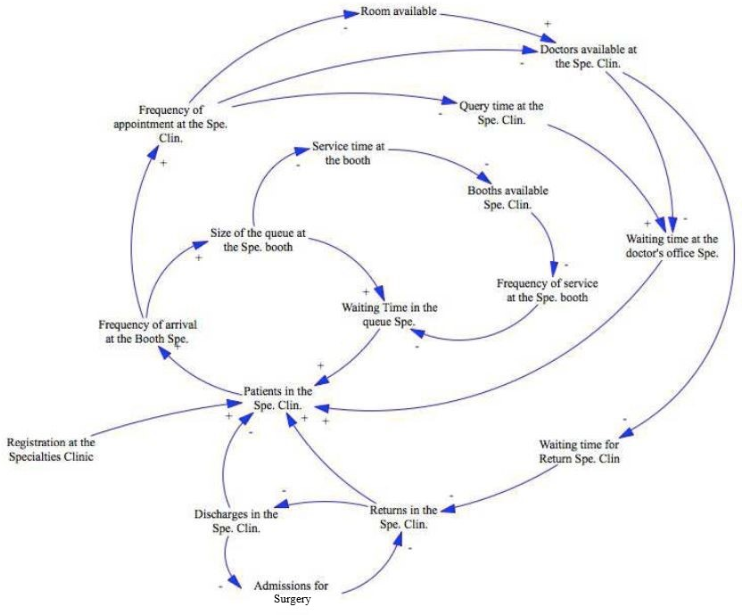
For example, the diagram in Figure 9 shows the cycle of entry in the Specialty Clinic. By increasing registrations, the amount of patients will also increase: this will make the frequency of arrival at the booth grow which, in turn, will make the queue size increase of the booth; consequently, the waiting time in the queue will be higher.
Figure 9. Cycle of entry into Specialty Ambulatory
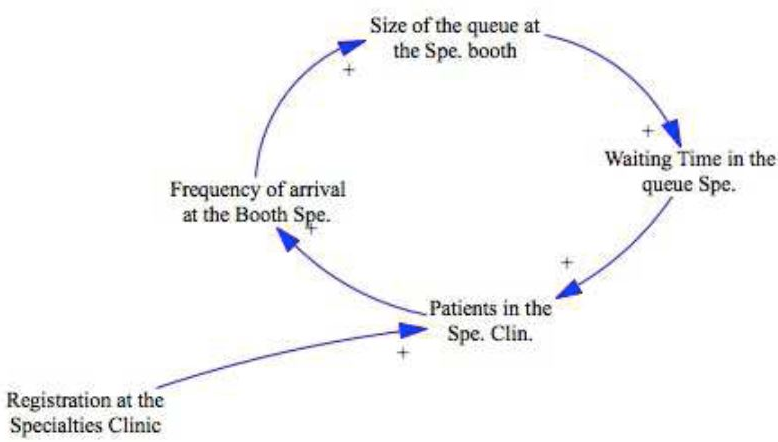
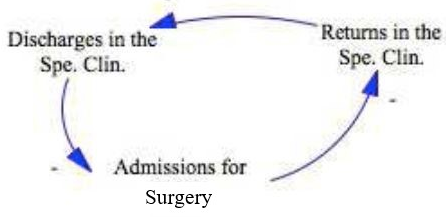
Figure 10 represents the Specialties Clinic’s output cycle. By increasing the amount of returns, the number of discharges decreases. As discharge rises, the amount of admissions for surgery falls. If the amount of admissions for surgery increases, the quantity of returns to the Specialty Clinic decreases.
Figure 10. Cycle of exit from the Specialty Ambulatory
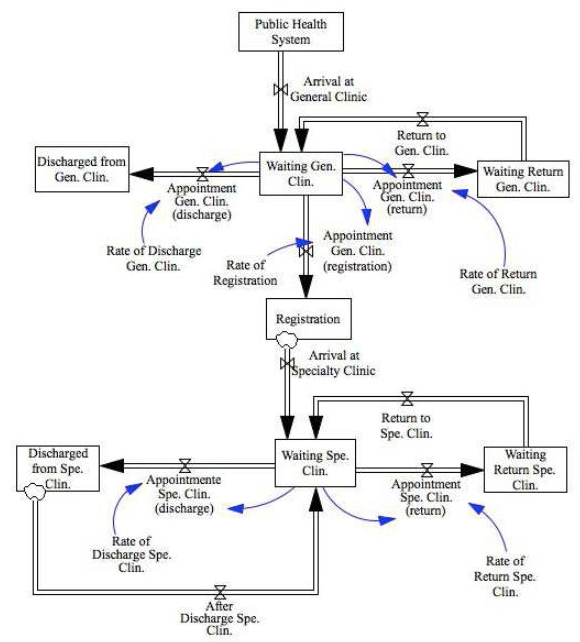
The stock and flow model was divided into two parts. Initially, a "macro" model was set up to represent the entries in the General Clinic (discharge, appointments and returns) and in the Specialty Clinic (registries and patient flow among its components). Stocks were also created, showing the amount of patients expecting returns (Appendix C).
The model begins with the entry of new patients into the system, coming from the SUS by the flow called "Arrival to the General Clinic", which ends in the "Waiting Gen. Clin" stock. With the "Return to Gen. Clin" flow. Then, the outflows of this stock are divided into three paths: a) "Gen. Clin. (Discharge)": it stocks the patients who received a medical release in stock "Gen. Clin. Download"; b) "Gen. Clin. (Return)": forwards the patients to the "Gen. Clin. This stock will be emptied when the "Return to Gen. Clin" flow sends patients to "Waiting Gen. Clin."; c) "Gen. Clin. (Register)": sends patients in stock "Waiting for Gen. Clin." for the action called "Register".
From the "Register" stock, comes the field of Clinics of Specialties, which follows the same dynamic of the General Clinic. The flows "Arrival at Spec. Clin." and "Return Spec. Clin." complete the stock "Waiting Spec. Clin.". Two flows result from that stock: a) “Appointment Spec. Clin. (Return)”: feeds the stock “Waiting Return to the Spec. Clin.” which will be emptied by the flow “Return Spec. Clin.”; b) “Appointment Spec. Clin. (Discharge)”: feeds “Discharge Spec. Clin.” that shows how many patients were discharged from the Specialties Clinic.
Stock “Discharge Spec. Clin.” feeds a flow called “After discharge Spec. Clin.” that accumulates patients in “Waiting Spec. Clin.” but it does not diminish those stocks since these patients have been discharged. This point is marked by the symbol of “cloud” placed between the outflow and the stock box. In “Registration”, this is also observable, since patients do not stop to be registered when they enter in the Specialties Clinics.
This model has its temporal unit as days and the period of the simulation will be a year (252 workdays). Data were collected from the hospital’s database. Data of incoming patients of General and Specialties Clinics has been compiled from January to September 2016, as shown in Table 1.
Table 1. Data of incoming patients
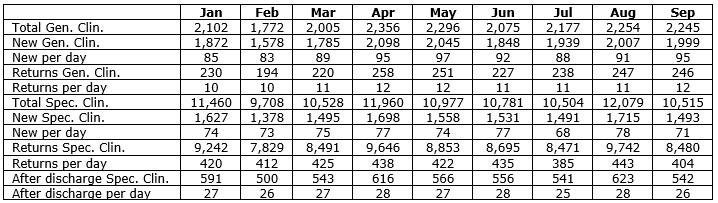
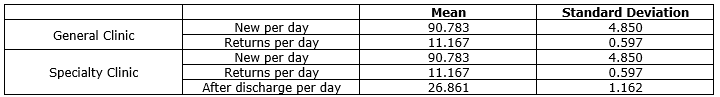
Assigning zero initial value, the equations for the stocks were performed as the difference between the input and output flows. The numbers of new appointments and returns at both clinics and after discharge at the Specialty Clinic were converted to days, and their averages and standard deviations were calculated as shown in Table 2.
Table 2. Clinics means and standard deviations
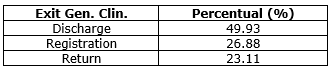
Considering the flows "Arrival in Gen. Clin." And "Gen. Clin. Return" in the General Clinic, normal distributions of probabilities were used, considering minimum and maximum values between months, and mean and standard deviations. The equations of the stock outputs "Waiting Gen. Clin." were defined as the multiplication of their respective occurrence rates by the number of patients coming from this stock. The values come from the hospital database and are available in Table 3.
Table 3. General Clinic Exit
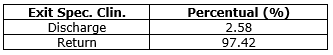
For “Arrival at Spec. Clin.”, “Return Spec. Clin.” and “After discharge Spec. Clin.” in the Specialty Clinic, normal distribution to the flows was used. Equations were performed with the minimum and maximum values of the events, their means and their standard deviations. The flows from the stock “Waiting Spec. Clin.” were determined by multiplying the rates of occurrence (Table 4) by the number of patients.
Table 4. Specialty Clinic Exit
7. RESULTS
Figure 11 shows the behavior in “Waiting Gen. Clin.”. About 90% are new patients.
Figure 11. Stock “Waiting Gen. Clin
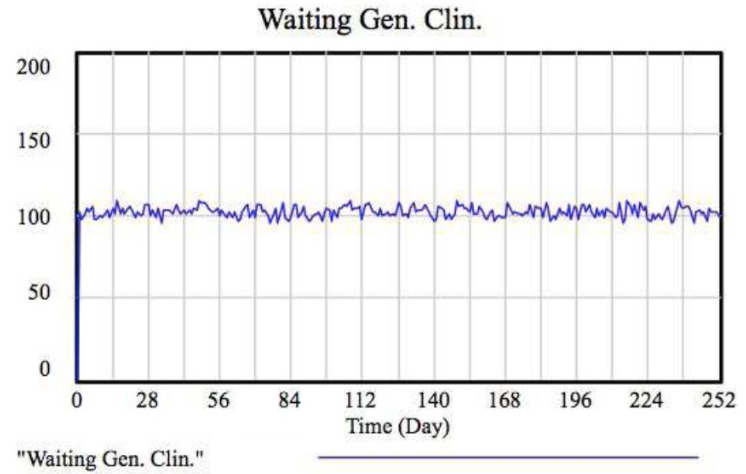
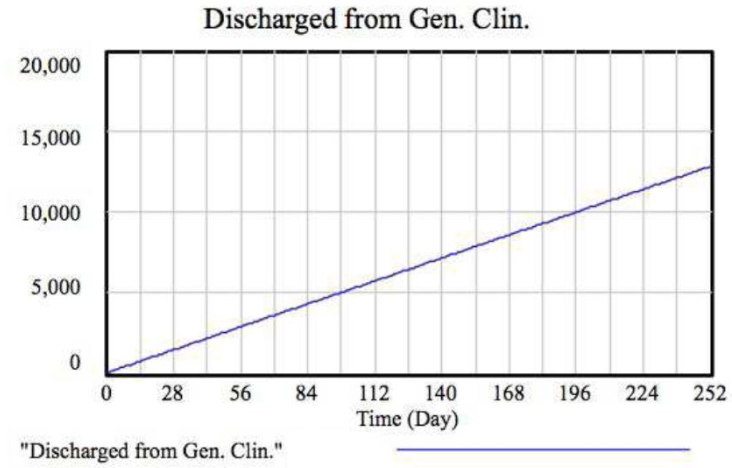
Figure 12 presents the dynamics of the General Clinic discharge. The figure presents the behavior of total discharge in one year.
Figure 12. Stock “Discharge Gen. Clin.”
The graph in Figure 13 shows what happens in “Waiting Return Gen. Clin.”: per year, the General Clinic accumulates 3,000 patients waiting for return. The returns per day have been discounted from this figure.
Figure 13. Stock “Waiting Return Gen. Clin.”
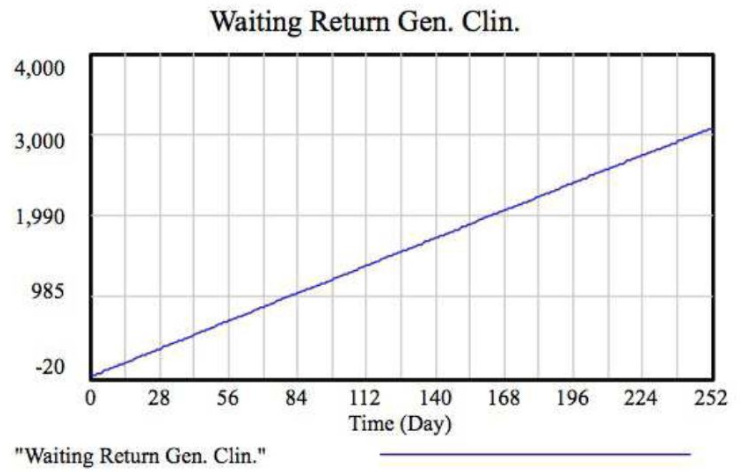
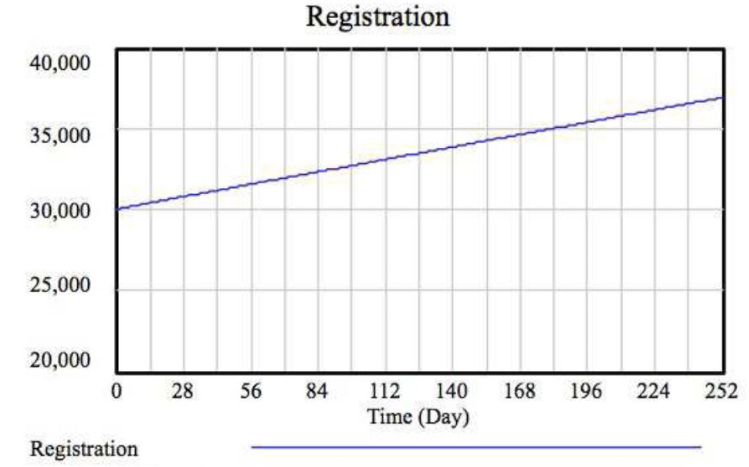
Figure 14 shows the number of registrations made during a year. In this period, 7,000 patients were treated in Specialties Clinic.
Figure 14. Stock “Registration”
The graph in Figure 15 presents the admission of patients in the Specialties Clinic. The average is 500 patients and approximately 400 are returns.
Figure 15. Stock “Waiting Spec. Clin.”
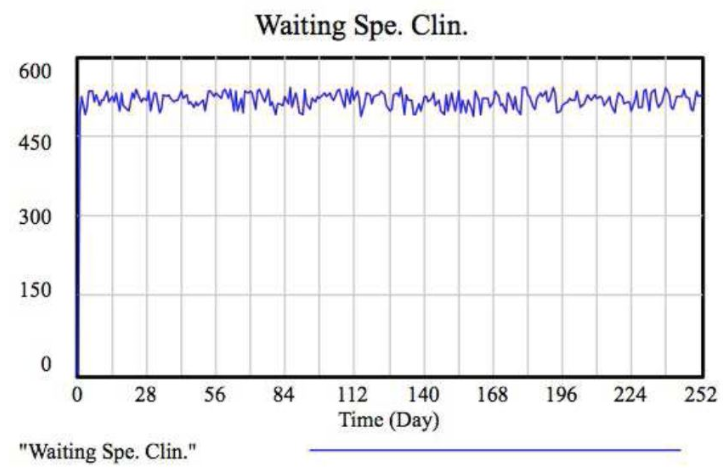
Figure 16 shows the “Discharge Spec. Clin.” dynamics. The Specialties discharge in one year is about 3,400 patients. For this reason, the total amount of patients waiting return is large (Figure 17).
Figure 16. Stock “Discharge Spec. Clin.”
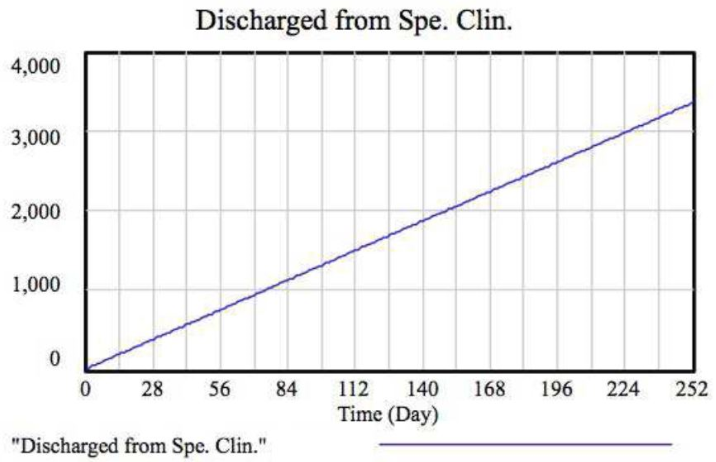
Figure 17. Stock “Waiting Return Spec. Clin.”
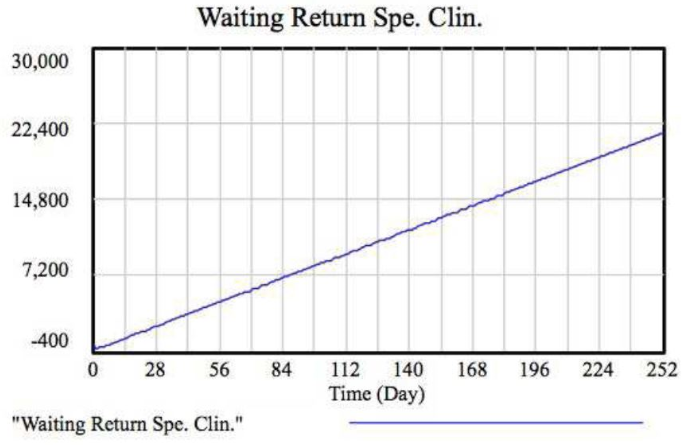
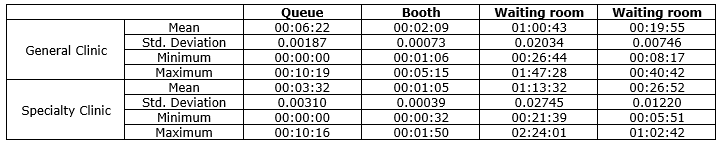
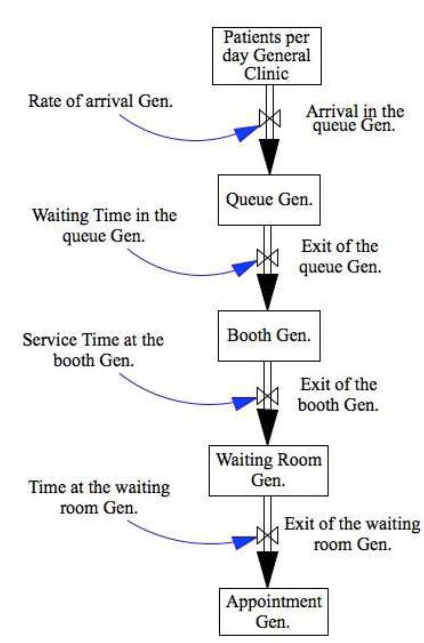
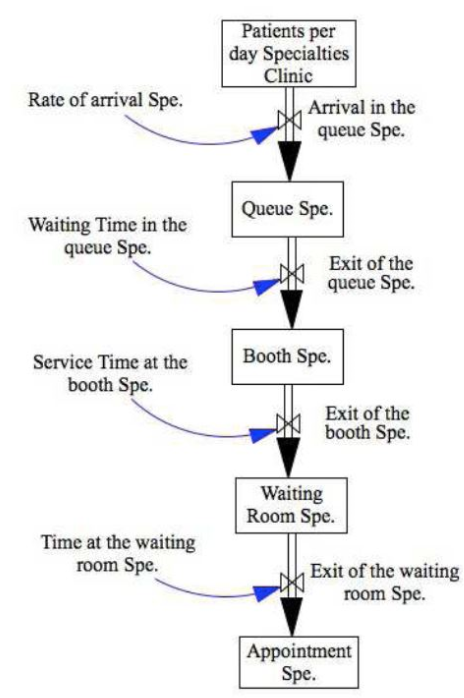
A smaller model presents the operation of stocks “Waiting Gen. Clin.” and “Waiting Spec. Clin.” (Appendices C and D). The simulation period is one workday (600 minutes). The auxiliary variables used were the average waiting times, using a normal probability distribution. The times come from a chrono analysis. Table 5 summarizes the results.
Table 5. Waiting times
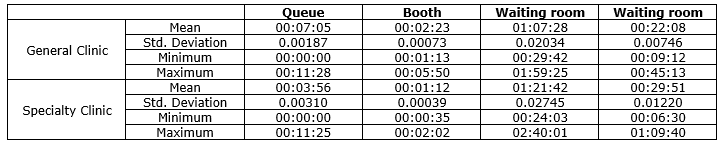
The waiting time in the queue, in the booth and in the waiting room were considered auxiliary variables with normal distribution probabilities. Flows were defined by the formula Smooth. Figure 18 presents the “Arrival at General queue”.
Figure 18. Stock “Arrival at General queue”
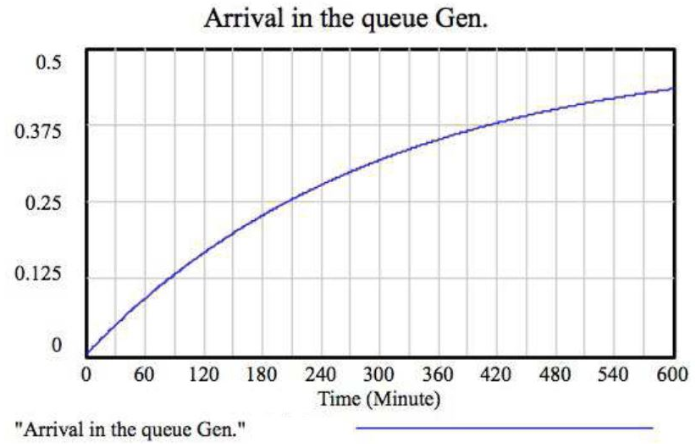
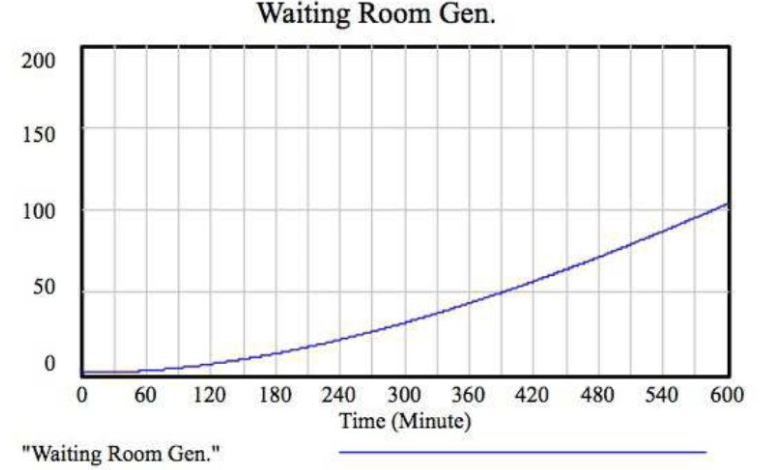
Figure 19 presents the dynamics of “General Waiting Room”. About 100 patients could be attended daily in the General Clinic.
Figure 19. Stock “Arrival at General queue”
The strategy was similar to the Specialties Clinic and Figure 20 presents the dynamics of “Specialties Waiting Room”.
Figure 20. Stock “Specialties Waiting Room”
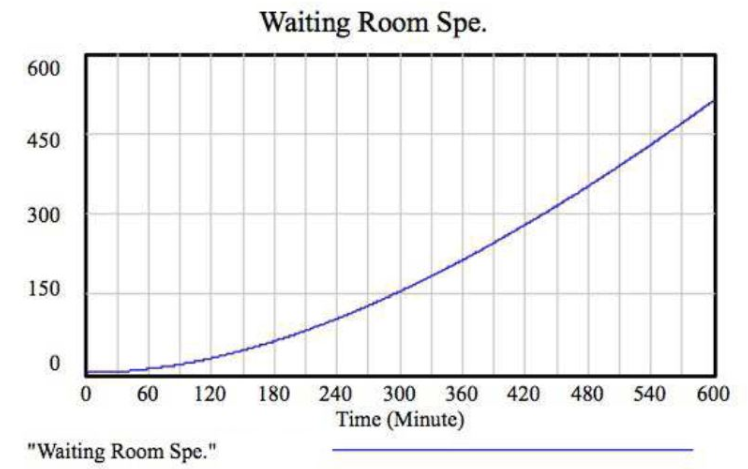
Table 6 presents the waiting times used in the first model of this “micro”, reduced by 10%. The proposal was to evaluate the impacts if the waiting times were passive of reduction.
Table 6. Waiting times reduced
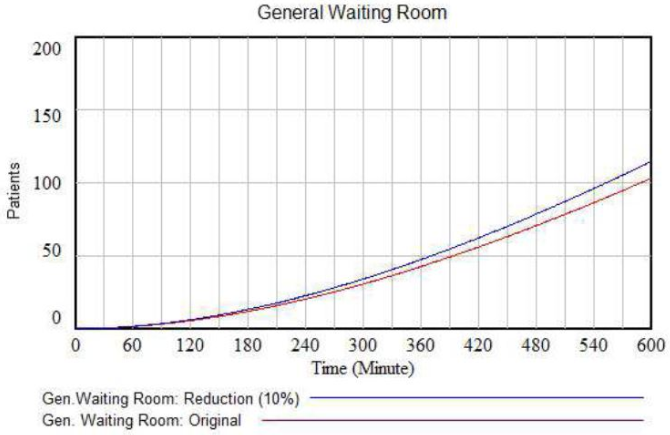
The Figures 21 and 22 show, respectively, the results achieved when there is a 10% reduction in waiting times. When reducing 10% of waiting times, the difference in the General Waiting Room is 12 more patients and in the Specialties it is 57 more patients.
Figure 21. Stock “General Waiting Room” after reduction
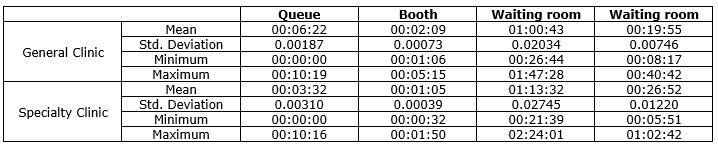
Figure 22. Stock “Specialties Waiting Room” after reduction
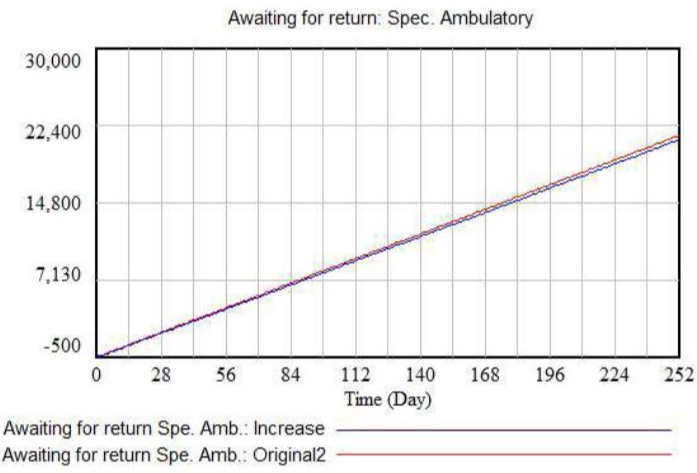
This difference was inserted in the model “macro”, generating a reduction in the number of patients awaiting return (Figures 23 and 24).
Figure 23. Stock “expected return General Amb.” with increased returns per day
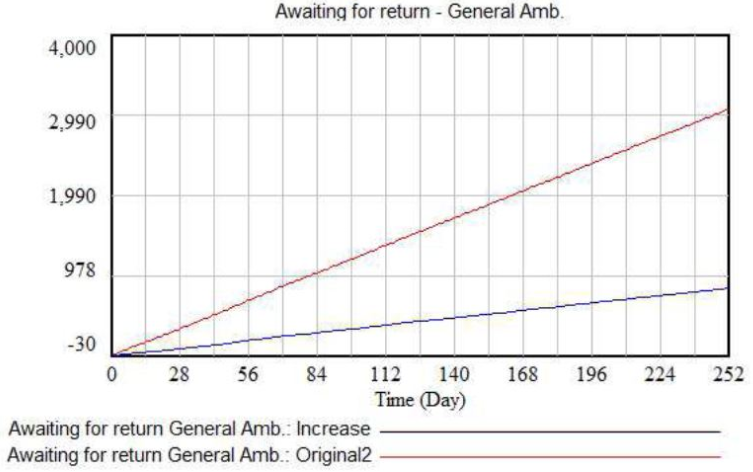
Figure 24. Stock “expected return Amb. Esp” with increased returns per day
Figures 25 and 26 show the impact on the discharges in the General and Specialties Ambulatories.
Figure 25. Inventory “High Amb. General” with increased returns per day
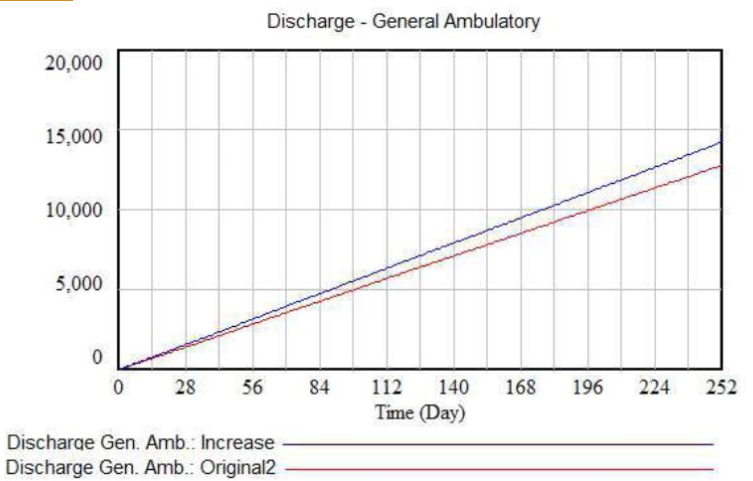
Figure 26. Inventory “High Amb. Esp.” with increased returns per day
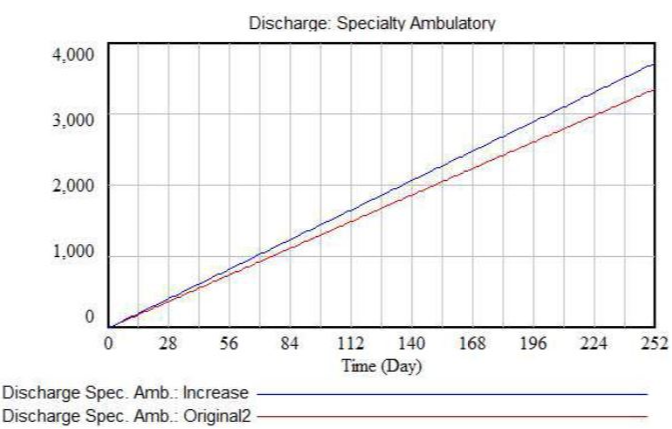
The increase in the number of queries produces an increase in discharges. The difference in the General Outpatient Clinic was about 1,500 per year and in the Ambulatory of Specialties was about 300 year.
8. DISCUSSION
System dynamics is suitable to model and simulate complex systems. In this study, this technique was applied to the Public Health system. The system dynamics analyses provide an evaluation of the system without separating the impacts of each variable.
One proposal of the simulation was to reduce the waiting times in 10% and evaluate the impact of this change in the whole system. In “General Clinic”, outpatient grew by 12 patients attended per day and in “Specialties Clinic” by 57 patients per day.
The reduction in waiting times provides us with the understanding that the returns affect the system considerably. This fact leads us to a conclusion that decreasing time in the waiting room of the doctor’s offices is mandatory. This will give flexibility to Ambulatory, i.e. the faster the patients’ return the more will be given discharge.
The Causal Diagram also proves this fact for both the General Outpatient Clinic as for the Specialties Clinic. Analyzing the Causal Diagram, the variables that directly influence the waiting time in the office are the query time and the availability of doctors. Thus, one way to reduce the time in the waiting room is by reorganizing the work of the clinic medical staff in some of the following ways: a) Increasing the number of doctors; b) Investing in specific training for the clinical staff, in computer science, so they handle electronic systems more efficiently; c) Build a database accessible to the medical staff containing all patient information and their history in outpatient clinics.
9. CONCLUSIONS
Several papers in the literature use DES for modeling and analyzing health care systems. On the other hand, the system dynamics approach has been increasing with promising applications and results in this subject. This work contributes with the health care subject applying the system dynamics theory for analyzing the flow of patients in the biggest Brazilian cardiology hospital. As the hospital depends on the government funds, it suffers from lack of investment. The results of this study should support the decision makers, because they show the interactions among the subsets of the whole system. This is supported by the methodology proposed since new scenarios can reveal the system behavior in future situations. This is one of the advantages of using the systems dynamics tool. The main contribution of the paper, when analyzing the literature, is to apply the system dynamics theory in a Brazilian public hospital. The literature review shows that there is a lack of applications of this theory in Brazilian health care systems. Finally, from the results, the decision makers, and more specifically the politicians, can think about public politics to improve the hospital’s performance.
A - Clinic Flow Chart
B - Stock and Flow Diagram of the Clinic
C - Stock and Flow Diagram of Waiting in the General Amb.
D - Stock and Flow Diagram of Waiting in the Clin. Spec.
Acknowledgements
This study was financed in part by the Fundação Amparo à Pesquisa do Estado de São Paulo – Brasil (FAPESP) – number 201450016 and Ministério da Saúde – Políticas Públicas do Sistema Único de Saúde – Brasil (PPSUS).
REFERENCES
Alonge O, Lin S, Igusa T, Peters DH (2017) Improving health systems performance in low-and middle-income countries: a system dynamics model of the pay-for-performance initiative in Afghanistan. Health Policy and Planning 32: 1417–1426.
Atkinson JM, Wells R, Page A, Dominello A, Haines M, Wilson A (2015) Applications of system dynamics modeling to support health policy. Public Health Res Pract. 25(3):e2531531.
Andrade L, Lynch C, Carvalho E, Rodrigues CG, Vissoci JRN, Passos GF, Pietrobon R, Nihei OK, Carvalho MDB (2014) System Dynamics Modeling in the Evaluation of Delays of Care in ST-Segment Elevation Myocardial Infarction Patients within a Tiered Health System. PLoS ONE 9(7): e103577.
Barrocal A and Nassif MI (2011) Brasil 72 no ranking da OMS de gastos per capita em saude. http://www.cartamaior.com.br/templates /materiaMostrar.cfm?materia id=18472.
Borshchev (2013) A The Big Book of Simulation Modeling. AnyLogic North America.
Chang Jr J, Souza Santos SB, Fernandes MAS (2015) Dynamic Systems Applied to Bed Management in a Public Hospital Specialized in Cardiology. POMS 25th Annual Conference, 2014.
CNI (2013) – National Confederation of Industry and IBOPE – and IBOPE – Brazilian Institute of Public Opinion and Statistics. http://www.fiepr.org.br/sombradoimposto/News14468content162024.shtml
Cosenz F, Noto G (2016) Applying System Dynamics Modeling to Strategic Management: A Literature Review. Systems Research and Behavioral Science 33: 703-741.
Currie DJ, Smith C, Jagals P (2017) The application of system dynamics modeling to environmental health decision-making and policy - a scoping review. BMC Public Health 18(402): 1-11.
Edaibat EA, Dever J, Stuban SMF (2017) System dynamics simulation modeling of health information exchange (HIE) adoption and policy intervention: A case study in the State of Maryland. Operations Research for Health Care 12: 60–70.
El-Darzi E, Vasilakis C, Chaussalet T and Millard P (1998) A simulation modeling approach to evaluating length of stay, occupancy, emptiness and bed blocking in a hospital geriatric department. Health Care Management Science 1: 143–149.
Forrester JW (1958) Industrial dynamics—a major breakthrough for decision makers. Harvard Business Review 36(4): 37–66.
Forrester JW (1961) Industrial Dynamics. Cambridge: MIT Press.
Fu MC (2014) Handbook of Simulation Optimization. Springer.
Griffin J, Xia S, Peng S and Keskinocak P (2012) Improving patient flow in an obstetric unit. Health Care Management Science 15: 1–14.
Hill A and Camacho OM (2017) A system dynamics modeling approach to assess the impact of launching a new nicotine product on population health outcomes. Regulatory Toxicology and Pharmacology 86: 265-278.
Hillier FS and LIEBERMAN GJ (2014) Introduction to Operations Research. Bookman.
Li J, Zhou M, Guo T, Gan Y and Dai X (2014) Robust control reconfiguration of resource allocation systems with petri nets and integer programming. Automatica 50:915–923.
Liu S, Xue H, Li Y, Xu J, Wag Y (2018) Investigating the Diffusion of Agent-based Modeling and System Dynamics Modeling in Population Health and Healthcare Research. Syst. Res 35: 203–215.
Lyons GJ and Duggan J (2015) System dynamics modeling to support policy analysis for sustainable health care. Journal of Simulation 9(2): 129-139.
Madachy JM (2007) Software Process Dynamics. IEEE Press, New Jersey: John Willey & Sons.
McClean SI and Millard PH (1998) A three compartment model of the patient flows in a geriatric department: a decision support approach. Health Care Management Science 1: 159–163.
Moreno L, Aguilar RM,Martin CA, Pineiro JD, Estevez JI, Sanchez JL, Sigut JF and Jimenez VI (1998) Patient-centered computer simulation in hospital management. Journal of Network and Computer Applications 21: 287–310.
Moreno L, Aguilar RM, Martin CA, Pineiro JD, Estevez JI, Sigut JF, Sanchez JL and Jimenez VI (1999) Patient-centered simulation tool for aiding in hospital management. Simulation Practice and Theory 7: 373–393.
Newell B and Siri J (2016) A role for low-order system dynamics models in urban health policy making. Environment International 95: 93-97.
Ogata K (1998) System Dynamics. Upper Saddle River, New Jersey: Prentice Hall.
Oliveira MJF (1994) A patient-oriented modeling of emergency admission system of a Brazilian hospital. EURO XIII Conference: 19–22.
Rardin RL (2000) Optimization in Operations Research. Prentice Hall.
Rau CL, Tsai PFJ, Liang SF, Jhih-CianTan, Syu HC, Jheng YL, Ciou TS and Jaw FS (2013) Using discrete-event simulation in strategic capacity planning for an outpatient physical therapy service. Health Care Management Science 16: 352–365.
Reynolds M, Vasilakis C, McLeod M, Barber N, Mounsey A, Newton S, Jacklin A and Franklin BD (2011) Using discrete event simulation to design a more efficient hospital pharmacy for outpatients. Health Care Management Science 14: 223– 236.
Rohleder TR, Lewkonia P, Bischak DP, Duffy P and Hendijani R (2011) Using simulation modeling to improve patient flow at an outpatient orthopedic clinic. Health Care Management Science 14: 135–145.
Scopus (2019) Analyze search results. https://www-scopus.ez328.periodicos.capes.gov.br/term/analyzer.uri?sid=f708f0d1b64024eb9ce9c072cd43ac4b&origin=resultslist&src=s&s=TITLE%28%22Health%22+AND+%22System+Dynamics%22%29&sort=plf-f&sdt=b&sot=b&sl=37&count=62&analyzeResults=Analyze+results&txGid=6417ed1089fa2269754e01ac48c7d831
Seila AF (1995) Introduction to simulation. Winter Simulation Conference, Proceeding: 126–138.
Semwanga AR, Nakubulwa S, Adam T (2016), Applying a system dynamics modeling approach to explore policy options for improving neonatal health in Uganda. Health Research Policy and Systems 14(35): 1-17.
Shi J, Peng Y, Erdem E (2014), Simulation analysis on patient visit efficiency of a typical a primary care clinic with complex characteristics. Simulation Modeling Practice and Theory 47: 165–181.
Thorwarth M and Arisha A (2009) Application of discrete-event simulation in health care: a review. Dublin Institute of Technology - Reports. Paper 3: 1–32.
Thunhurst C (2012) Public health systems analysis the transfer of learning between developed and developing countries. Health Care Management Science 15: 283291.
Valdmanis V, DeNicola A and Bernet P (2015) Public health capacity in the provision of health care services. Health Care Management Science 18: 475482.
Xie T, Liu W, Anderson BD, Liu X, Gray GC (2017) A system dynamics approach to understanding the One Health concept. PLoS ONE 12(9): e0184430.
Yafei W (2018) Evaluation system construction of health policy based on system dynamics and complex network. Cluster Computing https://doi.org/10.1007/s10586-018-2225-9.
Received: 16 May 2018
Approved: 26 Dec 2018
DOI: 10.14488/BJOPM.2019.v16.n1.a2
How to cite: Chang Junior, J.; Lima, F.; Fernandes, A. M. S. et al. (2019), “Computer Simulation Model for Outpatient Clinics in a Brazilian Large Public Hospital Specialized in Cardiology”, Brazilian Journal of Operations & Production Management, Vol. 16, No. 1, pp. 14-32, available from: https://bjopm.emnuvens.com.br/bjopm/article/view/495 (access year month day).