The social network analysis and its contribution to the mapping of scientific production in postgraduate programs
Haydée Maria Correia da Silveira Batista
haydeemcsb@gmail.com
Maria Deodora Gomes Correia e Vasco da Silveira Batista, Portugal.
Martius Vicente Rodriguez y Rodriguez
martiusrodriguez@id.uff.br
Universidade Federal Fluminense – UFF, Niterói, Rio de Janeiro, Brazil.
Keren Ane Wandresen Cardoso
keren_ane@id.uff.br
Institution, City, State, Country
Helder Gomes Costa
helder.uff@gmail.com
Institution, City, State, Country
Ana Claudia Dias
missdias@gmail.com
Institution, City, State, Country
ABSTRACT
This article aims to identify the contribution that the Social Network Analysis (SNA) can offer to the construction of the scientific production in postgraduate programs in Federal Institutions of Higher Education in Brazil.
For that, a qualitative and quantitative analysis of 184 dissertations of a stricto sensu postgraduate program of the Federal Fluminense University, during the period from 2015 to 2016, was carried out, emphasizing its network of relationships focused on knowledge areas and on the respective teachers as counselors, participants and guests of the thesis defenses, using the Ucinet software. Based on the literature review, a detailed analysis of the academic work of these two years was also elaborated based on the data registered in the Capes Platform, Sucupira database and on the website of the Laboratory of Technology, Business Management and Environment of the Fluminense Federal University (LATEC / UFF). The themes of the areas of knowledge, trends, and evolution were also analyzed over the periods studied. It is concluded that the results of this system applied in a case, demonstrated the feasibility of the evaluation of the individual attributes and also of the networks as a whole, offering a comparative of their evolution in these two periods explored, thus demonstrating the valuable contribution of SNA in scientific production.
This study revealed, at the time of the research, the construction of a first academic social network in this postgraduate program.
Keywords: Knowledge Management; Social Networks; Social Networks Analysis; Ucinet.
INTRODUCTION
This research presents a proposal for guidelines, for the use of Social Network Analysis or more commonly known as SNA already consolidated abroad, but more recent in Brazil and it allows studying and understanding the process of information exchange.
Nowadays, the Internet has not only become an important means of communication among people, but it has also presented us with new organizational environments for sharing knowledge through group information (Zhen, 2010), as in the case of Social Networks.
It is argued that a social network approach is useful to deal with the complexities associated with the attempt to integrate various levels of analysis; in the understanding in terms of how the social structure is created through individual action; in determining how social structure restricts collective action and in explaining how attitudes and behaviors are determined by the social context in which the action occurs (Marsden; Lin, 1982).
The strength of SNA lies in its ability to make sense to social aspects of the organization and cannot be adequately explained only by the collection of behavioral or attribute data.
Social Networking Analysis can be applied to many different study areas (Molm, 1997). An extensive list of possible applications is suggested by Wasserman, and Faust (1994) that identifies topics ranging from the study of personal beliefs to the world economic system.
The SNA has been used to assist researchers in the description of empirical phenomena, where the interactions among actors of a given social scope are relevant (Pereira et al., 2007).
As a fundamental question, the absence of a systematic support for the management of scientific production in postgraduate programs generated the need for the development and application of an SNA system to support the management of scientific production in postgraduate courses, thus investigating the contribution of Social Network Analysis to postgraduate programs.
That way, the study described in this paper demonstrates how SNA can be applied to analyze the development of a specific group of scientific research in the concept of social network in a dynamic perspective.
This work is structured with the following sections: Introduction, literature review, studies carried out on the topic, methodology used, conclusions of the research from the results obtained, and suggestions for further research that may be carried out in the future.
BIBLIOGRAPHIC REVIEW
This section presents a literature review on the concepts, definitions and practices of Social Networks, Social Network Analysis, and Knowledge Management, in this case coming from scientific production in postgraduate programs.
Social Networks
It is observed that, since remote times, the networks were already manifestation of the construction of the collective knowledge, and the networks of the social organizations were previous to the electronic networks. According to historical narratives, the first scientific networks emerged about 200 years ago (Stockinger, 2002).
Etymologically, the word "net" derives from the Latin (retis) and means "intertwining of yarns, ropes or wires with openings fixed by meshes, forming a kind of fabric". Starting from the perception of reticulated structure and interlacing, this word has gained over time new meanings and interpretations progressively interdisciplinary (Loyola; Moura, 1997).
On the information age, networks are considered a set of interconnected nodes, that is: "Networks are open structures capable of expanding in an unlimited way, integrating new nodes as long as they can communicate within themselves, i.e. provided they share the same communication codes as, for example, knowledge values or goals. A network-based social structure is an open, highly dynamic system susceptible to innovation without threats to its equilibrium" (Castells, 1999, p.498).
In sociology a "network" is composed of individuals, collectives or roles united in a social relation (Marshall, 1998).
Examples of such "social" relationships include kinship, community structure, communication, friendship, authority, and chain of organizations (Marshall, 1998; Scott, 2000). They can focus on a person, a group, an organization, or a set of organizations (Monge, 1987).
Networks are present in most situations and often draw people into several of them constantly without even realizing it. A social network is described as groups of people or organizations linked by individuals who know each other, be it through friendship, political alliances or professional collaboration. Progressively, the technologies and social institutions upon which people depend are clearly organized, according to the networks configuration (Baum, Rowley and Shipilov, 2004).
Networks are portrayed as a set of nodes that are connected by edges (connections) related to some type of interaction (Newman, 2003).
In the case of a social network, the node can be called as an actor, which is the basic element of a network. Any entity in the social context is interpreted as an actor. They are examples of nodes, a person, an organization, a group, a concept, etc. Edge, in the social context, means the relationship or the social bond, which represents a specific relationship bond between two nodes or network actors, such as relations of friendship, kinship or an area of knowledge.
Social Network Analysis
Social network analysis is based on the evaluation of empirical data and can provide an appropriate approach to identify knowledge, scientists, institutions, and groups. It also offers highly interesting information to understand the nature and structure of relationships and interactions within a scientific community.
Some of the pioneers of Social Network Analysis (SNA), such as Wasserman and Faust highlight the contributions of various disciplines to the development of the SNA when they claim that the "Social Network Analysis (SNA) concepts are developed from the propitious meeting of theory and social application, with formal mathematical knowledge, and statistical and computational methodology "(Wasserman; Faust, 1994, p.10).
In fact, the origins of SNA were traced back to the mathematical development of Euler, a graph theory from the first half of the eighteenth century (Otte; Rousseau, 2002).
According to Scott (2000), the contemporary SNA developed from three traditions led by: sociometric analysts interested in small groups and group theory; Harvard researchers in the 1930s and 1940s, inspired by the work of French sociologists, Durkheim and the British anthropologist Radcliffe-Brown, interested in relationships and in the formation of exclusive groups, such as the group Warner and Mayo, whose involvement in Hawthorne's studies, at the Chicago electrical plant, was fundamental on the development of SNA through the use of sociograms to understand and represent the structure of the group; and Manchester anthropologists, such as Barnes, Mitchell, Bott and Gluckman, who were interested in community relations in tribal and village societies.
This approach has often been used to study collaborative research and involves networks that are a class of social networks that illustrate collaboration based on presence as collaborators in scientific research. This publication data can also be used to explore and visualize collaborative research across institutions and countries.
Social Networking relationships can be examined through the Social Network Analysis (SNA) described by Scott (2000, p. 37) as "an orientation to the social world that inherits a particular set of methods."
Structural or relational data are collected from a community to test behavioral theories. The central theoretical concepts about the relational structure of a group or of a social system can be translated into formal definitions expressed in terms and relational patterns (Wasserman; Faust, 1994).
The properties of the relational structure of the operating environment help the researcher to understand the characteristics of the units under investigation and to make formal statements about them. In the case reported here, SNA was used to explore social interaction and "conscious knowledge" relationships among individual members of a scientific community.
It overcomes the validation problems associated with scaling the aggregation of attributes and individual perceptions in an attempt to represent a unit of analysis. Taking into account important relations or collective attributes, through the use of Social Network Analysis it is possible to provide a more representative image of the system under investigation (Monge, 1987).
The analysis of social networks or structural analysis is a methodological tool with theoretical ratification that allows knowing the interactions between individuals, groups or organizations based on quantitative and qualitative data, being the last essential to develop the perception of the relations between the actors. These data enable the reproduction of graphs (network graphs). This visualization offers a radiographic image of the scenario of the situations that are sought to be analyzed, being one of the great contributions of the SNA to the knowledge (Silva et al., 2013).
In Figure 1, below, a network graph of unidirectional and bidirectional flows is shown.
Figure 1. Example of network graph of unidirectional and bidirectional flows
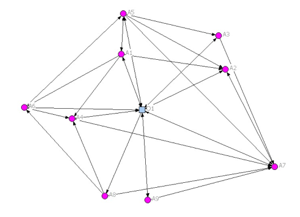
Source: The authors themselves - generated by Ucinet software (2017)
Social Network Analysis is portrayed as a tool for the study of social groups in general, a metric for measuring relationships, links and intercommunications, as constituents of social structure (Meneghelli, 2009).
Knowledge Management
Knowledge Management is part of this study if it is observed that, in the era of intellectual capital valorization, the main objective is to demonstrate how the use of SNA strategic tools (social network analysis) can contribute to increasing the flow of information and connections, enhancing the decision-making process and the expansion of the knowledge of the individuals connected to it.
The knowledge-based organization becomes unique by being able to learn and innovate constantly (Choo, 2003). In this new practice of social relations, interaction and communication become part of the course of knowledge construction and, as such, organizations offer knowledge creation environments that allow interaction between their members and the sharing of information.
The marked transformations that are taking place in the modern world are, in some way, linked to the concept of Social Networks (Ugarte, 2007).
Knowledge management (KM) refers to any orderly effort made by the institution to create, use, retain and measure its internal and external knowledge. This Management necessarily passes from the sharing of the individual knowledge to the formation of the organizational knowledge. In this way, the person who owns the knowledge is the one who decides whether to share it or not (Serafim Filho, 1999).
This type of management is subject to the organizational culture, mainly by working with the informal flows of information. It is very important to develop an organizational culture that creates and expands a procedure that involves sharing, socializing and transferring knowledge.
Knowledge Management, in this current moment of valorization of intellectual capital, has as its main objective to demonstrate how the use of strategic tools of social network analysis can contribute to increase the flow of information internal and external to the organization through its connections, thus helping to strengthen the decision-making process and the expansion of the knowledge of the individuals connected to it. For the implementation of KM in an enterprise environment, it is necessary to architect a culture that allows sharing knowledge and creating environments for tacit knowledge transfer. Working with informal information flows demands an organizational culture that is inclined to the socialization or cooperative integration of knowledge. Thus, social networks are evidenced as an important tactic of information and knowledge sharing (Neves; Longo, 1999).
For Sveiby (1998), the structuring of knowledge in the organizational conjuncture also occurs from the social networks that are attributed to the boundaries of individuals within the organization. Consequently, social networks can develop through working relationships, friendship or simply interests in common and may even exceed organizational boundaries extending to the environment outside the organization. Therefore, many applications of social network analysis have been used in multiple ways in the area of Knowledge Management, such as: application of social network analysis in knowledge management diagnostics; in change management; in communities of practice and management of skills, etc. (Guimarães; Melo, 2005).
According to Schreiber et al. (2000), Knowledge, as engineering, has helped the SNA area in a number of ways, since Social Networks present a rather illustrative analogy: just as electrical engineering offers theories, methods, and techniques for building automobiles, knowledge engineering equips SNA with a scientific methodology to analyze and engineer knowledge. The purposes of the area of Knowledge Engineering encompass the research and development of techniques and tools for its formalization, codification and knowledge management; structure analysis mechanisms and methodologies coordinated by professionals in intensive knowledge practices; and research and development of knowledge systems. In the current universe, Knowledge Engineering offers methods for understanding the structures and processes used by users of knowledge in the domain, incorporating information technology in the support of SNA. That way, the knowledge professional acts between technology and management.
The process of Knowledge Management in organizations can happen in a similar way to KM in the environment of a Higher Education Institution, since it can be understood as the process of creating a teaching-learning environment, based on creativity, judgment and dialogue among individuals who, in the knowledge society, need to develop pro-activity, flexibility, multidisciplinarity and openness to new teachings (Sveiby, 1998).
Ucinet
The Ucinet software is the Social Network Analysis tool used in this work. It provides the design of the analyzed network and allows identifying different metrics used in the quantitative analysis. The data is manipulated through matrices. This social networking analytics software was developed by Steve Borgatti, Everett and Martin Freeman Lin. The program is distributed by Analytic Technologies and works in conjunction with the freeware Netdraw program.
The graphs and general results that will be seen in the course of this work were provided by Ucinet in conjunction with the Netdraw program.
METHODOLOGY
The research method chosen for the development of this study is the action research. Action research seeks to contribute to the practical interests of people in an immediate questionable situation (Myers, 2010).
The intention of the action research is to change conjunctures so that they may be seen as preferable, either by the researcher or by the groups in the investigated situation, obtaining some hypothetical conclusions from the process. Action research requires the researcher to have a precise and comprehensive understanding of the situation under study before taking any action towards the outcome of the problems identified. As a result of analyzes, there is the generation of knowledge (Trauth, 2001).
This research has a descriptive-analytical character. Descriptive in that it seeks, starting from the approach of the analysis of social networks between members of an institution of higher education, to characterize the position of the relations between them versus the areas of knowledge searched there. As for its analytical character, it consists in the verification of the existence of associations between centrality, type of cohesion of the actors in the network and its respective group and structure in what concerns the area of knowledge.
This structural analysis will focus on several actors who are linked to the same organization, who, regardless of knowing, receive and share multidisciplinary information, pertinent to the social or organizational system to which they belong – in this case, specific areas of knowledge in the university.
In this work, the entire scientific production of the Master's Degree in Management Systems - MSG, (stricto sensu postgraduate program), of the Fluminense Federal University, located in Niterói, RJ, during the periods of 2015 and 2016 was taken into account.
For a better understanding of the elaboration of this research, Table 1, below, illustrates the steps developed.
Table 1. Research development steps
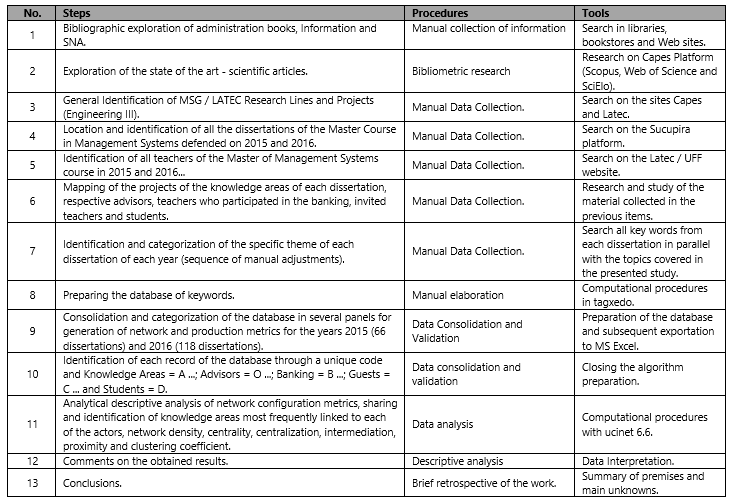
Source: The authors themselves (2017)
A Bibliometric research was done through the bibliographic exploration in the main databases of the Portal of Periodicals of the Capes Platform, where two databases, Scopus and Web of Science, were selected and were both accessed in October and November of 2017. In addition, studies were carried outin libraries of Administration where literature (books) that approached the subject in question was found. The keywords used were: Social Networks, Social Network Analysis, Knowledge Management, and Ucinet.
This research resulted in the study of 41 articles, 29 books and eight masters’ and doctoral defense thesis, as well as four Web queries on the Harvard Analytic Technologies website on the Ucinet software and the Netdraw program, according to Figure 2 below.
Figure 2. Literature productions researched and used, participation by category
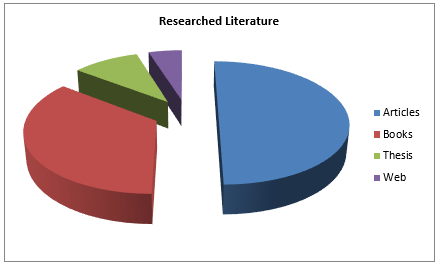
Source: prepared by the authors themselves (2017)
Data collection was initiated through a research on the Sucupira platform and at the Capes website, taking into account the entire scientific production of the Management Systems Masters course - MSG, (stricto sensu postgraduate program), of the Fluminense Federal University, located in Niterói, RJ, during the periods of 2015 and 2016.
First, all the dissertations of 2015 (a total of 66) and then the dissertations defended in 2016 (total of 118) were searched.
The orientation of the production of the scientific research of all the students of a postgraduate course and respective collaboration of the counselors, teachers and invited participants of the respective thesis defense were compiled and analyzed. The areas of knowledge, the research projects, the key words of each dissertation, and the respective students were filtered.
From this same platform it was extracted, in addition, the list of all teachers of this postgraduate Masters in Management Systems course of the Fluminense Federal University.
Subsequently, the Research Lines and Projects related to a postgraduate course of the UFF were located and identified on the Capes website and on the LATEC website, as can be seen in Table 2, below.
Table 2. Lines versus MSG / LATEC course research projects (engineering III)

Source: prepared by the authors themselves (2017)
With the data at hand we started the recognition of each dissertation, mapping areas of knowledge, respective advisors, teachers and invited teachers who participated in the respective thesis defense and students.
After this analysis, the study of the object of the research of each dissertation/thesis was performed, considering the Line and Project of the research, establishing a parallel with the most repeated keywords in the study, analyzing the title of dissertations and checking abstracts for the delineation of the real subject of each dissertation of each year.
In Figures 3 and 4, below, one can observe the graph of the Research Lines and of the Research Projects identified in the periods studied.
Figure 3. Graph of the Lines of Research studied and identified in 2015 and 2016
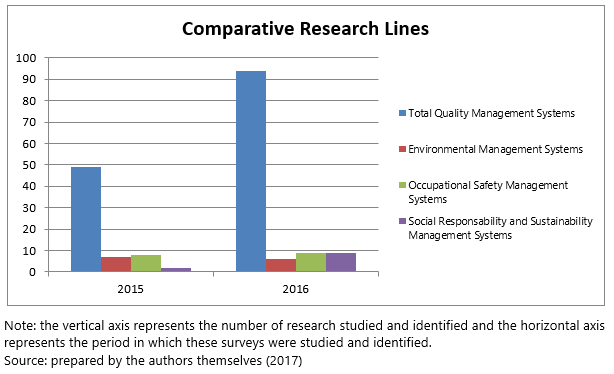
Figure 4. Graph of the Research Projects addressed and identified in this study, in 2015 and 2016
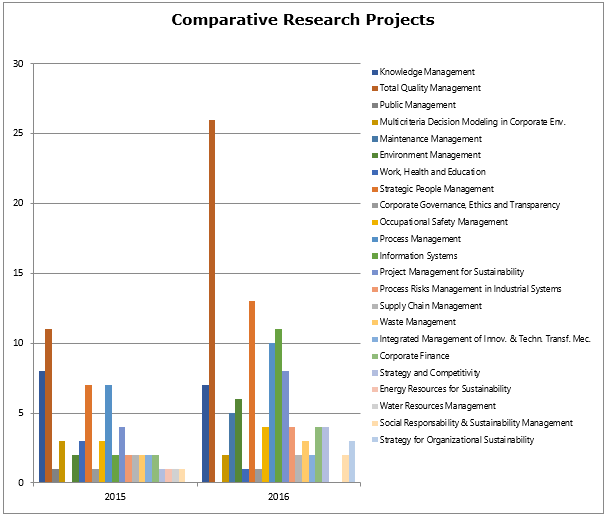
Source: prepared by the authors themselves (2017)
Figure 5, below, shows the type of participation of the network actors that were analyzed.
Figure 5. Graph of the type of participation identified in the survey of network actors to be analyzed in 2015 and 2016
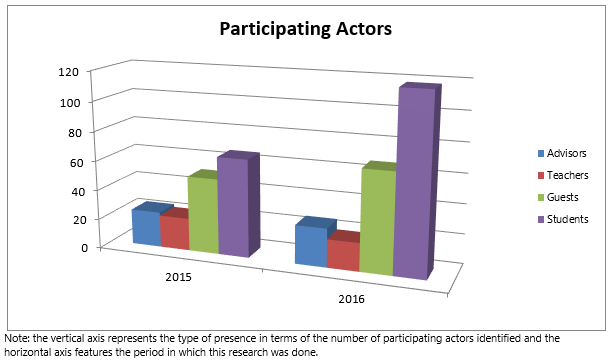
Source: prepared by the authors themselves (2017)
From this information, it was, then, generated an integrated database containing 458 items, corresponding to the year 2015 and 696 items for the year 2016. These data were transported to MS Excel and, subsequently, transferred to the social networks analysis software, Ucinet.
The analysis of the content via Social Network Analysis (SNA) (Hanneman & Riddle, 2005) allowed the diagnosis of the collaboration between authors and collaborators of the research studies of the different Knowledge Areas, highlighting their production and the establishment of links between groups, besides other properties.
After collecting the information, through the methodology of social networks one can obtain a comprehensive view in terms of how the transfer of knowledge within the organization was occurring (Guimarães; Sousa, 2005).
RESULTS
The results suggest that the low density in the "knowledge of research expertise" network indicates that the final participants of the dissertations obtained less knowledge of "who knows what" and who to address in the discussion of specific research ideas. This is an important result for a theme that, as observed, still has too much to expand (Cooke; Hall, 2013)
At this moment the interpretation of the results found was demonstrated, suggesting future research.
With regard to the Knowledge Areas, the general results suggest a re-evaluation of the classifications of the Research Lines and Research Projects in relation to the respective themes, as well as the cooperation among its actors.
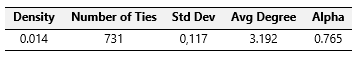
As for attribute statistics, both networks were duly enumerated and pointed to the network referring to the year 2015 as more dense, with more outstanding results of Centrality, Centralization and Cluster Coefficient. Then, in Graphs 6 and 7, one can observe graphs of the years 2015 and 2016.
Figure 6. Network graph representative of the academic production identified in MSG dissertations in 2015
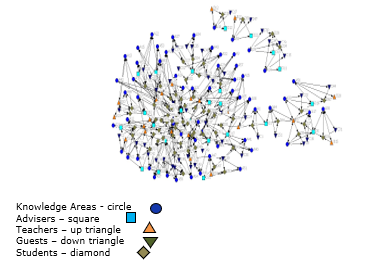
Source: The authors themselves - generated by Ucinet software in conjunction with netdraw (2017)
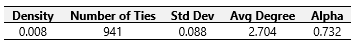
Figure 7. Network graph representative of the academic production identified in MSG dissertations in 2016
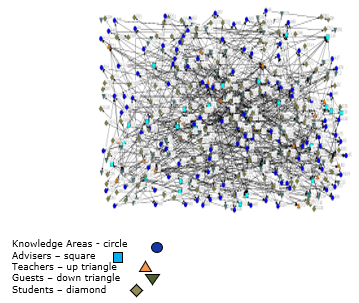
Source: The authors themselves - generated by Ucinet software in conjunction with netdraw (2017)
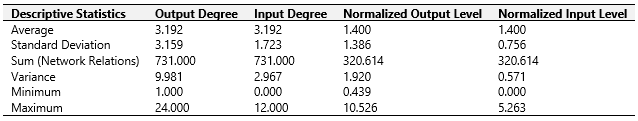
The analysis of the results of the attributes Density, Centrality, Centralization, Intermediation, Proximity, and Coefficient of Clustering of both networks, and their results, are presented below.
The Density can be analyzed not only from the actors' point of view, but also from the complete network. It serves to make known the high or the low connectivity of a network. It is defined as the actual number of network connections, expressed as a percentage of the maximum possible number of connections.
Chart 1. Density / Average Value of the Matrix – 2015
Source: The authors themselves, Inspired by Ucinet Software (2017)
The Density of this Network/2015 is 1.4%; thus, it indicates to be a network with a law density.
Chart 2. Density / Average Value of the Matrix – 2016
Source: The authors themselves, Inspired by Ucinet Software (2017)
The Density of this Network/2016 is 0,8%, thus, it indicates to be a network with a very low density.
Analyzing the Network Density it is concluded, through the statistical results, that the connectivity of these networks, both for 2015 and 2016, can be considered derisory. Both show a very low density although the first one shows more connections, 1,4%, compared to the lesser percentage of 0.8% of the second.
The Centrality identifies the position in which the actors are in relation to the exchanges and the communication in a network, demonstrating its multiple connections.
Chart 3. Descriptive Statistics of the Centrality Degree translated into mean values or set of general indicators of the network – 2015
Source: The authors themselves, inspired by Ucinet software (2017)
Chart 4. Descriptive Statistics of the Centrality Degree translated into mean values or set of general indicators of the network – 2016
Source: The authors themselves, inspired by Ucinet software (2017)
It is deduced that the Degree of Centrality of the 2016 network, although the size of this network corresponds to practically the double of the number of actors, compared to the 2015 network, its performance was inferior; therefore, it presents a much lower entry levels.
As for Centralization, while the centrality shows the positions of the actors in the network, it points to the space where the interactions take place. An example of centralization can be seen in Figure 8.
Figure 8. Example of networks with centering index 100 (left) and centering 0 (right).
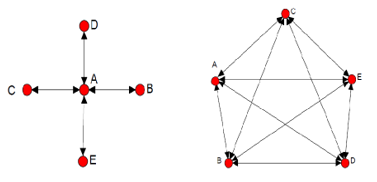
Source: Velásquez and Aguilar (2005)
Chart 5. CENTRALIZATION (as proportion and percentage) – 2015
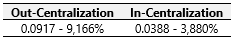
Source: The authors themselves, inspired on Ucinet software (2017)
Chart 6. CENTRALIZATION (as proportion and percentage) – 2016
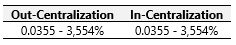
Source: The authors themselves, inspired on Ucinet software (2017)
Regarding the Degree of Centralization in 2015 and 2016, establishing a parallel between these two years, the network of the second year (2016) showed a performance much lower than the network of the first (2015), accusing the Degree of Entry and Exit equal (3,554 %). One can conclude that, in 2015, the information that entered the network was, moreover, transmitted in an increasing percentage of 236% (from 0.0388 / in-centralization to 0.9167 / out-centralization).
The Intermediation demonstrates the potential of actors who act as intermediaries, that is, how much an actor acts as a "bridge" for facilitating the flow of information in a given network. In figure 9, below, an example of degree of Intermediation can be observed.
Figure 9. Example of degree of intermediation, in this case, of node A
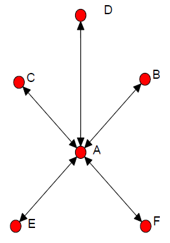
Source: Velásquez and Aguilar (2005)
Chart 7. Descriptive Statistics of the Intermediation Degree - 2015
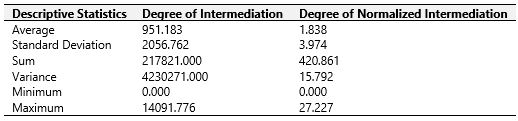
Source: The authors themselves, inspired on Ucinet Software (2017)
Chart 8. Descriptive Statistics of the Intermediation Degree – 2016
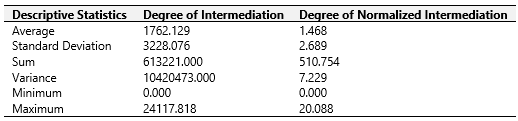
Source: The authors themselves, inspired on Ucinet Software (2017)
In this statistical analysis of 2015, as in the case of 2016, the Knowledge Areas present several links, due to their relevant condition as an actor in the network, without demonstrating high levels of intermediation.
The Proximity serves to demonstrate how close an actor is to everyone in the network. The more an actor has a high level of proximity to others, the greater the tendency and possibility of receiving information before the other actors.
Chart 9. Descriptive Statistics of Proximity - 2015
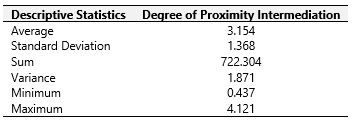
Source: The authors themselves, inspired on Ucinet software (2017)
Chart 10. Descriptive Statistics of Proximity – 2016
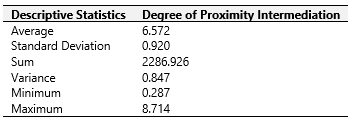
Source: The authors themselves, inspired on Ucinet software (2017)
In this attribute, a lower performance is also observed in 2016 in relation to the year 2015 (Proximity Degree of 4,121 versus 8,027).
The Clustering Coefficient measures the degree to which the nodes of a graph tend to cluster to form cohesive groups typified by a density of links. Clustering is a very common property in social networks according to the circle of professionals or friends where their members know each other, thereby developing a network group.
Chart 11. Clustering Coefficient -2015
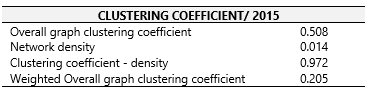
Source: The authors themselves, inspired on the Ucinet software (2017)
Chart 12. Clustering Coefficient – 2016
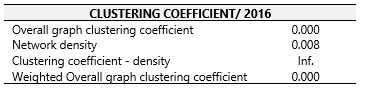
Source: The authors themselves, inspired on the Ucinet software (2017)
Finally, when studying the Clustering Coefficient of 2015 and 2016, the results indicate that the 2015 network presented a considerable (Agglomeration of 0.508) Clustering Coefficient or degree with which the nodes of a graph tend to cluster, compared to the 2016 network (agglomeration below 0.001). Although 2016 showed a 52% increase in the number of actors (from 229 -> 348) a very low proportion of 29% was observed, in terms of loops (731 -> 941 respectively).
The clusters of knowledge (Grouping Coefficient) that are part of the tacit knowledge of the group represent the capacity of cohesion of the network, indicating whether the production of collective knowledge is high or low.
CONCLUSIONS
In this work, the first steps towards the feasibility of a comprehensive and accurate systematic analysis of data were pointed out, based on the explicit relations of advisors, teachers, individuals invited, and students participating in the research in relation to the various areas of knowledge.
The various groups and how they are and can be structured in relation to the areas of knowledge were identified and mapped in the mapping of scientific production in a postgraduate program, thus providing the construction of a scientific research that promotes a greater connection of the academy with the interests of the society.
The relevance of the results of the application of the adopted system and the accessibility of the evaluation not only of the attributes of the actors and the relationships within the networks, but also of the networks as a whole, demonstrating their evolution in the studied periods, proved the benefits of the use of SNA in postgraduate programs.
The Social Network Analysis systematic proposal to support the management of scientific production presented in this study revealed, at the period of the research, the construction of the first academic social network in this postgraduate program.
Finally, it should be noted that the results found should not be generalized and the conclusions should only be established for the case applied. In addition, the perceived observations that were driven by the researcher's perception may occasionally be subject to bias in some settings.
Recommendations for future studies
This study opens doors for future investigations not only in universities, but also in other educational institutions and organizations that, by chance, try to be updated with the constantly changing requests regarding science. It is suggested the development of studies such as this in universities and in their respective research centers.
REFERENCES
Baum, J. A. C. et al. (2004), “The Small World of Canadian Capital Markets: Statistical Mechanics of Investment Bank Syndicate Networks, 1952-1989”, Canadian Journal of Administration Sciences, Vol. 21, No.4, pp. 307-25.
Castells, M. (1999), A era da informação: economia, sociedade e cultura: a sociedade em rede, 2nd ed., Vol. 1, Paz a Terra, São Paulo.
Choo, C.W. (2003), A organização do conhecimento: como as organizações usam a informação para criar significado, construir conhecimento e tomar decisões, SENAC, São Paulo.
Cooke L.; Hall, H. (2013) "Facets of DREaM: A social network analysis exploring network development in the UK LIS research community", Journal of Documentation, Vol. 69, No. 6, pp. 786-806.
Guimarães, F. J. (2005), Diagnóstico utilizando Análise de Redes Sociais, Dissertação de Mestrado em Engenharia de Produção, Universidade Federal do Rio de Janeiro, RJ.
Hanneman, R.A.; Riddle, M. (2005), Introduction to Social network Methods. Riverside, USA: University of California, available from: http://faculty.ucr.edu/~hanneman/nettext/Introduction_to_Social_Network_Methods.pdf (access 2018 May 21).
Loyola, E.; Moura S. (1997), “Análise de redes: uma contribuição aos estudos organizacionais”, in: Fischer, T. (Org.), Gestão Contemporânea: cidades estratégicas e organizações locais, Fundação Getúlio Vargas, Rio de Janeiro.
Marsden, P.; Lin, N. (1982), Social Structure and Network Analysis, Sage, London.
Marshall, G. (1998), Oxford Dictionary of Sociology, 2nd ed., Oxford University Press, Oxford.
Meneghelli, R. B. (2009), Redes Sociais informais nas organizações e satisfação no trabalho: estudo de caso numa empresa de energia, UFF, Niterói.
Molm, L. D. (1997), Coercive Power in Social Exchange, Cambridge University Press, Cambridge.
Monge, P. (1987), “The network level of analysis”, in: Berger, C.; Chaffee, S. (Eds.), Handbook of Communication Science, Sage, London, pp. 239-70.
Myers, M. D. (1997), “Qualitative Research in Information Systems”, MIS Quarterly, Vol. 21, No. 2, pp. 241-2.
Netdraw (Ano?): available from: http://www.analytictech.com/netdraw/netdraw.htm. (access 2018 May 21).
Neves, E. C.; Longo, R. M. J. (1999-2000), “Atuação do profissional da informação na gestão do conhecimento”, Revista de Biblioteconomia de Brasília, Vol. 23/24, No. 2, pp. 161-72.
Newman, M. E. J. (2003), “The Structure and Function of the Complex Network”, SIAM Review, Vol. 45, No. 2, pp. 167-256.
Otte, E.; Rousseau, R. (2002), “Social network analysis: a powerful strategy, also for the information sciences”, Journal of Information Science, Vol. 28 No. 6, pp. 441-53.
Pereira, H. B. B.; Freitas, M. C.; Sampaio, R. R. (2007), “Fluxos de informações e conhecimentos para inovações no arranjo produtivo local de confecções em Salvador/BA”, DataGramaZero, Revista de Ciência da Informação, Vol. 8, No. 4.
Schreiber, G.; Akkermans, H. et al. (2000), Knowledge Engineering and Management: The Common KADS Methodology, MIT Press, Cambridge. Scott, J. (2000), Social Network Analysis: A Handbook, 2nd ed., Sage, London.
Serafim Filho, P. (1999), “A gestão do conhecimento e a motivação nas organizações”, Revista Decidir, available from: http://www.perspectivas.com.br/leitura/go.htm (access 2018 May 21).
Silva, C. et al. (2013), Iniciação à Análise de redes Sociais – Casos Práticos e Procedimentos com Ucinet, Caleidoscópio, Portugal. Simmel, G. (1964), Conflict & The Web of group-affiliations, 1st ed., USA.
Stockinger, G. A. (2002), A dinâmica da comunicação midiatizada em organizações: projeto de pesquisa.
Sveiby, K. (1998), A nova riqueza das organizações, Campus, Rio de Janeiro.
Trauth, E. M. (2001), Qualitative research in IS: issues and trends, Idea Group Publishing.
Ucinet (2017), Available from: http://www.analytictech.com/ucinet/ (access 18 Aug. 2017).
Ugarte, D. (2007), El Poder de las Redes – Manual ilustrado para personas, coletivos y empresas abocados al ciberactivismo, 1. ed., Barcelona, available from: http://www.deugarte.com/manual-ilustrado-para-ciberactivistas (access 2018 May 21).
Velasquez, A. A. O.; Aguilar, N. G. (2005), Manual introductorio al análisis de redes sociales, Universidade Autónoma del Estado de México e Universidade Autónoma Chapingo.
Wasserman, S.; Faust, K. (1994), Social Network Analysis: Methods and Applications, Cambridge University Press, Cambridge. Zhen, X. (2010), “Overview of digital library development in China”, D-Lib Magazine, Vol. 16, No. 5/6, available from: http://www.dlib.org/dlib/may10/zhen/05zhen.html (access 8 Mar. 2018)
Received: 12 Apr 2018
Approved: 08 May 2018
DOI: 10.14488/BJOPM.2018.v15.n2.a15
How to cite: Batista, H. M. C. S., Rodriguez, M. V. C., Cardoso, K. A. W. et al. (2018), “The innovation process in hospital services: a case study in an occupational therapy”, Brazilian Journal of Operations & Production Management, Vol. 15, No. 2, pp. 330-342, available from: https://bjopm.emnuvens.com.br/bjopm/article/view/485 (access year month day).