The Mixed CUSUM-EWMA (MCE) control chart as a new alternative in the monitoring of a manufacturing process
Custodio da Cunha Alves
custodio.alves@gmail.com
University of the Region of Joinville – UNIVILLE, Joinville, Santa Catarina, Brazil
Andréa Cristina Konrath
andreack@gmail.com
Federal University of Santa Catarina – UFSC, Florianópolis, Santa Catarina, Brazil
Elisa Henning
elisa.henning@gmail.com
University of State of Santa Catarina – UDESC, Florianópolis, Santa Catarina, Brazil
Olga Maria Formigoni Carvalho Walter
olgaformigoni@gmail.com
Federal University of Santa Catarina – UFSC, Florianópolis, Santa Catarina, Brazil
Edson Pacheco Paladini
paladini@floripa.com.br
Federal University of Santa Catarina – UFSC, Florianópolis, Santa Catarina, Brazil
Teresa A. Oliveira
teresa.oliveira@uab.pt
CEAUL and Department of Sciences and Technology, UAb, Lisboa, Portugal
Amílcar Oliveira
amilcar.oliveira@uab.pt
CEAUL and Department of Sciences and Technology, UAb, Lisboa, Portugal
ABSTRACT
Goal: The objective is to conclude, based on a comparative study, if there is a significant difference in sensitivity between the application of MCE and the individual application of the CUSUM or EWMA chart, i.e., greater sensitivity particularly for cases of lesser magnitude of change.
Design/Methodology/Approach: These are an applied research and statistical techniques such as statistical control charts are used for monitoring variability. Results: The results show that the MCE chart signals a process out of statistical control, while individual EWMA and CUSUM charts does not detect any situation out of statistical control for the data analyzed.
Limitations: This article is dedicated to measurable variables and individual analysis of quality characteristics, without investing in attribute variables. The MCE chart was applied to items that are essential to the productive process development being analysed.
Practical Implications: The practical implications of this study can contribute to: the correct choice of more sensitive control charts to detect mainly small changes in the location (mean) of processes; provide clear and accurate information about the fundamental procedures for the implementation of statistical quality control; and encourage the use of this quality improvement tool.
Originality/Value: The MCE control chart is a great differential for the improvement of the quality process of the studied company because it goes beyond what CUSUM and EWMA control charts can identify in terms of variability.
Keywords: Process Monitoring; Control Chart; Mixed CUSUM-EWMA Chart.
1 INTRODUCTION
The Statistical Process Control (SPC), in particular, quality control techniques, such as control charts, have become increasingly important for the effective systematic monitoring of quality characteristics. To achieve quality assurance, a basic factor in the consumer decision regarding products and services, SPC, acts as a set of practical and efficient tools to solve problems for achieving stability and improvement in the process capacity by reducing variability (Montgomery, 2013).
Statistical control charts are commonly employed to get stability in SPC. It also ensures products and process quality control (Lampreia et al., 2018).
The most popular and important statistical tool for SPC is the control chart, which shows when a process changes and requires corrective action based on a sequential sample. In general, a control chart represents quality characteristics analyzed in several samples (Mingoti et Neves, 2005). A control chart enables the systematic reduction of variability in the quality characteristic of a product or service represented by the monitored variable. Its use consists in determining the existence of variations from special causes to remove them so that the process can be brought into statistical control (Alves, 2003).
Control charts are classified into two categories according to their design structure: memoryless and with memory, or time-weighted. Traditional Shewhart charts are the memoryless type once their control structure, which involves the statistical plot and additional decision rules, is based only on the last observation. The most popular memory-type control charts, such as CUSUM and EWMA, are designed in such a way that their statistical plot uses both past and current observations, which makes them more sensitive than Shewhart control charts to small and moderate changes in the process parameters of interest.
The classical memory-type CUSUM and EWMA control charts designed by Page (1954) and Roberts (1959), respectively, are considered, according to the literature, as more efficient than the Shewhart charts for detecting small changes in a process. However, with the wide range of control chart options available, selecting the chart that best suits a particular process can be a difficult task. The difficulty in selecting increases with the applicability of two different control charts for the same data. This is particularly the case when using the type of control charts with memory. For example, the same data may be analyzed using either the EWMA or CUSUM control chart, i.e., Vargas et al. (2004). However, the intent and method of application for each memory-type chart are completely different. In this case, an alternative may be the application of mixed control charts with memory that combine the parameters of these two charts, which are the subject to be studied topic in this paper.
According to the literature, after the development of the classical CUSUM and EWMA control charts, a variety of investigations involving fine-tuning and modifications for the effective monitoring of parameters and improving the quality of process outputs was proposed in order to further improve the performance of these charts and particularly increase the detection abilities of different types of control charts. Some researchers, such as Lucas (1982), proposed a combined Shewhart-CUSUM quality control design for efficient detection of large and small changes. Similarly, the use of combined Shewhart-EWMA charts, which increases the sensitivity of the chart for larger shifts, is recommended by Lucas et Saccucci (1990). Additional decision rule schemes that improve the CUSUM control chart performance from small to large changes was suggested by Riaz et al. (2011). The mixed EWMA-CUSUM (MEC) control chart design that mixes the statistical properties of these two classical memory-type charts in a single control structure to improve the monitoring of process parameters was introduced by Abbas et al. (2013). An inverse version of this mixture, i.e., a new mixed CUSUM-EWMA (MCE) chart was suggested by Zaman et al. (2015). In this new configuration, the CUSUM statistic serves as an input to the EWMA structure, contrary to the MEC chart whose EWMA statistic is used as an input to the CUSUM structure.
MEC and MCE control charts are still under researching in literature and can be found in previous studies (Aslam, 2016; Zaman et al. 2016, Lu, 2017; Osei-Aning et al., 2017).
The application of this new mixed memory-type control chart configuration in a rubber products manufacturing process is proposed in order to further improve the sensitivity of the MCE chart structure, particularly for changes of lesser magnitude of this process. Our work is divided into four sections: section 2 presents the theoretical framework involving the concepts and fundamentals of the two classical memory-type EWMA and CUSUM control charts and recent mixed memory-type MEC and MCE charts, with the combination of statistical parameters of these two charts; Section 3 is the application of the proposed methodology for the MCE by using the actual data of a manufacturing process and, finally, section 4 presents the final considerations.
2 THEORETICAL FRAMEWORK
Selection and Evaluation of Statistical Process Control Chart
Proper selection of the control chart type in process monitoring is a vital starting point for SPC because an incorrect selection of the chart type can result in many false alarms and high monitoring costs that are needless for special causes of the process. Some researchers, such as Lucas et Saccucci (1990) and Hawkins et Olwell (1998) state that EWMA and CUSUM memory-type control charts are more efficient than Shewhart-type charts. However, in most of the literature, there is no clear definition in terms of which of the two categories of memory-type charts (CUSUM or EWMA) or memoryless (Shewhart-type) is more sensitive for signaling a situation when the process is out of control. In addition, the purpose and method of application for each type of memory-type chart are completely different. When and how to use a control chart with memory has always been problematic both for quality supervisors in production lines regarding operational understanding, and SPC analysts regarding statistical comparison of performance.
The evaluation of the parameters associated with the statistical performance of control charts for process monitoring depends on the effectiveness in detection of special causes directly related to the choice of control limits, the sampling interval, the sample size and the choice of sensitivity rules. An effective measure usually adopted of these sensitivity rules to evaluate the statistical performance of a control chart is known as the Average Run Length (ARL) (Moraes et al., 2015), which is the average number of samples that must be collected until the process indicates an out-of-control condition (Montgomery, 2013; Costa et al., 2004). When the process is under statistical control, ARL0 indicates the average number of points required for the occurrence of the first false alarm of the control chart. However, when the process is out of statistical control, ARL1, called the out-of-control ARL, indicates the number of samples required to detect the occurrence of changes in the quality characteristic under study. In the design of a control chart, it is crucial to analyze the ARL behavior with respect to the various change amplitudes. This is because ideally, ARL0 should be as large as possible, which is an indication that few interruptions will be necessary in the process when it is under statistical control. Moreover, ideally, ARL1 should be as low as possible, since this value directly relates to the time required for the detection of a special cause (Abbas et al., 2013).
Random variable can be defined as the quantity of samples until the first out-of-control signal occurs and its distribution is called as run length distribution (Abbas et al., 2013).
The average of this distribution is the ARL, the statistical indicator that is mostly used to evaluate and compare control chart performances. This indicator takes into account the values of Type I and Type II errors, i.e., the cost associated with searching for a nonexistent problem and the cost associated with poor quality in the final product from when a change occurs until it is detected (Alves et al., 2013). Such errors, when not determined correctly, affect the performance of control charts and can have negative consequences for the productivity and quality of production processes (Lee et al., 2013).
From a statistical point of view, a good control chart is one that, besides having an effective design structure, can deal with the more practical aspect of having resistance to unusual situations. Thus, as a compromise between the statistical and practical purposes, the key is to develop a monitoring chart that can simultaneously meet both objectives in a good capacity (Nazir et al., 2015).
Control Charts for Monitoring the Location of a Process
The best-known statistical control chart, widely used in monitoring processes, is Shewhart-type chart, where only information about the last point marked on the chart is considered (Klein, 2000; Abbas et al. 2014).
In some cases, other types of control charts can supplement Shewhart type control chart or replace it and provide advantages. This is the case of the classical CUSUM and of EWMA memory-type control charts discussed in this paper. These charts, unlike the Shewhart-type chart, combine the latest information with previous information and thereby detect small and moderate changes of process parameters with a much lower ARL (Alves et al., 2009).
The main advantage of Shewhart chart in monitoring the location and/or dispersion of a quality characteristic is to provide a higher sensitivity to detect large changes in a process with independent and normally distributed observations. However, it has a disadvantage that, for each new period of time, it takes into account only the current value of the observed variable in its statistical plot, disregarding the previous values. This reduces the effectiveness of the monitoring of small and moderate process changes (Diniz et al., 2013).
The main Shewhart-type chart for variable control used in monitoring the location of a process is the mean chart, (x̄). For monitoring dispersion, Range charts (R) and Standard Deviation charts (S) can be used. Historically, the x̄ chart has been the most widely used when applied individually or in conjunction with one of the other charts (R or S) to jointly monitor mean and dispersion (Ryan, 2011).
The simplest Shewhart-type control chart is that for individual measures, Xi, whose data are in the individual observations. In this situation, it is impractical to try to group these data together in any way with the purpose of using charts of the rational subgroups. This chart can be useful to monitor the location of a process in two situations: the Xi chart based on known parameter values and the Xi chart based on estimated or unknown parameter values. Suppose that the parameters of the process mean (μ) and standard deviation (σ) are known, the control limits are assigned to μ ± 3x̄ for n=1 and μ ± 3x̄ for n>1 where σx̄=σ/√n, provided the observations of the quality characteristic considered to assume a normal distribution as an appropriate model and having no correlation are reasonable. Just as with statistical methods in general, the conditions should be checked, with the assumption of normality for an Xi chart being critical. However, if the process parameters for the mean and standard deviation are unknown, the respective estimators can be easily obtained based on the samples taken from a process that is apparently under control. The usual estimator for µ is x̄ which would be calculated from a set of recent historical data of the process. Although there is no well-defined choice for the μ estimator, this is not the case when deciding how to estimate σ. A better approach is to use two evaluators, one for the analysis of the historical data set and another to monitor the process, i.e., Phase I and Phase II. The reason for this recommendation is that one estimator is preferable for Phase I while the other is better for Phase II (Ryan, 2011). These two estimators are based on the moving range M̄R̄=|Xi - Xi-1| and the standard deviation σ, respectively. Thus, the control limits for the Shewhart-type chart X for individual measurements are obtained as x̄ ± 3σ, preferably with σ=MR∕d2 in Phase 1 and σ=s∕c4 in Phase 2, where σ is an unbiased estimator of the value of the appropriate control chart constant d2 (tabulated value, for n=2) or C4 (tabulated value based on the number of observations).
A study on distribution-free Phase II CUSUM Control Chart for Joint Monitoring of Location and Scale was presented by Chowdhury et al. (2015). Considering the Lepage statistic, the authors state a single distribution-free cumulative sum chart and denote it by CL-Chart (Cumulative sum-Lepage). They conclude that these CL-Charts perform very well in the location-scale models, based on practical applications to real data, for which this new model was compared with several existing cumulative sum charts and moreover with a competing Shewhart-type chart.
Memory-type or Time-weighted Control Charts
Memory-type or time-weighted control charts are appropriate alternative tools because they have great sensitivity for the rapid detection of small and moderate changes in a process, in contrast to traditional Shewhart-type charts (Riaz, 2011). The statistics used in the development of these charts take into account, in each new time period, not only the current value of the observed variable, but also their previous values. Thus, they are able to detect subtle changes in the mean (or even the variation) of the process, increasing monitoring efficiency (Diniz et al., 2013).
In general, the performance of EWMA and CUSUM charts are equal and most comparative studies are based on the ARL (Montgomery, 2013; Lee et al., 2013).
The usual design structures for control charts with memory, such as those of classical CUSUM and EWMA charts, are appropriate alternative statistical tools adequately developed to provide greater sensitivity. It is supposed that it detects small and moderate changes in the parameters of a process more quickly with an average number of samples until the emission of a signal (ARL) that is much lower than the traditional Shewhart-type control chart (Koshti, 2011; Nazir et al. 2013).
Suppose you want to track the evolution of a variable X measuring a certain quality characteristic. Successive observations of this variable are X1, X2,…, Xn. Considering that the characteristic X must assume the nominal value µ, the values d1 = (X1 - µ), d2 = (X2 - µ), ..., dn = (Xn - µ) correspond to the sequence of deviations from the nominal value. If a very small change occurs, the evolution of values d1, d2… dn would not be effective to detect it. Therefore, it is more efficient to develop a graphical representation based on d1, d1 + d2, d1 + d2 + d3 …, d1 + d2 + d3 + … + dn-1 + dn, such that, at each instant, the historical information is also considered. Thus, a small change would accumulate until its detection becomes obvious.
Cumulative Sum Control Chart
The classical Cumulative Sum (CUSUM) control chart proposed by Page (1954) is an alternative to the Shewhart-type chart for rapid detection of small and moderate changes of location and/or dispersion of a process with independent and normally distributed observations. There are many versions of CUSUM control charts; however, the tabular is traditionally the most used (Khoo; Teh, 2009; Montgomery, 2013). This procedure uses the accumulated sum to accumulate deviations of each observation from the nominal value µo that are above the nominal value with the statistic C+i, and deviations from µo that are below the nominal value with the statistic C=i.
The statistics C+i and C=i, called upper and lower one-sided CUSUM, respectively, for monitoring the mean of a process, defined initially as C+i=C=i=0, are determined as follows (Hawkins; Olwell, 1998; Woodall; Adams, 1993):
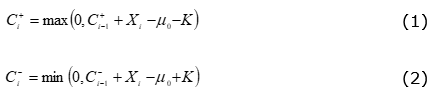
where Xi (i=1,2,...) are independent and normally distributed observations, Xi ~ N(μ0, σ), μ0, the nominal value and σ, the standard deviation. If one wants the statistics C+i and C-i for the sample means, x̄i should be used in Equations (1) and (2) instead of Xi, and σx̄=σ/√n instead of σ in the next equations. If the value of C+i or C-i exceeds the decision interval H = hσ, the process is considered to be out of control. A reasonable value for H is five times the standard deviation of the process, or H=5σ. The reference value K, in Equations (1) and (2), is generally chosen as half of the magnitude of change (in standard deviation units), or K = kσ = (δ/2)σ = |μ1 - μ0 | / 2. The values k (reference value) and h (standardized decision interval) are parameters of the CUSUM chart. The appropriate selection of the (k, h) pair is very important since it greatly influences the ARL performance of this chart.
Classical Exponentially Weighted Moving Average Control Chart
The classical Exponentially Weighted Moving Average (EWMA) control chart proposed by Roberts (1959) is another good alternative to the Shewhart-type control chart for the rapid detection of small and moderate changes of location and/or dispersion of a process (Wheeler, 2004; Abbas et al., 2011). The EWMA chart accumulates successive information by weighing the samples giving greater weight to the most recent observations and less weight to the most remote, i.e., the weight given to the samples decreases geometrically from the first to the last sample. Its performance is very similar to that of the CUSUM chart, and both are usually used with individual observations (Costa et al., 2004).
The statistic Zi of the EWMA control chart for monitoring the mean of a process, which is initially defined as equal to the nominal value (Z0=µ0), is determined as follows (Lucas; Saccucci, 1990):
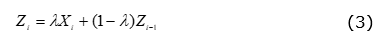
where Xi (i=1,2,...) are independent and normally distributed observations, Xi ~ N(μ0, σ), μ0, the nominal value and σ, the standard deviation. Considering the statistic Zi for sampling means, x̄t should be used, instead of Xi in Equation (3), and σx̄=σ∕√n should be used instead of σ in Equations (4) and (5). The smoothing constant λ is one of the chart parameters such that 0<λ≤1. When λ=1, the EWMA chart is reduced to a Shewhart-type chart, as λ=0, Z0=µ0. Knowing that the observations Xi are independent random variables with variance σ2, then the variance of Zi is given by:
Once we have the value of the variance σ2zi, the non-fixed EWMA chart control limits depend on i and are usually obtained with the asymptotic value λ/(2-λ) of the variance. As i increases, the variance approximates the asymptotic value. The EWMA chart control structure, which includes the upper control limit (UCL), lower control limit (LCL) and the center line (MCL), is defined as:

where the factor L (Equation 5) is the extension of the control limits, or the number of multiples of the standard deviation in which the control limits are far from the center line (MCL), Equation (6). Like the CUSUM chart, the EWMA chart has two parameters: λ determines the reduction of weights and L denoting the amplitude range of the control limits. Together, (λ, L) determine the ARL performance of the EWMA chart.
Recently, new research involving improvements and design changes of memory-type CUSUM and EWMA control charts have emerged. Such alternatives, called mixed memory-type control charts, include a combination of the statistical parameters of both charts, such as ARL, in a single control structure, so as to further improve the performance of these charts. The following sections present a detailed description of some of such current alternatives.
Mixed EWMA-CUSUM Control Chart
A new memory-type control chart structure, called Mixed EWMA-CUSUM (MEC), has been proposed by Riaz et al. (2011). The heart of this new control chart design is the probabilistic combination involving the statistical parameters of the CUSUM (Page, 1954) and EWMA (Roberts, 1959) charts in a single structure so that the mixed chart (MEC) is better in terms of ARL than the individual use of these two charts. The effect of the mixture of statistical parameters in this mixed control chart design is, undoubtedly, to further increase the sensitivity of the two cited charts, particularly for processes having a smaller magnitude of change (Alves et al., 2015).
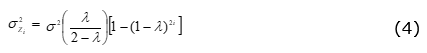
Suppose that we have the sequence X1, X2, X3, …, Xi, independent and normally distributed random variables whose values are associated with the quality characteristics of interest of a process under control, with a mean μ0 (nominal or target value for the process mean) and standard deviation σ, both known. In the mathematical model developed for the MEC control chart design, the plot statistic Zi of the EWMA chart (Equation 3) is used as an input to the CUSUM chart. Thus, the one-sided statistics MEC+i (upper) and MEC-i (lower) for the MEC control chart are determined according to Equations (7) and (8) (Abbas et al., 2013; Zaman et al., 2015):
where the quantities MEC+i and MEC-i are initially defined to be equal to zero, that is, MEC+i = MEC-i = 0. Kz, a reference value that is variable over time due to the variance σ2zi, of the statistic Zi (EWMA) in Equation (4) for the structure of the MEC chart, is defined by the Equation (9):
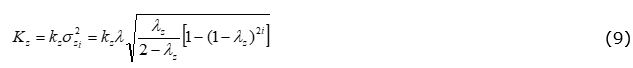
In this expression, Kz is equivalent to the constant k in the configuration for the classical CUSUM chart. Furthermore, these statistics MEC+i and MEC-i are represented as a function of the control limit Hz , Equation (10), which varies over time due to the statistic Zi (EWMA) in Equation (4) for the MEC chart structure, and is defined as:

where hz is a coefficient used to set the default false alarm rate, and is equivalent to the constant h in the configuration of the classical CUSUM chart. For a fixed value, kz, it is possible to select the value of hz, i.e., the combination (kz, hz) from tables that set ARL0 to the desired level. In general, kz assumes half of value of the magnitude of change (in standard deviation units). Therefore, it is possible to choose, for example, kz=0.5 for an ARL0=500, since such a value makes the CUSUM structure more sensitive to small and moderate changes of amplitude (Montgomery, 2013; Hawkins; Olwell, 1998), for which the charts with memory are really the target. The control limit -hz, is selected according to a preset ARL0. A large preset ARL0 value provides a greater Hz value and vice versa.
Now, the one-sided statistics MEC+i and MEC-i are plotted against the control limits -Hz. Thus, if the values MEC+i and MEC-i are plotted within the control limits, the process mean is said to be under control (μ0), or out of control (μ1). Therefore, if the process remains under control (at the target value μ0), the values of the statistics MEC+i and MEC-i fluctuate randomly around the zero mean. However, any statistical value graphically shown above Hz, i.e., that exceeds the control limit Hz, indicates an increase in the process mean (μ1>μ0), in other words, a positive displacement or one which is above μ0. Conversely, if the mean of the process moves to any value (μ1>μ0), then a negative displacement or one below μ0 will occur when the statistic MEC-i exceeds the control limit, Hz.
In the design of the MEC control chart, for one-sided statistics MEC+i (upper) and MEC-i (lower), respectively Equations (7) and (8), the case is considered of a process whose quality characteristic is monitored through individual observations (n=1), and this situation can be extended to the case where the quality characteristic is monitored via rational subgroups (n>1).
For the MEC chart, Equations (7) and (8) in this paper are adapted according to Equations (1) and (2) of the Tabular CUSUM chart design (Page, 1954; Hawkins; Olwell, 1998; Woodall; Adams, 1993). The symmetrical bilateral interval decision plan facilitates the visual interpretation of the positive C+i (upper CUSUM) and negative C-i (lower CUSUM) changes, a situation similar to MEC+i (upper) and MEC-i (lower), for positive and negative changes, respectively.
The assessment of ARL performance in a control chart design can be done by different approaches, including Markov chains, integral equations, Monte Carlo simulations and different types of approximations. A simulation algorithm in the R language for a detailed study on the calculation and performance of the ARL of the MEC control chart to monitor the mean of a normally distributed process was developed using a Monte Carlo simulation approach (Abbas et al., 2013).
In this study, the ARL values of the CUSUM and EWMA control charts are obtained by a mixed combination of statistical parameters of both of the charts and are applied to the MEC control chart. The results are approximately similar to those of Lucas et Saccucci (1990) and Hawkins et Olwell (1998), respectively, ensuring the validity of the simulation algorithm used in the development of the MEC control chart design. In Figures 1 and 2, graphical representations (ARL curves) illustrate the ARL performance of the control charts used in MEC chart development for some magnitudes of change δ (in multiples of σ), and some selective choices such as (k, h), (λ, L), (λz, kz) of MEC chart performance evaluation where, for this purpose, the ARL0 values are set only at ARL0=500.
Figure 1. ARL performance set at ARL0=500 - EWMA (λ=0.25 and L=2.998), CUSUM (k=0.5 and h=5.09, Shewhart (3σ) and MEC (λz=0.25 and kz=0.5)
As shown in Figure 1, the Shewhart-type chart is more sensitive to major changes in the process mean. However, for small to moderate magnitude changes (δ < 2σ), classical CUSUM and EWMA charts are more sensitive. The main difference between the performance of these charts with memory is the sensitivity to detect particularly small magnitudes of change on the order up to 0.75σ. For such a situation, the Mixed EWMA-CUSUM (MEC) chart showed higher sensitivity. Figure 2 and 3 show that, for magnitudes of change (δ > 0.75σ), the CUSUM and EWMA charts have similar ARL performance and are more sensitive than the MEC chart.
Figure 2. ARL performance set at AARL0=500 - EWMA (λ=0.25 and L=2.998)
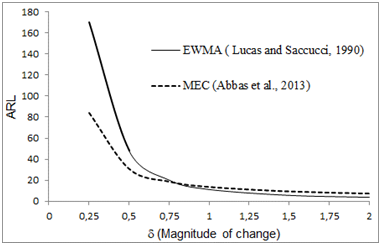
Figure 3. ARL performance set at ARL0=500 - CUSUM (k=0.5 and h=5.09) and MEC (λz=0.25 and kz=0.5)
Mixed CUSUM-EWMA (MCE) Control Chart
Zaman et al. (2015) proposed a new design for a control chart with memory called Mixed CUSUM-EWMA (MCE), whose control structure also involves a mixture of statistical characteristics of classical CUSUM (Page, 1954) and EWMA (Roberts, 1959) charts, but in reverse order compared with the MEC chart. In other words, the statistics C+i and C-i of the CUSUM chart are entered as input to the EWMA chart. The essence of this recent design for the mixed control chart is the combination of the classical CUSUM and EWMA charts in a single control structure to optimize the monitoring of statistical parameters of a process in order to improve the performance of the resulting MCE chart, particularly for processes with smaller magnitudes of change. As an alternative to the individual application of classical memory-type CUSUM and EWMA charts to monitor the location and/or dispersion of a process, the purpose of the resulting statistical effects of the proposed probabilistic combination in the MCE chart, is undoubtedly to increase the sensitivity in terms of ARL of these two classical charts.
As an application alternative to monitor the location of a manufacturing process of rubber products, the recent Mixed CUSUM-EWMA (MCE) control chart structure with memory is under research. This chart is on the mean of individual observations of the quality characteristic under consideration (continuous, independent and normally distributed random variables). The use of real data on this mixed system of control charts is to motivate the practical considerations proposed in this paper.
Let the sequence X1, X2, X3,… be the quality characteristic measurements taken, successively, of a process over time. This sequence of measurements consists of collected samples of size n≥1 that can be individual observations or sample means. Let us assume that this sequence of measurements represents independent random variables, and that X1 is normally distributed according to X1 ~ N(μ0, σ), with the mean of the process under control μ0 and the standard deviation σ, both known. One-sided statistics MCE+i (upper) and MCE-i (lower) to detect a change of location in the process from μ0 to μ1 according to Zaman et al. (2015), are determined as:

where C+i and C-i are the one-sided statistics of the classical CUSUM control chart in Equations (1) and (2) and λc is the sensitivity parameter of the MCE control chart, equivalent to λ in Equation (3), with 0 < λc ≤ 1. The initial values for the MCE+i and MCE-i one-sided statistics are set to be equal to the target mean of C+i and C-i, respectively, that is, MCE+0 = MCE-i = μc . For a situation that is under control, the mean and the variance of the statistics, in Equations (11) and (12) vary over time to a specific value of i, and for i_i → ∞ it becomes constant. The notation for the mean and variance are respectively:
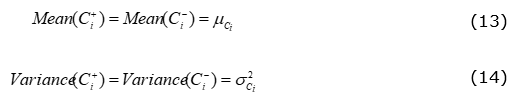
Considering (13) and (14), we define the control limits, Equation (15), for the MCE chart as:

where LC is the coefficient of amplitude, equivalent to L in Equation (5), and it determines the preset false alarm rate.
Now, the one-sided statistics MCE+i and MCE-i are plotted against the control limits, UCLi and LCLi. Thus, if the values MCE+i and MCE-i are plotted within the control limits, the mean of the process is said to be under control (μ0) or out of control (μ1). Therefore, if the process remains under control (in the target value μ0), the values of the statistics MCE+i and MCE-i fluctuate randomly around the zero mean. However, any statistical value MCE+i graphically represented above UCLi, that is, that exceeds the control limit UCLi, indicates an increase in the process mean (μ1 > μ0) and thus a positive displacement or one which is above μ0. Conversely, if the mean of the process moves to any value (μ1 < μ0), then a negative displacement or one below μ0 will occur when the statistic MCE-i exceeds the control limit LCLi.
In the design of the MCE control chart, for one-sided statistics MCE+i and MCE-i, Equations (11) and (12), it is considered the case of a process whose quality characteristic is monitored through individual observations (n=1), which can be easily extended to the case where the quality characteristic is monitored via rational subgroups (n>1). To do this in the equations, one can simply replace Xi by x̄i (sampling or subgroup mean) and σ by σx̄=σ∕√n (standard deviation of the subgroup means).
The assessment of ARL performance in a control chart design follows different approaches, including Markov chains, integral equations, Monte Carlo simulations and different approaches. Using the Monte Carlo simulation approach, Zaman et al. (2015) developed a simulation algorithm in the Matlab environment for a detailed study on the calculation and performance of the ARL of the MCE control chart to monitor the mean of a normally distributed process.
In this study, the ARL values of the classical CUSUM and EWMA control charts are obtained by a mixed combination of statistical parameters of both charts and are applied to the MCE control chart. The results are approximately similar to those of Lucas et Saccucci (1990), and Hawkins et Olwell (1998) respectively, ensuring the validity of the simulation algorithm used in the development of the MCE control chart design. In Figures 4, 5 and 6, graphical representations (ARL curves) illustrate the ARL performance of the control charts used in the MCE chart development for some magnitudes of change δ (in multiples of σ), and of some selective choices, such as (k, h), (λ, L), (λz, kz) of the MCE chart performance evaluation, where, for this purpose, the ARL0 values are set only at ARL0=500.
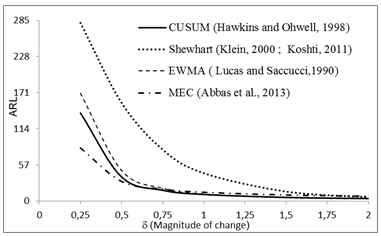
Figure 4. ARL performance set at ARL0=500 - EWMA (λ=0.25 and L=2.998), CUSUM (k=0.5 and h=5.09), Shewhart (3σ) and MCE (λc=0.25, kz=0.5).
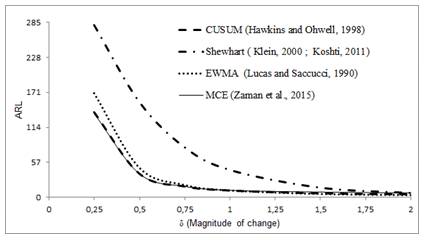
As shown in Figure 4, the Shewhart-type chart is more sensitive to major changes in the process mean. However, for small to moderate magnitudes of change, (δ < 2σ), the classical memory-type charts are more sensitive. For other magnitudes of change, (δ < 1σ), the MCE and CUSUM charts show a similar ARL, but are more sensitive than the EWMA chart.
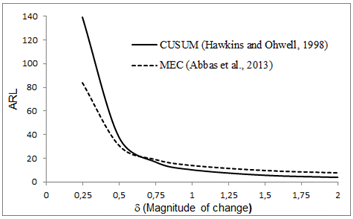
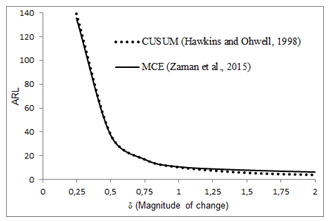
Figures 5 and 6 show that classical CUSUM and EWMA charts for magnitudes of change (δ < 1σ) have similar ARL performance and are more sensitive than the MCE chart.
It can be observed that the Mixed CUSUM-EWMA (MCE) control chart has greater sensitivity than the Mixed EWMA-CUSUM (MEC) control chart for small changes in the mean of the process on the order up to 0.62σ. However, for magnitudes of change (δ > 0.62σ) it is less sensitive than the MEC chart.
Figure 5. ARL performance set at AARL0=500 - EWMA (λ=0.25 and L=2.998)
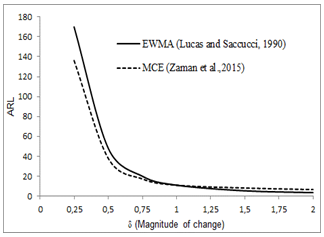
Figure 6. ARL performance set at ARL0=500 - CUSUM (k=0.5 and h=5.09) and MCE (λc=0.25, kz=0.5).
Furthermore, to complement recent design proposals involving mixed control charts with memory, namely MEC (Abbas et al., 2013) and MCE (Zaman et al., 2015), a graphical representation (ARL curve) illustrates the ARL performance.
Some magnitudes of change, δ (in multiples of σ) and some selective choices of parameters, such as λz and kz (MEC), λC and kz (MCE) were stated. For this purpose, the values were set at ARL0=500, as it is shown in Figure 7.
Figure 7. ARL performance set at ARL0=500 - MEC (λz=0.25, kz=0.5) and MCE (λc=0.25 and kz=0.5)
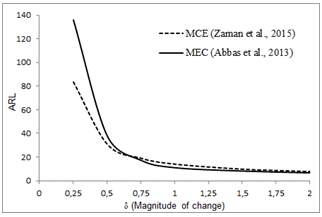
Examining the graphical representations (ARL curves) of different control chart designs being studied, it was found that the ARL curves of MEC and MCE mixed charts with memory (Figures 1, 2, 3, 4, 5 and 6) are located on the lower side, showing evidence for increased sensitivity compared to other charts. For small values of δ, the difference between the ARL of the MEC and MCE charts is larger, while for moderate values of δ, the difference almost disappears.
For larger values of δ, the ARL curves of the MEC and MCE charts are located above the ARL curves of the other investigated charts, showing the poor performance of MEC and MCE charts for larger displacements. In short, we can deduce that, in general, recent MEC and MCE chart designs with memory are good at detecting small and moderate changes, while for larger changes their performance is lower when compared to other control charts.
Research Methodology
This study is characterized as an applied research (Gil, 2010; Edmmonds et Kennedy, 2013), because it contributes to practical purposes, trying to solve problems or needs that exist in the real world. In other words, this research provides a comparative study to analyze the differences in terms of sensitivity between the MCE and the individual CUSUM or EWMA control charts. This research has a quantitative approach because, in order to reach the proposed objective, the results are analyzed using statistical control charts. Algorithms in R software (R Core Team, 2018) were developed for the creation of MCE and MEC control charts. Shewart, CUSUM and EWMA control charts were created using the R package qcc (Scrucca, 2004).
APPLICATION OF MIXED CUSUM-EWMA CONTROL CHARTS
The Mixed CUSUM-EWMA chart will be performed, considering data set of a rubber products manufacturing process of an industry leader in rubber technology, which is implemented at the northern region of the state of Santa Catarina.
The quality characteristic in this manufacturing process is the hardness of the band (Xi) with a nominal value of ShoreλA, which is monitored daily through individual observations. The seed compacting and terrain leveling bands in the company's agricultural line of products are rubber components similar to a tire, that are mounted on a rim and coupled to an agricultural machine. Their function is to make a uniform groove in the soil, compressing and sowing simultaneously. The major property that is required for this purpose is abrasion resistance. The monitoring of the hardness of this rubber component is necessary so that the flexibility of the rubber can be ensured in the different product applications that require specific hardness.
To illustrate the systematic development of the Mixed CUSUM-EWMA (MCE) control chart, attending the methodology proposed by Zaman et al. (2015) and the classical CUSUM and EWMA charts, an algorithm was designed (Figure 8). This algorithm, considers that the data set, generated from the information of the manufacturing process under study, behaves according to the normal distribution and to the absence of autocorrelation. The statistical analysis of this manufacturing process is obtained from 30 samples of size n = 1. The first seven (7) samples of this process behaved according to a normal distribution with a mean of μ = 70 equivalent to the nominal value and standard deviation σ = 1, i.e., N (70,1), and the 23 remaining samples had a change of 0,5σ in the mean, or N (70.5,1).
Selected for the change in the mean of this process, with δ = 0.5σ capable of ensuring a desired fixed value of ARL0 = 500, the statistical parameters are: k = 0.5 and h = 5.09 for the classical CUSUM chart (Hawkins; Olwell, 1998); λ = 0.25 and L = 2.998 for the classical EWMA chart (Lucas; Saccucci, 1990); λz = 0.25 and kz = 0.5 for the MEC chart (Abbas et al., 2013), and λc = 0.25 and kz = 0.5 for the MCE chart (Zaman et al., 2015).
Figures 8, 9, 10, and 11 show a graphical representation of the MCE, MEC, EWMA and CUSUM charts with memory and the Figure 10 shows the Shewhart-type chart.
Figura 8. MCE Chart generated from the manufacturing process data - Quality characteristic: Hardness of the band (in ShoreA)
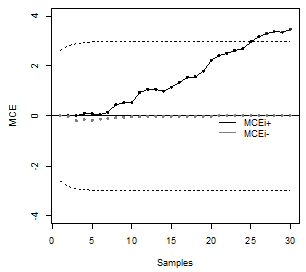
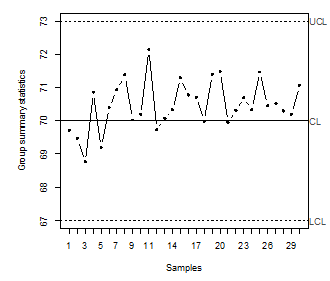
The results of the application (Figure 8) show that, for the current data, it is evident that there are points outside the control limits in five samples (26, 27, 28, 29, and 30) in the MCE chart, and four samples (27, 28, 29, and 30) in the MEC chart (Figure 9). However, it shows that separate applications of the EWMA (Figure 10), CUSUM (Figure 11) and Shewhart type (3σ) (Figure 12) control charts cannot detect any situation out of control for the dataset provided.
Figure 9. MEC Chart generated from the manufacturing process data
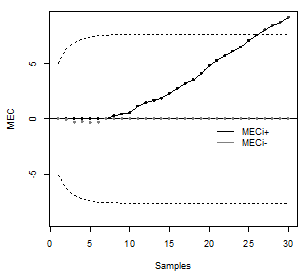
This emphasizes the superiority of mixed MEC and MCE charts with memory, especially for small magnitudes of change in the location (mean) of a process.
Figure 10. EWMA Chart generated from the manufacturing process data
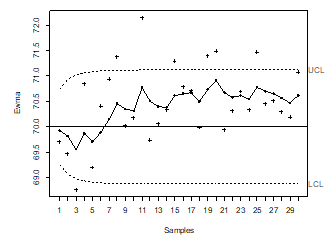
Figure 11. CUSUM Chart generated from the manufacturing process data
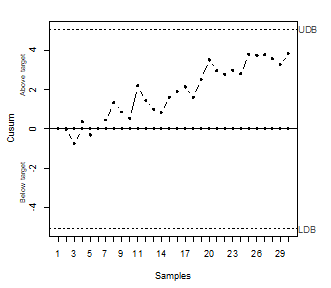
Figure 12. Shewhart Chart for process data
In addition, by interpretation of Figure 8, it is also clear that the MCE chart is more sensitive than the MEC chart specifically for this process whose magnitude of change in the mean is located on the change interval where MCE has the greatest sensitivity. This is exactly in accordance with the conclusions presented on the ARL performance of these charts in Figure 7 of the previous section.
FINAL CONSIDERATIONS AND RECOMMENDATIONS
The recent Mixed CUSUM-EWMA (MCE) control chart design proposed in this paper as an application alternative for the monitoring of manufacturing processes is a performance improvement procedure for control charts with memory whose statistics C+i and C-i of the CUSUM chart that monitor location (mean) of a normally distributed process are entered as input to the EWMA chart. The essence of the new design is the combination of structures of the classical CUSUM and EWMA charts in a single control structure. It aims to optimize the monitoring of statistical parameters of a process so that the resulting mixed chart (MCE) is better in terms of ARL performance than the individual use of these two classical charts: it means greater sensitivity particularly for processes with a smaller magnitude of change.
In this study, the application of the recent MCE control chart design to the real data set of a rubber products manufacturing process was very important. It was possible to verify that the theoretical foundations of this new control structure are of easy transfer to a practical situation. Two competing systems of control chart design from two extremes, i.e., the most representative control charts in the literature, such as the Shewhart-type chart (for large magnitudes of change) and CUSUM, EWMA and MEC charts with memory (for small and moderate magnitudes of change), were compared. These charts have been developed for the same set of data from this manufacturing process and for the same value of ARL0 = 500 as shown in the graphical representations (Figure 8), whose differences in the detection abilities of these charts convey the message quite efficiently for the purpose of this study.
The statistical analysis has shown that the mixed MEC and MCE control charts with memory are significantly more sensitive primarily to small changes and provide a very effective structure compared to other charts already studied. The MCE chart showed superior performance compared to the MEC chart specifically for the application of this process whose magnitude of change in the mean is located in the change interval where the MCE chart has greater sensitivity. Furthermore, the MCE chart is an efficient competitor for the traditional Shewhart-type chart for different values of λ and δ parameters. The results of the application (Figure 6) indicate that, for the current data, it is evident that there are points outside the control limits in the MCE (five points) and MEC (four points) control charts and thus the separate application of EWMA and CUSUM charts fails to detect any situation out of statistical control for the data set provided. This means that it has higher sensitivity, that is, lower ARL, for the change size 0.5σ in the location (mean) of the process.
The use of control charts for monitoring quality characteristics of a process that has particularly small variations in the location and/or dispersion of interest has advantages, considering both the statistical and the economic aspects. From the statistical points of view, there may be a reduction in the number of samples until the chart signals the occurrence of a special cause. From the economical points of view there may be a reduction in costs, related to the optimization of parameters that include statistical aspects such as minimizing false alarms. This optimization of statistical parameters from the viewpoint of monitoring processes with smaller magnitudes of change and with minimal ARL via mixed control charts with memory can be an excellent alternative in practical situations, such as very capable processes, processes that are difficult to adjust or processes whose adjustment cost is high. In these situations, it is essential to proper select a control chart with greater sensitivity and lower false alarm rates by optimizing parameters of statistical monitoring.
Recent mixed MEC and MCE control chart structures with memory are not substitutable for classical CUSUM and EWMA control charts with memory, since they are suitable for monitoring processes specifically with a smaller magnitude of change (δ ≤ 0.75σ). However, it can act as a complement to these charts in this change interval, assisting in the optimization of the statistical monitoring parameters for continuous process improvement aimed at achieving optimal stability levels and therefore better quality of goods.
Practical Implications
The contribution of this study on the application of the mixed MCE control chart with memory in the statistical analysis of different processes with small magnitudes of change, as well as a comparative study of the performance with the charts most often used and available in the literature, can help to: i. contribute to the correct choice of more sensitive control charts to detect mainly small changes in the location (mean) of processes that operate with less variability; ii. provide clear and accurate information about the fundamental procedures for the implementation of statistical quality control; iii. encourage the use of this quality improvement tool, which involves reducing the variability of processes, resulting in a gain for the company by improving quality and productivity and reducing costs by continuing the decrease of process variability, achieved with the implementation of this chart.
Regarding its practical use, since the tool has a sophisticated theoretical basis (statistics), it is not always easy to be applied in the factory floor. Perhaps this tool is more suitable for an Industry 4.0 environment, since data gathering and processing can be automated.
Future works
As a recommendation for future research, the implementation of recent mixed MCE and MEC charts with memory in scenarios with underlying non-normal distributions involving a comparative study with other robust control structures are suggested. In addition, it would be interesting to ascertain whether this study can be extended in order to monitor the dispersion parameter, as well as for multivariable control structures.
REFERENCES
Abbas, N. et al. (2011), “Enhancing the Performance of EWMA Charts”, Quality and Reliability Engineering International, Vol. 27, No. 6, pp. 821–33.
Abbas, N. et al. (2013), “Mixed Exponentially Weighted Moving Average-Cumulative Sum Charts for Process Monitoring”, Quality and Reliability Engineering International, Vol. 29, No. 3, pp. 345–56.
Abbas, N. et al. (2014), “An EWMA-Type Control Chart for Monitoring the Process Mean Using Auxiliary Information”, Communications in Statistics -Theory and Methods, Vol. 43, pp. 3485–3498.
Alves, C.C. (2003), CUSUM Control Charts: A Dynamic Approach To The Statistical Analysis Processes. Master's Thesis in Production Engineering, Federal University of Santa Catarina, Florianópolis, SC, Brazil.
Alves, C.C. et al. (2009), “The Use of Sum of Control Charts Cumulative (CUSUM) for monitoring a Machining Process”, IME’s Book, Vol. 27, pp. 45-58.
Alves, C.C. et al. (2013), “Using the Taguchi loss function from the perspective of maximum and minimum regions ARL to optimize the statistical parameters of the control chart CUSUM”, In Kovalesky, J.L et al. (Org.) Inovation and Technology in Production Engineering, Protexto, Quatro Barras, PR, Brazil, pp. 35-56.
Alves, C.C. et al. (2015). “Application of the mixed EWMA-CUSUM control chart for the monitoring of an industrial process”, article presented in XXII Production Engineering Simposium, Bauru, SP, Brazil, 2015.
Aslam, M. (2016), "A Mixed EWMA–CUSUM Control Chart for Weibull-Distributed Quality Characteristics" Quality and Reliability Engineering International, Vol. 32, No. 1., pp. 2987–2994.
Chowdhury, S. et al. (2015), “Distribution-free Phase II CUSUM Control Chart for Joint Monitoring of Location and Scale”, Quality and Reliability Engineering International, Vol. 31, pp. 135–51.
Costa, A.F.B. et al. (2004), Statistical Quality Control, Atlas, São Paulo.
Diniz, F.C.A.R et al. (2013), Statistical Process Control: A Practical Approach to Engineering and Management Graduation Courses, LTC, Rio de Janeiro.
Edmmonds, W.A; Kennedy, T.D. (2013), “An Applied Reference Guide to Research Designs: Quantitative, Qualitative and Mixed Methods”, Sage, London.
Hawkins, D.M; Olwell, D.H. (1998), Cumulative Sum Charts and Charting for Quality Improvement, Springer, New York.
Gil, A.C. (2010) “Como elaborar projetos de pesquisa”, 5th ed., Atlas, São Paulo.
Khoo, M.B.C.; Teh, S.Y. (2009), “A Study on the Effects of Inertia on EWMA and CUSUM Charts”, Journal of Quality Measurement and Analysis, Vol. 5, No. 2, pp. 73-80.
Klein, M. (2000), “Two Alternatives to the Shewhart X Control Chart”, Journal of Quality Technology, Vol. 32, No. 4, pp. 427-31.
Koshti, V.V. (2011), “Cumulative Sum Control Charts”, International Journal of Physics and Mathematical Sciences, Vol. 1, No. 1, pp. 28-32.
Lampreia, S.P.G.F.S. et al. (2018), "Condition monitoring based on modified CUSUM and EWMA control charts", Journal of Quality in Maintenance Engineering, Vol. 24, No. 1, pp. 119-132.
Lee, L.Y. et al. (2013), “A Comparison Between the Standard Deviation On The Run Length (Sdrl) Performance Of Optmal Ewma And Optmal Cusum Charts”, Journal of Quality Measurement and Analysis, Vol. 9, No. 1, pp. 1-8.
Lu, S‐L. (2017), "Novel design of composite generally weighted movingaverage and cumulative sum charts", Quality and Reliability Engineering International, Vol. 33, pp. 2397–2408.
Lucas, J.M. (1982), “Combined Shewhart-CUSUM Quality Control Schemes”, Journal of Quality Technology, Vol. 14, No. 2, pp. 51–9.
Lucas, J.M; Saccucci, M.S. (1990), “Exponentially Weighted Moving Average Control Schemes: Properties and Enhancements”, Technometrics, Vol. 32, No. 1, pp. 1-12.
Mingoti, S.A.; Neves, O.F. (2005), “Using Geostatistics to Estimate theVariability of Autocorrelated Processes” Brazilian Journal of Operations & Production Management, Vol. 2, No. 1, pp. 39-56.
Moraes, D.A.O. et al. (2015), “On the Hotelling’s T, MCUSUM and MEWMA Control Charts’ Performancewith Different Variability Sources: A Simulation Study”, Brazilian Journal of Operations & Production Management, Vol. 12, No. 2, pp. 196-212.
Montgomery, D.C. (2013), Introduction to Statistical Quality Control, 7th ed., John Wiley & Sons, New York.
Nazir, H.F. et al. (2013), “Robust CUSUM Control Charting”, Quality Engineering, Vol. 25, No. 3, pp. 211-24.
Nazir, H.F. et al. (2015), “Robust CUSUM Control Charting for Process Dispersion”, Quality and Reliability Engineering International, Vol. 31, No. 3, pp. 369-79.
Osei-Aning, R. et al. (2017), "Mixed EWMA-CUSUM and mixed CUSUM-EWMA modified control charts for monitoring first order autoregressive processes" Quality Technology and Quantitative Management, Vol. 14, No. 4, p. 429-453.
Page, E.S. (1954), “Continuous Inspection Schemes”, Biometrika, Vol. 41, pp. 100-15. R Core Team (2018), R: A language and environment for statistical computing. R Foundation for Statistical Computing, Vienna, Austria. URL https://www.R-project.org/.
Riaz, M. et al. (2011), "Improving the performance of CUSUM charts”, Quality and Reliability Engineering International, Vol. 27, No. 4, pp. 415–24.
Roberts, S.W. (1959), “Control Charts Tests Based on Geometric Moving Averages”, Technometrics, Vol. 1, pp. 239-50.
Ryan, T. (2011), Statistical Methods for Quality Improvement, 3rd ed., John Wiley and Sons, New York.
Scrucca, L. (2004), “qcc: an R package for quality control charting and statistical process control”, R News, Vol. 4, No. 1, pp. 11-17.
Vargas, V.C.C. et al. (2004), “Comparative study of the performance of the CuSum and EWMA control charts”, Computers & Industrial Engineering, Vol. 46, No. 4, pp. 707-724.
Wheeler, D.J. (2004), Advanced Topics in Statistical Process Con: The Power of Shewhart's Charts, 2nd ed., SPC Press Incorporated, Tennessee.
Woodall, W.H.; Adams, B.M. (1993), “The Statistical Design of CUSUM Charts”, Quality Engineering, Vol. 5, No. 4, pp. 559-70.
Zaman, B. et al. (2015), “Mixed Cumulative Sum–Exponentially Weighted Moving Average Control Charts: An Efficient Way Of Monitoring Process Location”, Quality and Reliability Engineering International, Vol. 31, No. 8, pp. 1407–21.
Zaman, B. et al. (2016), "Mixed CUSUM-EWMA chart for monitoring process dispersion", The International Journal of Advanced Manufacturing Technology, Vol. 86, pp. 3025–3039.
Received: 01 Apr 2018
Approved: 09 Dec 2018
DOI: 10.14488/BJOPM.2018.v16.n1.a1
How to cite: Alves, C. C.; Konrath, A. C.; Henning, E. et al. (2019), “The Mixed CUSUM-EWMA (MCE) control chart as a new alternative in the monitoring of a manufacturing process”, Brazilian Journal of Operations & Production Management, Vol. 16, No. 1, pp. 1-13, available from: https://bjopm.emnuvens.com.br/bjopm/article/view/473 (access year month day).