Critical analysis of Lean Construction measuring tools
Arthur Felipe Echs Lucena
eng.arthurlucena@gmail.com
State University of Maringá, Maringá, Paraná, Brazil.
Luci Mercedes De Mori
lmmori@uem.br
State University of Maringá, Maringá, Paraná, Brazil.
ABSTRACT
The Lean Construction philosophy emerged to assist overcome the challenges in optimizing the productive processes of companies. As an effort to quantify the application degree of Lean philosophy in the civil construction companies, several measurement tools were created. In order to discuss the effectiveness of these tools into measuring the presence of the Lean philosophy in construction sites, the present study performed a critical analysis of its methodological procedures, based on four aspects: ‘questionnaires and forms’, ‘answering system’, ‘data collection methodology’, and ‘results’. Although it was not possible to investigate measuring tools from other countries, it was concluded that, among Brazilian methods, the one developed by Pereira (2012) is the most suitable for use since it presented just few problems in its formulation. This way, it is possible to do the intended measurement with assertiveness, substantially contributing to civil construction development.
Keywords: Toyota Production System; Civil construction; Construction sites; Construction management; Production management.
INTRODUCTION
The policy and economic crisis that has reached Brazil since 2014 has had direct consequences on the construction industry. Both the national GDP and the GDP relative to the Brazilian civil construction are in a critical situation, registering, in 2016, negative variations of 3.6% and 5.2% in relation to the previous year, respectively (CBIC, 2017a). This situation is also evident in the evolution of jobs in the area: in the first quarter of 2014, there were 8,039 employees in construction; three years later, this number was substantially reduced to 6,836 employees, resulting in a 15% drop (CBIC, 2017b).
In this scenario, in order to be successful in a very unstable market, the construction companies that operate in the sector need to recognize the problematic activities that could be improved in their production process. For this purpose, a management philosophy known as Lean Construction stands out. According to Oliveira et al. (2010), this ideology aims to reduce or eliminate activities in the production process that do not add value to it, making the process flow more agile and focused on customer’s needs, providing continuous improvement and waste elimination.
However, a decade after the technical report written by Koskela (1992), considered a great reference to the Lean Construction philosophy, Pichi (2003) stated that there was no extensive applications of Lean’s ideas in the construction industry – a fact also observed nowadays. Machado and Heineck (2015) warn that, in many cases, this has happened because there is a skepticism about the real contribution of the philosophy to identify what value is for the clients and, consequently, to provide real benefits to the productive systems.
Thus, it became necessary to establish clearer guidelines about the Lean Construction principles, in order to facilitate its dissemination, providing parameters that allow comparisons of the achieved performance. Then, several tools have been developed in the last decade to measure the degree of Lean application in construction companies.
However, among the existing tools, none is unquestionably accepted by all researchers. Therefore, the applications of each method recorded in the literature are restricted, almost exclusively, to the creation and validation experiments of their respective authors. For this reason, it has become difficult for those who intend to join the ideology to compare their performance with other companies in the sector.
In this context, the present study becomes very important, since it aims to discuss the efficiency of these tools in measuring the Lean Construction presence in construction companies. Thus, it promotes discussions on the subject, contributing to the development of more elaborate and assertive methods. In addition, it is possible to determine parameters to assist in the ranking of the existing measurement instruments, thus, it is possible to define which the best tool to be used is, considering the nature and needs of each construction site being analyzed.
LITERATURE REVIEW
According to Koskela (1992), the Lean philosophy emerged in Japan in the 1950s. Its application to the civil construction segment gained notoriety since the publication of Koskela (1992), answering by the name of Lean Construction. In his study, Koskela (1992) suggested eleven principles to seek the goals from Lean philosophy. Based on these and other similar principles, several authors have developed methods to quantify the presence and the development level of the Lean philosophy in construction sites, such as the tools created by Hofacker et al. (2008), Carvalho (2008), Pereira (2012), Kurek et al. (2013), Tonin and Schaefer (2013) and Souza and Cabette (2014).
The Lean philosophy and its principles
The Lean Construction philosophy emerged as an alternative to the Traditional Production System, production ideology most adopted nowadays. Based on this system, a productive process should be understood as the result of many conversions required to obtain the final product. In the civil construction’s case, conversion could be understood as being material or labor transformations, and the final product refers to the building itself (Oliveira et al., 2010).
However, from Lean’s perspective, this same process must be understood in another way: as a flow of information and/or materials, which transforms raw material into a final product. Thus, the great divergence observed in relation to the previous model is that, considering the process as a flow, it is emphasized that the raw material, throughout the cycle, is processed (converted), but also inspected, transported and stored (Koskela, 1992).
This conceptual change has a direct impact on the process efficiency, since it suggests that the process can be optimized with changes in the conversion activities and, especially, in the flow activities. While both actions have cost and time to be executed, only the conversion ones add value to the process; thus, flow activities must be eliminated or at least reduced to global process improvement (Oliveira et al., 2010). In this context, Koskela (1992, p.16) developed eleven basic principles to be followed for the correct introduction of the Lean philosophy in a productive process:
a) reduce the share of non-value-adding activities;
b) increase output value through systematic consideration of customer requirements;
c) reduce variability;
d) reduce the cycle time;
e) simplify by minimizing the number of steps, parts and linkages;
f) increase output flexibility;
g) increase process transparency;
h) focus control on the complete process;
i) build continuous improvement into the process;
j) balance flow improvement with conversion improvement;
k) benchmark.
The LCR method, by Hofacker et al. (2008)
The first Lean Construction measuring method to obtain notoriety was the Rapid Lean Construction-quality Rating Model (LCR), created by Hofacker et al. (2008). Two years later, the same authors reported the experience of the application of this tool in four construction companies, described in Oliveira et al. (2010).
Conceived with the purpose of being fast and practical to be used, the method requires two researchers who must have deep knowledge in terms of the theoretical aspects of Lean philosophy. The tools consist in fulfilling an evaluation form of thirty questions subdivided into six categories, assisted by an on-site visit to the construction site under analysis. This process has the estimated duration of one hour. For each question, the evaluator assigns a score ranging from 0 to 6, in which 0 represents the worst possible performance on the topic analyzed (Oliveira et al., 2010).
After completing the evaluation form, the performance percentages are calculated for each category, considering the ratio between the total reached points and the total of possible points to be achieved. These results are presented in a graphic, as shown in Figure 1 (Oliveira et al., 2010).
Figure 1. Radar graphic with the results from a LCR application
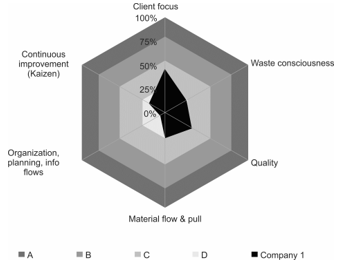
Source: adapted from Oliveira et al. (2010, p. 168)
According to the authors, the results are also exhibited by a percentage index that lists all the evaluated topics. To do so, the ratio between the total assigned points and the possible total of points is calculated. This index is compared to a rating scale that provides a qualitatively analysis of the achieved performance.
Method of Carvalho (2008)
The tool created by Carvalho (2008) consists of a structured form as the protocol for data collection, complemented by visits to the construction sites of the analyzed company. The form has 204 questions based on and divided among the eleven principles proposed by Koskela (1992). It is answered during an interview with important professionals related to the corporation, necessarily involving professionals from the sectors: directors’ board, engineering, production employees, suppliers, designers, and clients. The interviews takeup to 45 minutes and are conducted by a person who is not from the company, but which has extensive knowledge on Lean philosophy. The interviewees need to answer the questions by classifying the company’s performance with a scale ranging from 0 to 3, in which 0 represents the worst possible performance (Carvalho, 2008).
According to the author, based on the data obtained in each interview, the arithmetic mean of the scores given by the interviewees are calculated. These means are determined by category and by the interviewee’s sector. Subsequently, an overall arithmetic mean is also calculated, using the answers of all the interviewees in all categories evaluated. Considering the maximum value that each mean could reach, the means previously determined are converted into performance percentages. Based on these, the company can observe in which profile it fits, according to a classification suggested by Carvalho (2008). Similarly, to the LCR method, the author points out that the percentages of such performance can also be displayed by radar-type graphs.
Method of Pereira (2012)
Pereira (2012) developed a method that must be applied to engineers that work directly in the construction site of the companies under study. According to the author, her tool consists in a questionnaire composed of 40 questions, subdivided into 12 categories. The questions are objective, so, there answers are already predefined for each question. Then, the evaluator needs to choose the alternative that best represents the company’s performance in relation to that topic.
For results analysis, a score ranging from 1 to 3 is initially determined for each predefined answer, depending on the classification level in which it fits. Then, for each alternative, it is identified the percentage of people who selected it, and multiplied by the score that was previously determined. An arithmetic mean is obtained, resulting in the final classification level of that question (Pereira, 2012).
After the individual analysis of the questions, another arithmetic mean is calculated, based on the final results of the questions related to each category, obtaining the application level of each category in the company. Finally, a new arithmetic mean between the scores attributed to each category is obtained, resulting in a unique index that symbolizes the application degree of the Lean philosophy in the analyzed company (Pereira, 2012).
Method of Kurek et al. (2013)
The model presented by Kurek et al. (2013) is based on a questionnaire of 36 questions, inspired by the Lean Construction principles suggested by Koskela (1992). For each question, one of the following options must be ticked: ‘yes’, ‘no’ or ‘not applicable’, depending on the company’s situation. Then, the Lean Construction score by principle, ‘IPi’, is calculated, using Equation 1 (Kurek et al., 2013):

In which,
IPi: Lean Construction score by principle [%];
PO: obtained points;
PP: possible points.
Finally, the general indicator of Lean Construction, ‘ICE’, obtained through the weighted mean of the ‘IPi’, is determined. According to the authors, the calculations of the ‘IPi’ allows identifying which principles are contemplated in the production practices of the construction site, while the determination of ‘ICE’ provides a holistic view of the productive process implanted (Kurek et al., 2013).
Method of Tonin and Schaefer (2013)
Tonin and Schaefer (2013) developed a method with 37 questions about the Lean philosophy application in the construction site analyzed, grouped by the Lean Construction principles suggested by Koskela (1992). Such questions are based on an earlier version of the method of Kurek et al. (2013), and also ask the interviewee to choose between ‘yes’ or ‘no’ options to characterize the company’s behavior in each topic (Tonin and Schaefer, 2013).
Based on the obtained data, a percentage of the company’s performance is determined in relation to each Lean Construction principle, using the same equation suggested by Kurek et al. (2013) to obtain the ‘IPi’ (see Equation 1). Based on this percentage, the company gets a score, considering each principle being analyzed. Finally, it is possible to calculate the Lean Construction Application Level ‘NALC’, percentage index suggested by Tonin and Schaefer (2013) as the ratio between the sum of the partial scores assigned to each principle and the total possible for that sum. Based on this index and the performance scale developed by the authors, the corporation can observe its situation in relation to the application of the philosophy (Tonin and Schaefer, 2013).
Method of Souza and Cabette (2014)
The method created by Souza and Cabette (2014) to measure the use of the Lean philosophy in construction sites consists in the use of several instruments, such as informal dialogues and interviews, questionnaires and periodic technical visits, throughout the Lean implementation process in the corporation. Regarding the questionnaire, it is composed of 27 questions, grouped by the Lean principles suggested by Koskela (1992). They are essay questions; thus, the evaluator must report, in his own words, the company’s performance in relation to each addressed subject (Souza and Cabette, 2014).
METHODOLOGY
The present research was developed considering as objects of study the Lean Construction measuring methods created by Hofacker et al. (2008), Carvalho (2008), Pereira (2012), Kurek et al. (2013), Tonin and Schaefer (2013) and Souza and Cabette (2014). The study was divided in three stages:
a) bibliographic research and data collection;
b) critical analysis of the Lean Construction measuring tools;
c) comparison of the methods of measurement of the Lean Construction.
Thus, the first stage of the study had the purpose of collecting enough information on the behavior of each method being studied. The bibliographic research was carried out consulting articles published in scientific journals, annals of scientific events, books, theses, dissertations, and monographs found using the digital research tool Google Scholar, platform Scielo and CAPES Periodicals. The search was developed in Portuguese, English and Spanish languages.
In the second stage of the study, a critical analysis of each measurement method under study was conducted, in order to identify the advantages and disadvantages in the use of each tool. Thus, the analysis was developed considering four topics: ‘questionnaires and forms’, ‘answering system’, ‘data collection methodology’, and ‘results’. In Table 1, it is detailed what was analyzed in each topic.
Table 1. Details of the analyzed topics
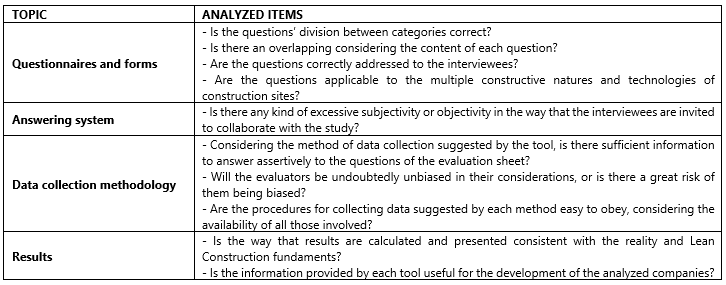
Especially in the topic related to the questionnaires and forms, a quantitative survey was carried out in each evaluation sheet, considering the most problematic aspects observed. The number of issues associated with the following problems was quantified:
a) problematic ‘A’: partial or total overlapping occurs in relation to another question;
b) problematic ‘B’: the division made by the author of the method, pointing to a certain category as the one most affected by the question, is incorrect;
c) problematic ‘C’: the question affects more categories beyond that one pointed out by the author of the method.
The problematic ‘C’ was also detailed through subcategories, evidencing the number of categories affected by the questions.
Finally, in the last stage of the study, the advantages and disadvantages in the use of each method discussed in the previous stage were analyzed comparatively to all the studied tools, in order to observe which methods were generally more efficient in measuring the Lean philosophy presence in construction companies.
RESULTS AND DISCUSSIONS
Individually, each tool presented several advantages and disadvantages in its use. However, as the performances of the methods were compared, it was possible to observe that some tools were more efficient than others in measuring the Lean Construction presence in the construction companies.
Topic ‘questionnaires and forms’
Through the analysis of the evaluation sheets of the methods, it was noticed that all methods specify one single category for each question, which is chosen considering the one that is the most influenced by that question. However, by choosing only one category to represent each question, its influence in other categories is neglected, negatively affecting the method’s results.
An example is the category ‘improving process transparency’, used by Kurek et al. (2013). The division made by the authors characterizes this category based on actions related to the construction site cleaning and organization. Though, other issues could also be associated with this category, such as those related to the building management and the communication among the work team. Therefore, a company that has good team communication and also a good management, attitudes that corroborate with the transparency of its processes, could be evaluated with a null performance in this category, just because the corporation cleaning an organization is unsatisfactory.
In some cases, the division of the questions among the categories that they most affect is wrong. Thus, there is a worsening of the problem previously mentioned, because, in some questions, besides the score not being attributed to other categories related to them, their evaluation is directed to a theme that does not match what is being analyzed. That is the case of the question ‘is there standardization in the form and quantity of materials delivery?’, presented in Carvalho (2008) evaluation sheet. This question is classified in the category ‘simplify and minimize the number of steps and parts’. However, there is no direct correspondence between the question and the category – it is possible to establish standardized processes in materials delivery without this resulting in a reduction in the number of steps or parts. Therefore, it would be more correct to classify this question based on the category ‘reduce variability’ and the other categories also affected by it.
Another problematic aspect of the questionnaires and forms concerns the partial or total overlapping among some questions. At first, this characteristic could be confused as a solution to the problematic of the bad division of the topics previously presented, since this way the same information would be considered in different categories. However, this is not the best solution to the presented problem, since it generates other problems: when asked about the same information at different times, the interviewee may feel confused, and yet he provides conflicting answers that decrease the reliability of the results generated by the tool. As an example, the form of Carvalho (2008) is cited. In a certain moment, the interviewee is asked if ‘is there any control over the employees’ productivity?’; then, on another moment, the same interviewee is asked to ‘classify the existing control over the employees’ productivity’. As can be noticed, the questions are quite similar, if not equivalent.
In general, the mentioned problems are very recurrent in the measuring tools analyzed. In Tables 2 and 3, it is presented the quantification of inconsistencies found in each method. The tool developed by Pereira (2012) is the one that presents fewer inconsistencies. On the other hand, the methods of Tonin and Schaefer (2013) and Kurek et al. (2013) were quite problematic in this aspect, registering high percentages in the three analyzed issues. The high indexes registered for the problematic ‘C’ are also disturbing, considering that it shows that most of the questions affect other categories than the one in which they are classified. This influence focuses on one or two categories, as can be seen in Table 3.
Table 2. Percentages of the problematics ‘A’, ‘B’ and ‘C’ in each method
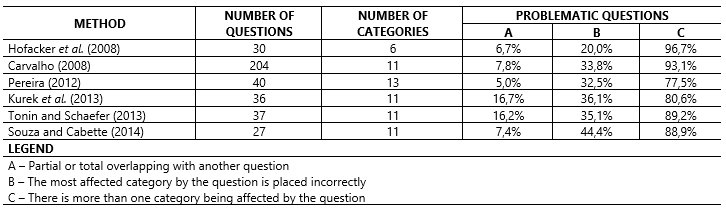
Source: The authors themselves.
Table 3. Detail of problematic ‘C’
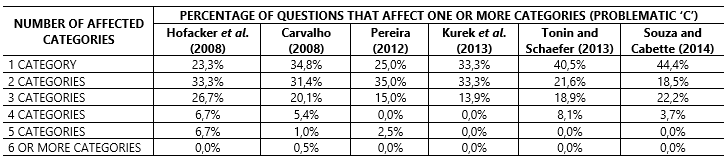
Source: The authors themselves.
In addition to the problematics previously discussed, there are also deficiencies in the way that some questions are directed to the person who will answer the evaluation form. In some cases, some information is requested from the interviewee; however, it is unlikely that he will know it; thus, the answer will be inaccurately or he will refuse to answer it, making it impossible to correctly apply the method. This happens, for example, in the tool created by Carvalho (2008), in the part that is directed to the sector of ‘suppliers’ of the company. The interviewee is asked if ‘the process of materials acquisition is transparent on the part of the construction company’ and if he ‘was forced to use protective equipment such as boots, trousers and helmets to enter the construction site’. However, addressing both questions to him is a fact considered problematic: if the interviewee is from the supplier’s purchasing department, he may not be able to answer the second question; on the other hand, if the interviewee is responsible for the supplier’s deliveries, the first topic will probably not be answered assertively.
Positively, the method of Pereira (2012) stands out because of the way it directs the questions to the interviewee. According to the author, her questionnaire was prepared to be answered by the engineer responsible for the construction site and, according to what was observed, the questions were written in order to request information exclusively about the construction site, which is the kind of information that this professional probably has. Finally, with regard to the methods of Kurek et al. (2013) and Souza and Cabette (2014), this analysis could not be done, since the authors do not make clear to whom the respective forms and questionnaires are addressed.
The specificity and applicability of the forms and questionnaires are also an aspect whose analysis should be highlighted. Currently, there is a range of buildings in the construction sector with quite different characteristics, and some constructive solutions that fit into some projects may not be useful in others. In this way, evaluation sheets that inquire about the use of very specific constructive techniques are problematic, since in many case these techniques simply do not fit the nature or the strategic planning of the construction company and, therefore, should not decrease its evaluation score.
In the method of Hofacker et al. (2008), this happens in the question that asks about the ‘use of ready mixed concrete (use = 6; made in the construction site = 0)’. In some cases, concrete is not used or its use is minimal, therefore is unjustifiable to receive a negative grade in the evaluation just because the ready mixed concrete is not used. In the form of Carvalho (2008), this type of problem occurs at various times, as in the question that asks whether ‘materials are delivered on pallets or similar’. Depending on the type of material that the supplier offers to the company, this topic does not make sense, since some materials used in construction, such as concrete and sand, do not need such elements for proper transportation and storage.
Topic ‘answering system’
The way that the interlocutor is invited to contribute to the research represents an important role in the accuracy and assertiveness of the generated results, considering it is what regulates the level of objectivity and subjectivity that is expected from the answer. In the case of the method applied by Hofacker et al. (2008), the adopted system is a score based on the Likert scale. Thus, the fulfilling of the evaluation form is done by assigning a score from 0 to 6 for each analyzed topic. This system is problematic, since it has two main issues:
a) there is an odd number of graduation levels (seven levels). This collaborates to the existence of a central term in the scoring scale, which is unconsciously understood as neutral by the interlocutor. Thus, there is a tendency for the evaluation to be misdirected to this neutral term whenever the evaluator is uncertain about his answer;
b) the multiple possibilities of choice existent in that scale creates room for the given answers to be too interpretive and subjective, guided primarily by common sense and previous experiences of the interlocutor. As an example, the following question of the evaluative chart of Hofacker et al. (2008) ‘degree of mechanization (technical machining) to obtain a standard quality & performance, facilitating smooth and efficient construction processes’ stands out. If the evaluator took part in the construction of projects with a high degree of industrialization, possibly the given score would be based on the comparison with these previous experiences and, therefore, it would be low (negative). On the other hand, if the interviewee had experiences in projects that use essentially manual processes, his reference for assigning the punctuation would be those experiences. Thus, the evaluation of this question considering the same construction site of the previous case would be possibly more positive.
Carvalho (2008), in his method, improves the evaluation scale presented by Hofacker et al. (2008), since it corrects the problem mentioned in subparagraph ‘a’, presenting only four levels of assessment (score from 0 to 3). However, although the use of a lower number of punctuation levels mitigates the problem presented in subparagraph ‘b’, the use of this system does not completely correct the problem, as it still presents excessive subjectivity in the given answers.
Another possibility of answering system is the one used by Kurek et al. (2013) and Tonin and Schaefer (2013), which consists in answering every question with ‘yes’, ‘no’ or ‘not applicable’. This model of responses is quite different from the evaluation scale presented by Hofacker et al. (2008) and Carvalho (2008), and also corrects the excess of subjectivity of the answers, existent in the previous models. On the other hand, it presents its own issues, as the impossibility of assigning a medium grade in a question.
As an example, the following question of the evaluative chart of Kurek et al. (2013) stands out: ‘is there a planning of the production process?’. Possibly, there will be construction sites in which there is a production planning, but it is precarious and can be improved. When filling in the evaluation form of this tool, however, the evaluator can only choose between the ‘no’ (no planning at all) and ‘yes’ (existence of the planning, without specifying its quality and usefulness) options. Regardless of the choice elected by the interlocutor, the answer will not be sufficiently representative, since the information that the planning is deficient is neglected in the analysis.
Finally, there is the answering system adopted by Pereira (2012), which uses multiple choices closed questions. This system is well suited to balance the objectivity and subjectivity of the answers, as it allows little room for the interpretation of the evaluator (the answers are already written, so he only needs to elect one), while presenting different levels of evaluation for the question, and not only extreme levels.
Topic ‘data collection methodology’
Regarding the way that the information is collected throughout the applications of the tools for later filling out their evaluative sheets, no method was considered exemplary in this aspect. The tools of Hofacker et al. (2008), Tonin and Schaefer (2013), Kurek et al. (2013) and Souza and Cabette (2014), for example, assign an active role in the evaluation to the researcher who is assisting the tool’s application, as he is unrelated to the company being analyzed. Thus, in order to obtain enough information to answer the questionnaire, the instruction given by the authors is to make an on-site visit to the construction site, and also carry out dialogues with the work team. However, this model of data collection is quite precarious, since the procedures performed by each construction company are unique and complex; therefore, the use of the suggested methodology will hardly be done with the proper degree of precision and specificity required. As a consequence, there is a lack of information to answer precisely and assertively to the evaluation sheet.
In an attempt to correct this problem, Carvalho (2008) and Pereira (2012) advise that the professionals of the construction company and its stakeholders must do the forms’ fulfilling. Thus, the data come from the daily experiences of these professionals in the corporation, rich in accuracy and specificity of information, which the previous methods lacked. However, assigning this active role in the evaluation to the company’s own employees encourages the appearance of another issue: the lack of impartiality at the time of attributing the scores. Especially in the method of Carvalho (2008), considering its high level of subjectivity, the interviewees invited to contribute to the research, at the time of evaluation of each question, can be tended to respond to the research based on what they would like to see happening in the company, rather than what actually happens. Similarly, an employee unsatisfied with his work may present quite negative scores if compared to the reality.
Finally, a particularity of the method of Carvalho (2008) should be discussed: the division into six parts, each one directed to a sector of the corporation (directors’ board, engineering, production employees, suppliers, designers, and clients). This procedure has great advantages, such as the possibility of comparing the analysis through different perspectives, in addition to obtaining a final evaluation with more homogeneity. However, the applicability of this tool is quite damaged, since it depends on the availability and willingness of several people to participate in the research.
Topic ‘results’
When analyzed from the perspective of their results, some methods are quite inconsistent. The method of Carvalho (2008), for example, presents some conceptual problems in the elaboration of its form. One of these problems occurs on the topic in which the professional related to the supplier’s sector of the company is asked the following: Are there large inventories in the supplier’s yard? One of the Lean Construction precepts is the Just-In-Time system (JIT), which gives preference to using small storages with only the essential materials (reducing ‘storage’ flow activity). Thus, assigning a good performance score to the construction company when its supplier has a large inventory is a contradiction to what Lean philosophy affirms, a fact that directly affects the assertiveness of the results generated by the tool.
Still regarding the thematic of the coherence of the methods in relation to what Lean Construction affirms, it was noticed a problem that occurs in all the analyzed tools. In the step when the final results are determined, all methods choose to consider their categories with the same importance. However, it is imperative to remember the main purpose of Lean philosophy, which seeks to add greater value to the generated product, reducing what does not add value to it. In order to achieve this goal, certain actions are more efficient than others. Thus, weighting them in an equal way is quite damaging to the assertiveness of the method.
An example of this problem is found in the evaluative chat of Hofacker et al. (2008). In the question ‘client focus, in terms of sales, marketing & strategy focus, detecting what Value is for the client (& how well it is perceivable for the visitor)’, the practices of great importance to the correct implementation of the philosophy are analyzed and, consequently, this topic requires great effort to be satisfactorily achieved. In another question of the same questionnaire, it is asked about the ‘Kanban card system (existence and well operated)’. This practice is very useful for improving the company’s processes; however, it does not have the same degree of importance as the actions analyzed in the previous question. Nonetheless, both questions have the same weight when analyzing the methods results, which is unjustifiable.
Another aspect whose discussion is essential refers to the consistency of the results presented by the methods in relation to the reality of the construction company analyzed. In an application of the methods of Hofacker et al. (2008), Carvalho (2008) and Tonin and Schaefer (2013), developed by the authors of this study in two construction companies in the city of Maringá/PR, it was noticed that the results presented by the three measurement instruments were not very strict in relation to what was verified in loco. None of the construction companies analyzed knew Lean Construction precepts and, therefore, it was expected that their performances would be characterized with low scores. However, the results presented by each tool diverged from this expectation, showing levels of excellence in the performance of the corporations.
Regarding the tools of Pereira (2012), Kurek et al. (2013) and Souza and Cabette (2014), the problems previously mentioned in their evaluation cards, data collection method and answering system suggest that they will also present results with inconsistencies. However, since the applications of these tools developed by their authors lack data in relation to the real situation of the analyzed site, it became impracticable to conduct deeper discussions on the subject.
Finally, when analyzed regarding the usefulness of their results so that the construction company can optimize its processes, the tools have positive and negative highlights. Positively, the tool of Carvalho (2008) stands out as it provides diversity of information, enabling a range of different analyzes. By contrasting the opinions of each one of the six company’s segments that were interviewed, it is possible to establish comparisons between what the company’s employees think (board of directors, and engineering and production sectors’ employees) and the image that is effectively transmitted to the corporation’s stakeholders (clients, suppliers and designers sectors). In addition, due to the use of graphics, the analysis understanding is also facilitated.
Negatively, the emphasis is given to the methods of Kurek et al. (2013) and Tonin and Schaefer (2013), whose final results are presented with mathematical indexes, calculated based on the answers given in the evaluation sheet. This model of results presentation is not very useful to the company, since it provides information in a very abstract way, without further analysis or comparisons. In particular, the method of Tonin and Schaefer (2013) presents a scoring scale that mitigates this problem, but it is not able to solve it completely.
Souza and Cabette (2014) also formulated their tool in a way that is damaging to subsequent analysis that could contribute to the company’s development. Essentially, its questionnaire is structured to be answered in a discursive way, making impossible the statistical analysis of the data collected. Therefore, what is actually done is a reflection on the situation, in a very subjective way and dependent on the interpretation of each individual.
Comparison of the performances presented by each tool
Based on what was previously discussed, it was noted that the methods of Pereira (2012) and Carvalho (2008) are considered the most efficient in measuring the use of the Lean Construction philosophy in the construction companies. The method of Pereira (2012) stood out positively in the four analyzed topics, presenting easy application and methodological procedures quite cohesive that promote the impartiality in the obtained answers. These characteristics foment assertiveness in the process of measurement of the presence of the Lean philosophy. Regarding the tool developed by Carvalho (2008), although several inconsistencies were pointed out in its formulation, it was observed a great performance of the method in relation to the utility of its results for processes’ optimization. This aspect, in particular, had a great positive influence on the analysis of the method, considering that providing information that helps the development of the analyzed companies is the main purpose of the process of measuring the application degree of the Lean Construction.
Negatively, the highlight is the tools of Kurek et al. (2013) and Souza and Cabette (2014). These methods presented several problems in their formulations; therefore, it was observed that their results lack assertiveness and usefulness to the process of implementation of Lean philosophy in companies.
Regarding the methods of Hofacker et al. (2008) and Tonin and Schaefer (2013), the performed evaluation considered them as medium. In fact, such methods do not present procedures with serious inconsistencies in their formulations, which would substantially damage their efficiency. On the other hand, due to small problems observed, they also do not stand out in relation to the other methods.
CONCLUSION
In this research, it was possible to evaluate which methods are more efficient in terms of measuring the presence of the Lean Construction in construction companies, reaching the objective of this study. Based on the aspects that were discussed, the conclusion is that the measurement instrument that is most efficient to quantify the use of Lean philosophy in companies is the method of Pereira (2012), which presented a coherent procedure, also simple to be executed. On the other hand, the method of Souza and Cabette (2014) presented many inconsistencies in its formulation, mainly with respect to the usefulness of its results; therefore, when compared to the other measuring instruments, it was considered the least efficient.
In general, however, it was observed that there is not yet a method that is unambiguous and incontestable in the thematic of the measurement of the use of Lean Construction. Even the methods of Pereira (2012) and Carvalho (2008), which stood out positively in the analysis, presented small problem is their formulations. Due to these factors, it was concluded that the measurement instruments analyzed are only an auxiliary tool to the process of implementation of Lean philosophy in the construction companies. Thus, they do not eliminate the presence of a qualified professional, with remarkable knowledge on the subject, who can evaluate in a more specific way the reality of the analyzed company.
In this context, as a suggestion for future research, it is indicated the development of new tools that can be applied only by the manager of the construction site under analysis, dispensing, at least in the initial phase of the implementation of the philosophy, the presence of a researcher with deep knowledge on Lean Construction. Thus, the procedures will be simplified, but will also be useful to the introduction of the Lean philosophy in companies, since it does not depend on external people to be used. However, once the company progresses and needs more complex procedures and analysis to continue the course of implementing the philosophy, the presence of an experienced specialist becomes indispensable. Thus, the suggestion is that these new tools should be developed with the perspective of being only an ‘initial step’ in the implementation of Lean philosophy in companies.
REFERENCES
Câmara Brasileira da Indústria da Construção (CBIC) (2017a), “Boletim Estatístico. Ano XIII, n. 3”, available from: http://www.cbicdados.com.br/media/anexos/ Boletim_Ano13n03.pdf (access 2018 May 21).
Câmara Brasileira da Indústria da Construção (CBIC) (2017b), “PIB Brasil e Construção Civil”, available from: http://www.cbicdados.com.br/menu/pib-e-investimento/pib-brasil-e-construcao-civil (access 2018 May 21).
Carvalho, B. S. (2008), Proposta de uma ferramenta de análise e avaliação das construtoras em relação ao uso da Construção Enxuta, Dissertação de Mestrado em Construção Civil, Universidade Federal do Paraná, Curitiba, PR.
Hofacker, A. et al. (2008), “Rapid Lean Construction - Quality Rating Model”, article presented in: IGLC: International Group for Lean Construction, Manchester, UK, 2008.
Koskela, L. (1992), “Application of the new production philosophy to the Construction industry”, Technical Report, No. 72.
Kurek, J. et al. (2013), “Implantação dos princípios da Construção Enxuta em uma empresa construtora”, Revista de Arquitetura da Imed, Vol. 2, No. 1, pp.20-36.
Machado, R. L.; Heineck, L. F. M. (2015), “Estratégias de produção para a Construção Enxuta”, available from: http://www2.ucg.br/nupenge/pdf/Ricardo_Machado_I.pdf (access 2018 May 21).
Oliveira, B. F. et al. (2010), “Um modelo de avaliação do grau de aplicação de ferramentas Lean em empresas construtoras: o Rapid Lean Construction-Quality Rating Model (LCR)”, Revista Iberoamericana de Engenharia Industrial, Vol. 2, No. 2, pp.156-74.
Pereira, M. C. (2012), Avaliação e análise da aplicação da filosofia Lean em empresas de Construção Civil da região metropolitana de Belo Horizonte, Monografia de Especialização em Construção Civil, Universidade Federal de Minas Gerais, Belo Horizonte, MG.
Picchi, F. A. (2003), “Oportunidades da aplicação do Lean Thinking na construção”, Ambiente Construído, Vol. 3, No. 1, pp. 7-23, available from: http://seer.ufrgs.br/index.php/ambienteconstruido/article/view/3439/1853(access 2018 May 21).
Souza, B. C.; Cabette, R. E. S. (2014), “Gerenciamento da Construção Civil: estudo da aplicação da Lean Construction no Brasil”, Revista de Gestão & Tecnologia, Vol. 1, No. 2, pp.21-6.
Tonin, L. A. P.; Schaefer, C. O. (2013), “Diagnóstico e aplicação da Lean Construction em uma construtora”, Iniciação Científica Cesumar, Vol. 15, No. 1, pp. 23-31.
Received: 09 Feb 2018
Approved: 08 May 2018
DOI: 10.14488/BJOPM.2018.v15.n2.a13
How to cite: Lucena, A. F. E., De Mori, L. M. (2018), “Critical analysis of Lean Construction measuring tools”, Brazilian Journal of Operations & Production Management, Vol. 15, No. 2, pp. 311-321, available from: https://bjopm.emnuvens.com.br/bjopm/article/view/453 (access year month day).