Waste remanufacturing modeling originated from household equipment
Eugênio de Oliveira Simonetto
eosimonetto@ufsm.br
Federal Universityof Santa Maria, Santa Maria, Rio Grande do Sul, Brazil.
Goran D. Putnik
putnikgd@dps.uminho.pt
Universityof Minho, Guimarães, Portugal.
Peter Butala
peter.butala@fs.uni-lj.si
University of Ljubljana, Ljubljana, Slovenia.
António Alberto Caetano Monteiro
cmonteiro@dem.uminho.pt
Universityof Minho, Guimarães, Portugal.
Abstract
The growing generation of solid waste is one of the environmental problems that have most affected the world population in recent years. The solid waste generated from home appliances and information technology devices are one of the classes that concern the international community, since they have high toxicity and high potential of environmental pollution. This article presents the design, implementation and testing of a model aimed to evaluate the possibility of their remanufacturingfrom the waste originated from household equipment. In the case developed for the article the waste of printers (inkjet and laser), scanners and computerswere evaluated forthe development of a three dimensional printer (3D Printer). The System Dynamics methodology was used to implement the model, and to verify and validate it.There experiments using three scenarios were developed: an uncertainty scenario with a random rate between 25% and 75% of waste reuse; thegrowth scenario with a rate from 25% to 75% of waste reuse (growth of 5% per year) and; static scenario with a rate of 50% of waste reuse during the simulated time.Results generated by the simulation modelshow that the remanufacturing is a viable alternative for the reutilization of the discarded household equipment.
Keywords: Simulation; Reuse; Waste; Remanufacturing Scenarios.
Introduction
Population growth combined with the rapid technological innovation has significantly increased the generation of solid waste worldwide. However, this increase results in significant problems for the population. Among the main problems can be mentioned the lack of areas available for correct disposal, as well as diseases caused by contact with the waste. In this regard, the reuse (and the recycling) of solid waste is an alternative to provide environmental and economic benefits, such as preservation of natural resources, energy conservation, reduction of areas that are set aside for sanitary landfill, generating jobs and income. Therefore, the reuse of waste aims at sustainable development in the solid waste management, since it significantly reduces the use of virgin raw material in the production of steel, aluminum, paper/cardboard and plastic.
Due tothe effects of technological innovation, the generation of e-waste is growing fastas well; the consumption increases and the products’ life cycle are shortened. According to Baldé et al. (2015) the quantity of e-waste generation in 2014 was around 41.8 million tons (in the World). Around the world 57% of the total population is covered by national legislation on electronic waste, but this does not guarantee the correct treatment of e-waste. And, according to recent estimations, the generation of this waste typeby inhabitantsincreasesaround 3% every year.This percentage, combined with population growth, can increase the generation to 50 million tons in 2018. However, the aggravating factor of the situation is that only 6.5 million tons of 41.8 generated are collected by those responsible,which are 15.5% of the total generated. The question is: And the other 85%? Their uncorrected disposal could lead to serious public health and environmental problems as well as products that could be recycled and / or reused can be lost.
In order to investigate alternatives to increase the reuse rate of e-waste (in home appliances and information technology (IT) devices) in this article a system dynamics model is presented for analyzing the benefits generated (economic and environmental) by the reuse of the discarded components in the remanufacturing of a "new" product.Despite the different approach and objectives, the model presented by Jin et al. (2011) shows similarity with the model developed in this article. The model of Jin et al. (2011) seeks an optimal policy for the reassembly of the modular product within a remanufacturing environment. However, the model presented here, the final disposal after disassembly of discarded products (not used in remanufacturing) takes into accountthe recyclability of products. The general representation of the structure modeled in this article can be visualized in Figure 1. In the case developed for the article, the waste of printers (inkjet and laser), scanners and computersare evaluated;however, the model can be adapted and applied to analysis of any type of waste in the generation of any new product.For the model verification and validation experiments using two scenarios were developed: an optimistic scenario with a rate of 75% of the waste reuse and a pessimistic scenario with a rate of 25% of the e-waste reuse.
Figure 1. General representation of the structure modeled
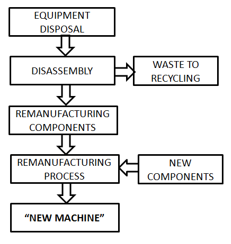
Source: Authors
Through the use of the results generated by the model, managers of the involved areas (Public, IT and Environmental) can improve the quality of their decisions in relation to the e-waste disposal. Thus, such materials are dealt with not simply as waste, but as raw materials for the design of "new products" or “new machines”,so they can be available on the market.
The article is organized as follows: in section 2 the research method used for the model development is presented. In section 3 the theoretical framework for the model development is described, where the concepts about the remanufacturing and the systems dynamics are presented. In section 4 the modeling problem, the component variables and the developed model are described. In section 5 the simulation scenarios, the validation and an experiment using the model are presented. Finally, concluding remarks are presented in section 6.
2 Research Method
The research method for the model development is based on the methodology for modeling and simulation presented by Law (2015), which consists of the following steps: (1) exploratory studies in technical articles, technical reports and observations of the environment where data were collected and through these data, the research problem is defined and structured; (2), solution development through the construction of formal models, capable of representing the problem (variables and their relationships); (3) implementation of the computational solution, using the simulator Vensim (Ventana Systems, 2016);(4) the verification and validation (V&V) of the solution through the lab testing and analysis of historical behaviour (with the data that were available), to check whether the results obtained represent part of the observed reality, because in a simulated environment there is no waste destination for remanufacturing,and the V&V of the model,which, as a whole, isone case using two scenarios (reuse between 25% and 75%= Uncertainty and; reuse from 25% to 75% = Growth), was simulated to make comparison.
The primary data on printer sales was obtained in Digital Convergence (Convergência Digital, 2016) and other data, such as discard and acquisition rates and, computer usage time, as the inputs of the model are collected from the Annual Survey of the use of Information Technology (Meirelles, 2015), and from a higher education institution. The model was experimented byanalyzing the Brazilian IT market.
3 Theoretical references
In times where the quest for sustainable development is a mandatory and legal requirement, both for industry and for the population in general, extending the life of a product and its components can be a practice not only environmentally correct and clean, but it can be socially useful as well. Remanufacturing, according to Hatcher et al. (2013), is the manufacturing process of a product from components that would have had their life cycle ended. The remanufacturing process has some advantages over the traditional manufacturing, as the organization spends less to manufacture it and the process consumes less virgin raw material and energy than the traditional production process. Due to this fact, the customer will pay less by the remanufactured product (SundinetDunbäck, 2013).
With the new process, part of the population that has no access to some tools due to the high price of new products, may have access to a product manufactured from components that would have been destined to waste, that is, a remanufactured product.Figure 2 illustrates the life cycle of the product in two different situations: the extended life cycle of a remanufactured product (1) and the traditional life cycle of a product, i.e. use and discard (2).
Figure 2 - Extended and traditional life cycle of the product
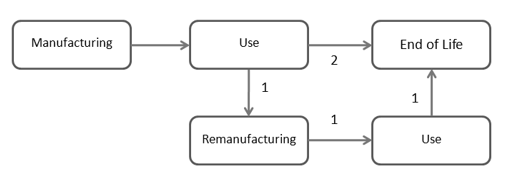
Source: Frota-NetoetBloemhof (2012)
The System Dynamics methodology, developed by Jay Forrester in the 1950´s, is a technique that combines flows and stocks for decision makers to assess the consequences of their decisions before taking them (DaelenbachetMcNickle, 2005). Ford (2009) defines the system dynamics as a method that combines flows and stocks in a computational structure to be simulated. Several authors use this methodology for the analysis of issues related to the Environment (Ford, 2009; GolroudbaryetZahraee, 2015; Kum et al., 2005). With respect to the use of Systems Dynamics for assessing remanufacturing, the model developed by Poles et Cheong (2009) evaluates which possible improvements are in the phases’ components of the remanufacturing process so as to reduce the total cost of production. Themodel of Vlachos et al. (2007) uses this methodology for the capacity planning of the supply chain to the remanufacturing, taking into account not only the economic aspects, but also the environmental aspects inherent to the process.
4 Development of simulation model
The increasing waste generation by electronic and mechanical devices has demanded public managers to invest resources in new techniques for their suitable treatment, since they are highly toxic and pollutant. Remanufacturing, as previously described, emerges as a viable alternative to prolong the life cycle of this equipment, thus avoiding a premature possible discard. In this paper, a simulation model is developed, verified and validated in order to evaluate the environmental and financial impacts that remanufacturing may have when compared to the final disposal for the e-waste collection.
The decisions from the results generated by the model, may involve the adoption of remanufacturing instead of final disposal, thus encouraging the reduction of the pollutants’ emission and obtaining a financial return, in view that, when the equipment is discarded as waste has, its residual value is null. Other decisions, such as acquisition cost reduction and reuse of remanufactured tools, can also be suggested. Other analyzes and observations, of the environmental and/or organizational managers’ interests, could be executed, since the model was conceived, seeking to simplify the user-model interaction, to which the what-if analyses are of simple execution.
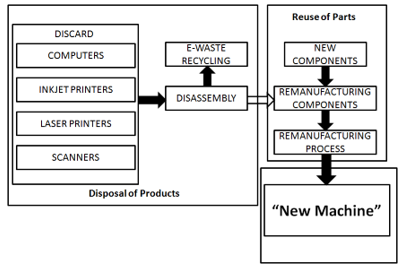
In Figure 3, the structure of the model and the components used, as well as their inter-relationships, are presented on the basis of previous research (Babikian et al., 2015; Frota-NetoetBloemhof, 2009; Frota-NetoetBloemhof,2012; GiutinietGaudette, 2003; Schneider et al., 2015). It is worth mentioning that the construction of the model was divided in three sub-models for modeling: Disposal of Products, Reuse of Parts and New Machine Benefits.
Figure 3. Structure of the developed model
Source: Authors
4.1 Disposal of ProductsSubmodel
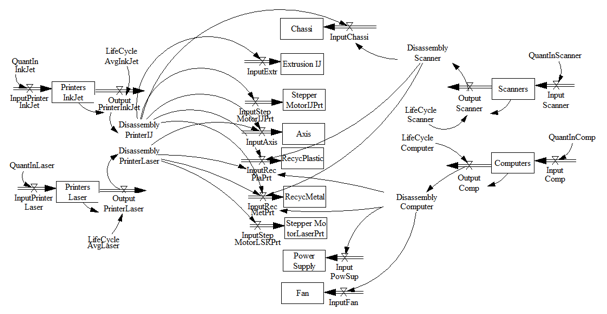
The Disposal of ProductsSubmodelaims to present the disposal and separation of the components to be reused.The stock variablesComputers, PrintersInkJet, PrintersLasereScannersrepresent the values for the annual inputs,considered in the simulation model, of computers, printers (inkjet and laser) and scanners. These variables are still responsible for helping to determine the values of DisassemblyComputer, DisassemblyPrinterIJ,DisassemblyPrinterLasere andDisassemblyScanner.The Disassembly variableshelp in determining the values ofvariables InputChassi (chassis of scanners or multifunction printers), InputExtr (inkjet printer extrusion system), InputStepMotorIJPrt(inkjet printer stepper motor), InputAxis (axes), InputRecPlaPrt (plastic to be recycled), InputRecMetPrt (metal to be recycled), InputStepMotorLSRPrt (laser printer stepper motor), InputPowSup (computer power supply), InputFan (fan), thus determining the total quantities of Chassis, Extrusion IJ, StepperMotorIJPrt, Axis, RecycPlastic, RecycMetal, StepperMotorLaserPrt, PowerSupply and Fan to be reused in the remanufacturing process of the 3D printer.
The RecycPlastic and RecycMetal variables represent, respectively, the quantity of plastic and metal that has been separated, but which will not be used in the production process of a new product, thus being separated for later recycling. The submodel is shown below in Figure 4 and its equations (equation 1 to equation 38) can be seen in Figure 7.
Figure 4. Disposal of Products Submodel
Source: Authors
4.2 Reuse of Parts Submodel
The Reuse of Parts submodel aims to determine the number of new machines to be produced,according to the total of components available to the reuse and also taking into account the reuse rate defined in the model(the user’s model determines the value according to the analyzes to be developed).
In this submodel we use the quantities of pieces to be reused, which were determined in the submodel Disposal of Products. For the determination, the variable values RemanufNewMachinewas used. This variable represents the number of new machines produced in a given period of time.In addition to the variables already presented for the composition of RemanufNewMachine, other functions are used for its composition, such as the reuse rate of the components (RateReuse) and the production time of each printer (user defined). Finally, to store the total number of new machines produced, the NewMachine stock variable was added to the model. The submodel representation can be visualized in Figure 5 and its equations (equation 39 to equation 41) can be visualized in Figure 7.
Figure 5. Reuse of Parts Submodel
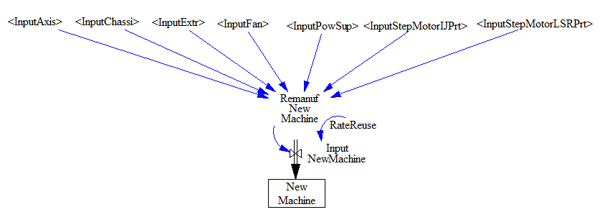
Source: Authors
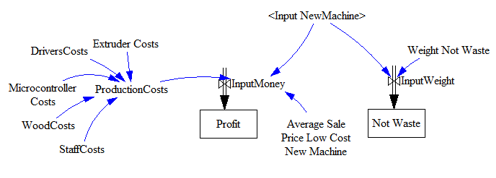
4.3 New Machine Benefits Submodel
The New Machine Benefits submodel aims to evaluate the benefits of reusing parts of devices that make up the new product.The interaction between the variables evaluates the financial impact that the application of this model can obtain, besides the lesser waste of components that will be obtained since much of the electronic components will be reused in new electronic devices.
The ProductionCosts variable is determined by the sum of the costs required to produce a New Machine, which are: costs for drivers (DriversCosts), cost of the microcontroller (MicrocontrollerCosts), cost of small wood boards (WoodCosts), cost of extruder (ExtruderCosts) and cost of labor for production (StaffCosts). In turn, the InputMoney variable uses the value of the sum of the variables mentioned above, but also uses the InputNewMachine and AverageSalePrice variables in its calculation.This variable (InputMoney) is used to determine the total profit obtained over the simulated time through the Profit stock variable.
The NotWaste variable stores the total weight of material that was used in the remanufacturing process and, therefore, does not end with e-waste.To determine the NotWaste variable, the InputWeight variable is used, as it is the product of the total number of 3D printers produced (Input3DPrinter) and the estimated material weight that was reused in the process for each printer (WeightNotWaste).Thegraphical representation of the submodel can be visualized in Figure 6 and its equations (equation 42 to equation 46) can be visualized in Figure 7.
Figure 6. New Machine Benefits Submodel
Source: Authors
Figure 7. Equations Model
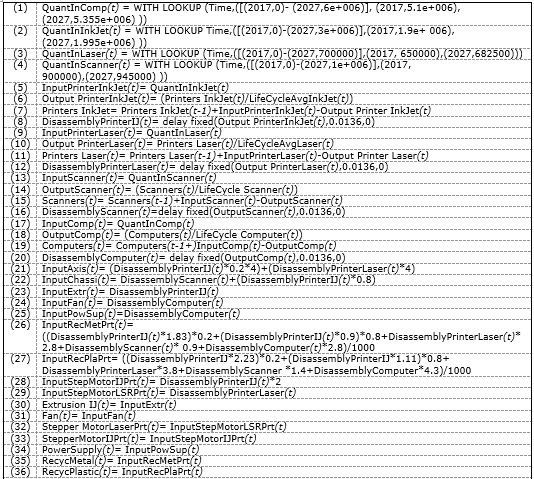
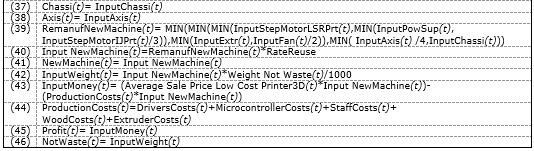
Source: Authors
5 Verification, validation and experiment of the model
In research papers involving the development of modeling for representation of real-world systems, one of the most important and critical parts is the verification and validation (V&V) of the model. A model is a representation of the real world or part of it. Therefore, all that the validation needs to do is to verify whether the behavior of the model and the real world occur under the same conditions. If so, the model is valid. If not, then the model is not valid. In turn, the verification shall ensure that all the requirements for the development of the model are adequately covered in it and, that it is free of errors in their conception (Sommerville, 2015).Thenew machine selected as a demonstrator will be a possible production of 3D printers.
In the model development in this paper the V&V were present at three phases of their conception. In the conceptual model (first phase) data from technical and scientific papers and statistical reports were used to define the variables of the modeling proposed. Borensteinet Becker (2000) divide the validation stage into two main categories: quantitative and qualitative validation. Qualitative techniques depend on subjective evaluation of the subject.Quantitative validation uses Statistics to verify system performance on tests. In this article we used the qualitative technique for its evaluationand, according to the classification presented by the authors, the nominal validation of the model was developed to verify whether the problem is well formulated and contains the key variables for its representation.To perform this step, two models that deal with the remanufacturing process were evaluated (Jin et al.,2011; WideraetSeliger, 2015) and compared with the model proposed in this article. Table 1 presents the results of the validation of the model.
Table 1. Results of the validation of the model
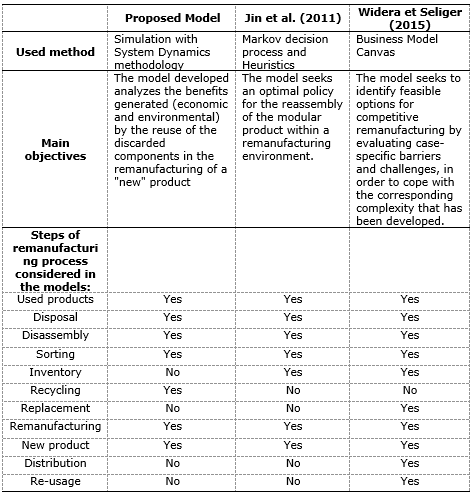
Table 1 shows that the presented model differs from the other two in both the methodology adopted for its development, as well as in the objectives of the model.With respect to the remanufacturing steps, the developed model differs from the model Jin et al. (2011) in the question of the final disposal after sorting, because in the proposed model it is considered the recycling of the materials not to be used in the remanufacturing process, while in the model of Jin et al. (2011) products are discarded. In relation to the model of Wideraet Seliger (2015), the proposed model differs in the post-remanufacturing, since the evaluated model considers the distribution and the use of the new remanufactured product.
In the implementation at the Vensim simulator (second phase), history data for the verification of the integration between the modules, model components were used, as well as the results generated, because the outputs produced by simulation model from the actual data provided were evaluated. In both cases the results were satisfactory and have met the expectations of designers.
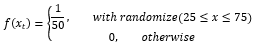
In the third phase of V&V data and rates from papers (All3DP, 2016; Babikian et al., 2015; Convergência Digital, 2016;Meirelles, 2015), reports of Higher Education Institution were used. The data for the calculation of the value of the 3D printer were obtained from All3DP (2016) (15% of average price of low-cost 3D printer), the values of the drivers, microcontrollers and extrusion system were obtained in the e-Bay. The costs of the wood and staff were estimated by the authors. For the implementation of this phase of validation of the model three scenarios that will be simulated were generated;they were denominated: (a) Uncertainty (between 25% and 75% of reuse); (b) Growth (from 25% to 75 of reuse) and; (c) Static (50% of reuse).
In order to define the reuse rate of the Uncertainty Scenario, the following stochastic function was defined:
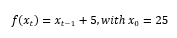
For Growth Scenario, the following linear function is used to represent the reuse rate:
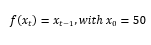
For the Static scenario, the linear function representing the reuse rate is defined by:
Thedetails of the scenarios are presented in Table 2.
Table 2. Detailing of the scenarios simulated
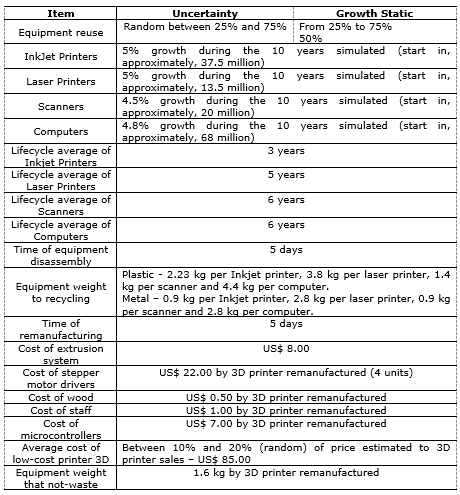
Source: Authors
5.1 Experiment and Results
After the three scenarios definition for the model experimentation, the simulations were performed in the Vensim simulator (Vensim, 2016). The simulated time in the experiment was 10 (ten) years (2017 to 2027), but this variable's configuration is the responsibility of the designer / user, since it depends on the analysis to be made.
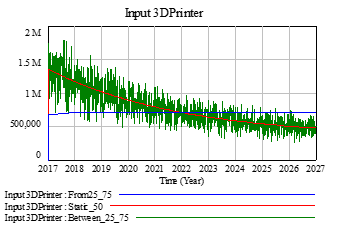
The first analysis concerns the total of printers produced over the simulated years.When analyzing the Uncertainty Scenario it is verified that, in the first simulated year, the average production was 1.23 million, while in the last year it was 456,000, thus, representing a decrease of 63.3% in this production scenario.In the Growth scenario, despite the 50% growth of the reuse rate over the simulated 10 years, it shows a certain stability in the 3D printers produced, since the average quantity is 713,953 units in the first simulated year, while the production estimate is 706,018 in the 10th simulated year, that is, it presents a negative variation of 1.1%.The Static scenario presents similar behavior in the total produced to the Uncertainty scenario.
Based on the results generated, it is verified that, despite the growth in sales (5% over 10 years), this percentage is small when compared to sales in previous years(Meirelles, 2015)and yet, the equipment lifecycle remains static.Thus, with the low sales growth, the quantity of equipment disposal decreases considerably. This finding is not valid for mobile devices such as smartphones and tablets, as they show a considerable evolution in sales(Convergência Digital, 2016; Meirelles, 2015).Figure 8 shows the possibility of the 3D printers making during each of the simulated years.
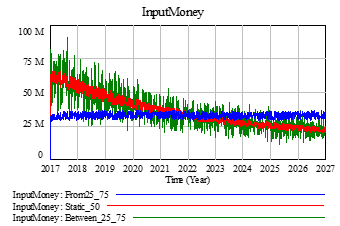
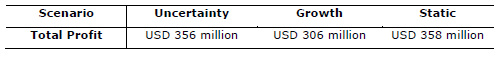
The second analysis carried out in this paper deals with the possibility of profit obtained through the sale of 3D printers produced with remanufacturing.In Figure 9 it can be seen that in the Uncertainty Scenario there is an average decrease of the profit in the order of 66.5% when comparing the first and the last simulated years. It can be verified that this value differs from the 63% variation of the total printers produced by the fact that the selling price, in both scenarios, is based on a random probabilistic function, thus generating results in the order of 3% difference. In the first scenario analyzed the average profit in the first simulated year is USD 61.2 million and in the last simulated year the profit estimated is USD 20.2 million. In the Growth Scenario, the average difference between the first and the last simulated year is very small (as shown in Figure 9), because in the first year the estimated profit is USD 32.4 million and in the 10th year it is USD 32.8 million. In Static Scenario, in turn, the behavior denoted over the simulated time is equivalent to that observed in the Uncertainty Scenario. Table 2 shows the total profit estimate over the simulated time, which is USD 358 million in the Static Scenario, USD 356 million in the Uncertainty Scenario and USD 306 million in the Growth Scenario.
Of the monetary total obtained from the sale of each printer, 54% is considered in profit, because the other 46% are required to produce it and, if possible, one can try to reduce the percentage spent on new raw material(not originated from reuse), thus,increasing the percentage of profit obtained from the printers’ sale.
Figure 8. Production of 3D Printer year to year
Source: Authors
Figure 9. Profit obtained year to year with sales of remanufactured 3D printers
Source: Authors
Table 3. Total profit obtained with sales of remanufactured 3D printers
Source: Authors
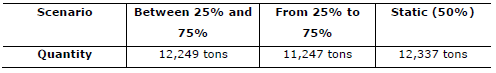
Another analysis developed refers to the environmental benefits originated by the discarded material reuse; in this case, the amount of material reused was evaluated from the total produced of 3D printers. In the Uncertainty Scenario it is estimated that 12,249 tons of discarded material is used; in the Static Scenario 12,337 tons and; in the Growth Scenario 11,247 tons, as can be seen in Table 3. Thus, it can be noted that, on average, the waste generation of up to 1,220 tons can be reduced annually in the Uncertainty Scenario with the remanufacturing of 3D printers,that is, the manufacturing organization consumes less raw material and energy than the traditional manufacturing process, thus characterizing a possible environmental benefit.
Table 4. Quantity of material not sent to the waste in 10 years simulated
Source: Authors
6 Concluding Remarks
The main objective of this study was the development, verification, validation and experiment of a remanufacturing strategy through system dynamics models and scenarios to prove that impacts (environmental and economic), caused by the e-waste reuse are possible through their remanufacturing.
The model, to be reconfigurable and open, can be enhanced with new devices to have their reuse in the process of remanufacturing evaluated, among which the home appliances reuse can be highlighted. In the case of this article the 3D printers remanufacturing was evaluated;however, the model can be adapted to evaluate the remanufacturing of any type of equipment.
The main result of the experiment performedmakes clear that, despite the high cost of acquiring new components for the 3D printer remanufacturing (drivers, microcontrollers, extrusion system and wood) in the simulated time, the possibility of revenues from equipment sales produces good results (with sale price between 10% and 20%lower than the 3D printeraverage price).
As future studies, it is aimed to expand the model to home appliance reuse in the production of the other equipment.The main limitation of this research consists of the absence of market analysis for the low-cost machines, because this was not the objective of this study.
References
All3DP (2016), “20 Best Cheap 3D Printers Under $500 / $1000”, available from: https://all3dp.com/best-cheap-budget-3d-printer-affordable-under-1000-budget/ (Access: Aug 2016).
Babikian, W. S. et al. (2015), “MAKER: 3D Printer from Scratch Made with e-Waste”, paper presented at 2015 ASEE Annual Conference and Exposition, Seattle, Washington, 2015. Doi: 10.18260/p.24443
Baldé, C. et al. (2015), The global e-waste monitor–2014, United Nations University, IAS–SCYCLE, Bonn, Germany.
Borenstein, D.; Becker, J.L. (2000), Validating Decision Support Systems, Encyclopedia of Microcomputers, Marcel Dekker, New York.
Convergência Digital (2016), “Venda de impressoras no Brasil despenca 22,8% em 2015”, available from: http://convergenciadigital.uol.com.br/cgi/ cgilua.exe/sys/start.htm?UserActiveTemplate=site&infoid=41993&post%2525255. (Access: 02 Feb 2018).
Daellenbach, H et al. (2012). Management science: decision-making through systems thinking. Palgrave Macmillan.
Ford, A. (2009). Modeling the Environment. Island Press.
Frota-Neto, J.Q., Bloemhof, J.M. (2009). Is Remanufacturing Effective and Eco-Effcient? An Analysis of the Eco-Effciency of Personal Computers and Mobile Phones , Social Science Research Network, Available at SSRN: http://ssrn.com/abstract =1367023. (Access: 02 Feb 2018).
Frota-Neto, J.Q.; Bloemhof, J.M. (2012), “An analysisofthe eco-efficiency of remanufactured personal computersand mobile phones”, Production and Operations Management, Vol. 21, No. 1, pp. 101–14.
Giutini, R., Gaudette, K. (2003). “Remanufacturing: the next great opportunity for boosting US productivity”. Business Horizon, 46(6),41-48.
Golroudbary, S.R.; Zahraee, S.M. (2015), “System dynamics model for optimizing the recycling and collection of waste material in a closed-loop supply chain”, Simulation Modelling Practice and Theory, Vol. 53, No. 1, pp. 88–102.
Hatcher, G.H. et al. (2013), “Design for remanufacturing in China: a case study of electrical and electronic equipment”, Journal of Remanufacturing, Vol. 3, No. 3, pp. 1-11.
Jin, X. et al.(2011), “Optimal control of reassembly with variable quality returns in a productremanufacturing system”, CIRP Annals - Manufacturing Technology, Vol. 60, pp.25–8.
Kum, V. et al. (2005), “A System Dynamics study of solid waste recovery policies in Phnom Penh City”, 23rd International Conference of the System Dynamics Society, Systems Dynamics Society, Boston, 2005.
Law, A.M. (2015), Simulation modeling and analysis, 5th ed., McGraw-Hill, New York.
Meirelles, F. (2015), 26ª Pesquisa anual de Tecnologia da Informação. Fundação Getúlio Vargas (FGV), São Paulo.
Poles, R.; Cheong, F. (2009), “A System Dynamics model for reducing uncertainty in remanufacturing systems”, PACIS 2009 Proceedings, available from: http://aisel.aisnet.org/pacis2009/24 (Access: 02 Feb 2018).
Schneider, J. R. et al. (2015), Simulação baseada em systems dynamics para avaliação de cenários sobre geração e disposição de resíduos eletrônicos numa instituição de ensino superior. In: SEMINÁRIOS EM ADMINISTRAÇÃO – SEMEAD, 18., 2015, São Paulo. Anais... São Paulo: Universidade de São Paulo.
Sommerville, I. (2015), Software Engineering,Pearson, London.
Sundin, E.; Dunbäck, O. (2013), “Reverse logistics challenges in remanufacturing of automotive mechatronic devices “, Journal of Remanufacturing, Vol. 3, No. 2, pp. 1-8.
Vensim - Ventana Systems (2016), “Vensim Simulation Software”, available from: http://www.vensim.com (access: 02 Feb 2018).
Vlachos, D. et al. (2007), “A system dynamics model for dynamic capacity planning of remanufacturing in closed-loop supply chains”, Computers & Operations Research, Vol. 34, No. 2, 364-97.
Widera, H.; Seliger, G. (2015), “Methodology for exploiting potentials of remanufacturing byreducing complexity for original equipment manufacturers”, CIRP Annals – ManufacturingTechnology, Vol. 64, No. 1, 463-7.
Received: Jan15, 2018
Approved: Jan 15, 2018
DOI: 10.14488/BJOPM.2018.v15.n1.a14
How to cite: Simonetto, E. O.; Putnik, G. D.; Butala, P. et al. (2018), “Waste remanufacturing modeling originated from household equipment”, Brazilian Journal of Operations & Production Management, Vol. 15, No. 1, pp. 151-161, available from: https://bjopm.emnuvens.com.br/bjopm/article/view/441 (access year month day).