Identification of the relationships between critical success factors, barriers and practices for lean implementation in a small company
Laís Pereira
laisghizoni@hotmail.com
Federal University of Santa Catarina, Florianópolis, Santa Catarina, Brazil.
Guilherme Tortorella
gtortorella@bol.com.br
Federal University of Santa Catarina, Florianópolis, Santa Catarina, Brazil.
ABSTRACT
This article aims to identify how the critical success factors (CSF), barriers and practices for lean manufacturing (LM) implementation in a small company are related. For this, the CSF, barriers and practices of LM related to small companies were initially consolidated from a literature review. Through semi-structured interviews and focus groups with the leaders of a small electronics manufacturing company in lean implementation, the relationships were evaluated and ranked through the incorporation of a multi-criteria analysis tool. The integration of a multi-criteria analysis tool into qualitative research methods (focused groups, semi-structured interviews and participatory observation) allowed quantifying these relationships in order to identify convergent efforts for a successful LM implementation. Existing frameworks for lean implementation are targeted at larger companies, disregarding the specific small company context. This study provides a guide to assist LM implementation in small manufacturing companies. Furthermore, the greater understanding of these relationships enables managers to anticipate potential problems, allowing a more successful implementation.
Keywords: Lean manufacturing, Small Company, Critical success factors, Barriers.
1. INTRODUCTION
In general, the search for reducing costs and delivery times, and increasing quality and productivity motivates the continuous improvement of processes and products of the manufacturing companies (Dora et al., 2013). In this sense, the adoption of the principles and practices derived from the Lean Manufacturing (LM) helps in the systematic elimination of waste, while the organizational culture to support these improvements is solid (Womack et al., 1992). The implementation process of LM may vary according to existent problems and the context which the company is inserted (Marodin et al., 2015). Among the contextual variables, company size, usually associated to the number of employees, is emphasized as one of the most relevant factors to be considered, since it influences several key aspects of lean implementation, such as availability of resources, structuring and process standardization, hierarchical levels, etc. (Shahand Ward, 2003; Achanga et al., 2006; Nordin et al., 2010).
Specifically in the small companies context, previous studies (Saurin et al., 2010; Abolhassani et al., 2016) point to difficulties in the LM implementation process that differ from larger companies. Thus, it is important to highlight certain critical success factors (CSF) and barriers to the LM implementation in small companies, such as the proximity between top management (usually represented by small companies owners) and the operation, which tends to favor greater support to improvement projects (Antony et al., 2005; Hallgren et Olhager, 2009; Anand et Kodali, 2010).
This is due to the fact that there are an increasing number of small companies, increasing their socioeconomic representativeness (Antony et al., 2005). In England, for example, small companies (employing up to 100 employees) generate, at least, 50% of jobs in the country (Achanga et al., 2006). This importance is also observed in Brazil, where smaller companies, which employ 50 to 100 employees, represent a quarter of GDP (SEBRAE, 2014). In addition, small companies also comprise 99% of formal establishments and employ 52% of the workforce in Brazil (Nogueira et Oliveira, 2013).
Thus, although there are studies investigating the effect of the company size on the level of LM adoption, they address this issue in a superficial or tangential way, without exploring the relations between CSF, barriers and practices in a more holistic way (Dombrowski et al., 2010; Pereira et Tortorella, 2016). In addition, existing frameworks for lean implementation are targeted at larger companies, disregarding the specific small company context (Anand et Kodali, 2010; Belhadi et Touriki, 2016). From the above, the following research question can be formulated: "What are the relationships between critical success factors, barriers and practices for implementing lean production in a small company?”.
Therefore, this article aims to identify how the critical success factors, barriers and practices for lean implementation in a small company are related. For this, the main CSF, barriers and practices of LM related to small companies were initially consolidated from a literature review. Through semi-structured interviews and focus groups with the leaders of a small electronics manufacturing company in lean implementation, the relationships between CSF, barriers and practices were evaluated and ranked through the incorporation of a multi-criteria analysis tool. In addition to the theoretical contribution already made, this study presents implications of a practical / managerial nature, since it provides a guide to assist LM implementation in small manufacturing companies. Further, the greater understanding of these relationships enables managers to anticipate potential problems, allowing a more successful implementation.
In addition to this introductory section, this article presents in section 2 a literature review about CSF, barriers and LM implementation practices in small companies. Section 3 describes the proposed method, the results of which are explained in section 4. Finally, section 5 closes the paper presenting the conclusions and opportunities for future work.
2. LITERATURE REVIEW
According to Womack et al. (1992) LM seeks the waste elimination, maximization of efficiency, productivity and flexibility. Although LM presents evidence of benefits in several segments, there are still challenges to be overcome in its implementation process. Such challenges can significantly impair the LM success, especially in the case of small companies (Achanga et al., 2006). Usually, these companies lack trained leaderships that disseminate the culture of continuous improvement. In this sense, it is important to understand the critical factors that corroborate the lean implementation in this context (Bakas et al., 2011; Godinho Filho et al., 2016).
The CSF concept identification for specific business problems is not a new issue (Caralli, 2004), since the first studies aimed at their identification date back to the end of the 1970s. If the objectives associated with a particular CSF organization are not achieved, the probability of failures in its management is increased (Rockart, 1979). Thus, specifically regarding the LM implementation, a little emphasis on the CSF associated with it can lead to discouraging results and setbacks in its implementation (Antony et al., 2005; Kumar et al., 2009).
The CSF can be attributed due to regional influences typical of the location in which the company is located (Netland, 2016), socio-economic factors (e.g.: emerging or developed countries) (Tortorella et al., 2015), and segment in which the company is inserted (Yew Wong, 2005). The articles focused on the small companies context show these CSF in several manufacturing segments, such as food (Dora et al., 2013, 2014), health services (Souza et Pidd, 2011; Burgess et Radnor, 2013) and electronic (Doolen et Hacker, 2005; Wong et Wong, 2009), ceramics (Cunha et Paiva, 2017), furniture (Vaz et al., 2011) and services (Yang et Yu, 2010; Bhamu et Sangwan, 2014).
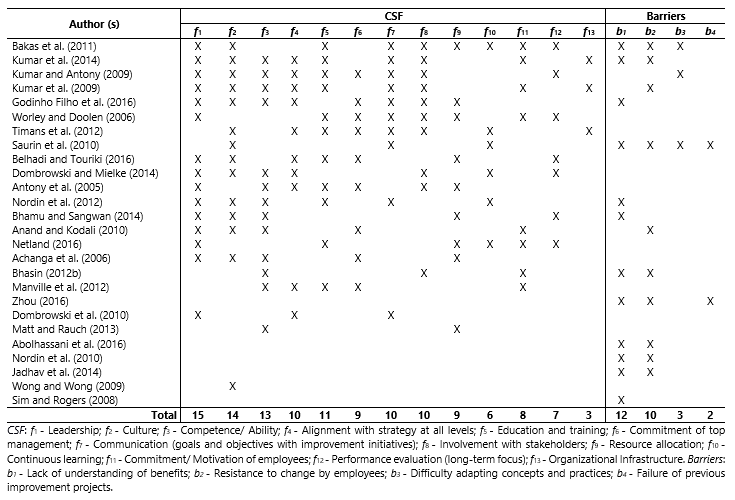
In addition to the CSF, it is also important to understand some of the obstacles that may impede LM implementation (Yang et Yuju, 2010; Zhou, 2016). The barriers concept in management has been presented for some decades, as evidenced by Chiavenato (1999). Particularly for the LM, Sim et Rogers (2008) list the main barriers to implementation for both large and small companies. In general, a barrier to LM implementation can be configured as little emphasis on a particular CSF (Anand et Kodali, 2010). Nordin et al. (2012) exemplify how lack of communication within business can undermine lean implementation. In addition, small companies managers tend to allocate a specific working group to direct LM implementation, developing low-cost, and high-impact business performance solutions (Dora et al. 2014; Zhou, 2016). In this sense, Table 1 consolidates the main CSF and barriers found in the literature focused on the LM implementation in small companies’ context.
Table 1. CSF and barriers for LM implementation identified in the literature
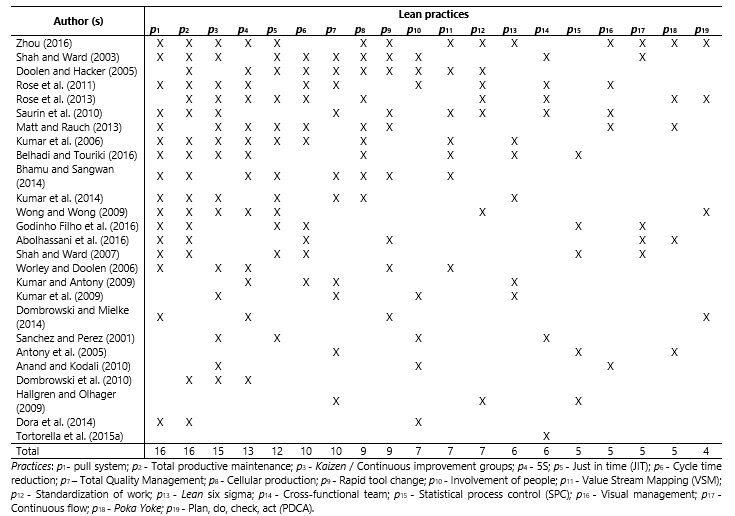
In addition, it is important to highlight some lean practices, so that these practices present application and different adoption intensities depending on the business context, the need for investment or existing problems (Matt, 2008; Kumar et al., 2014). Abolhassani et al. (2016) argue that larger companies tend to adopt lean practices more widely. Therefore, the identification of the practices most easily applicable to the context of the small companies, as well as their implementation method is an important point for the lean change (Shah et Ward, 2003). Therefore, the implementation of some lean practices may require greater resources investment than others, which eventually makes it difficult to apply to small companies, whose availability of resources is more restricted. Table 2 shows the main lean practices applicable to small companies identified from the researches evidenced in the literature. Despite the unequal frequency of citation, there are 19 fundamental practices for the lean implementation in small companies.
Table 2. Leading lean practices applied in small enterprises
In general, Tables 1 and 2 highlight the main variables to be considered by small companies that adopt the lean paradigm. However, it should be noted that few studies have effectively related the 3 variables (CSF, barriers and practices) concomitantly. Such a gap evidences the need for more holistic studies that allow the lean implementation systematic understanding.
3. PROPOSED METHOD
The proposed method for this work is comprised of six stages: (i) definition of the focus groups participants; (ii) structuring of hypotheses and discussion script; (iii) holding focused group meetings; (iv) conducting participatory observation in the company; (v) data collected analysis and treatment; (vi) multicriteria analysis between lean practices, barriers and CSF; and (vii) ranking of the CSF and barriers to lean implementation.
Step (i) deals with the definition of the participants to carry out the focused group method, which aims to capture different points of view in establishing a common sense about a given theme (Ribeiro et Newmann, 2012). The focus group technique has been used to collect data in an environment in which information is not well structured (Tortorella, 2008), so that the variables choice influencing the process can be determined by the individuals' perception. The participanting groups are chosen according to the research purpose; in this case, two groups are formed: (i) one with the company strategic members (area managers and coordinators) and (ii) another with operational leaders (production supervisors). In addition, it is desired that the participants of both groups have some complementary characteristics, such as: knowledge of the company operation and business environment, general sectors knowledge, ease of expression and clarity in the formulation of concepts.
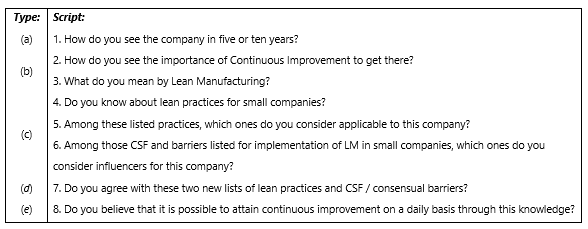
Based on the practices, Step (ii) consists of CSF and barriers identified in Tables 1 and 2, listing which are pertinent in the company under study, in such a way to establish later the relationship between them. For this, the hypotheses and route for discussions in the focused groups are structured in this stage. Ribeiro et Newmann (2012) suggest that the discussion script addresses five main types of questions: (a) the initial question, (b) the transition question, (c) the central issues, (d) a summary question, and (e) a final question. The initial question is intended to reassure and relax the environment, allowing the participants involved to feel at ease in the discussion. On the other hand, the question of transition leads the discussion to the problem focus, so that the central issues can definitely address the interest of research and capture the information sought. Subsequently, it is sought to synthesize what was debated, through the issue of summary, in order to consolidate the main points and direct it towards the conclusion of the discussion from the final question. Figure 1 presents the road map created to hold the meetings with the focus groups, and next to each question is presented the same type according to the suggestion of Ribeiro et Newmann (2012). Questions 5 and 6 in the script question the repeatability of the lists of practices and CSF / barriers identified in the literature for small companies. Therefore, at this point, the moderator presents Tables 1 and 2 for group discussion. It should be noted that the content of the questions in the script is not known to the participants before the meetings, which somehow contributes to the differences of perception between group members regarding relevant aspects of the research. In addition, this step addresses the planning of focus groups, including setting the meeting location, date and time.
Figure 1. Script for focus group meetings
Step (iii) effectively consists in focus groups meetings. It is important to emphasize that, before its beginning, the participants are questioned whether there is any obstacle to record the meeting; if so, the information is only recorded through annotations on the comments made. The moderator then explains the basic rules of the session, including session time, the confidentiality and anonymity of shared information, and how participants respond to the questions. For example, the moderator can establish that each member, around the table, responds to each question, in orderly and in their turn (Ribeiro, 2000).
In step (iv), a participatory observation is carried out in the company, which consists in the collection of complementary information from the researcher's personal perspective in the study environment (Ribeiro, 2003). This observation allows the data collection of the researcher’s interest, providing him with support for a better information understanding obtained from stage (iii), or even to establish reference points that allow advancing in the research. Similar to (iii), this step should follow a structured systematics to ensure that the information obtained is reliable and valid (Beyea et Nicoll, 2000). In this sense, in order to complement which practices, CSF and barriers are pertinent to the small companies under study, some criteria were established for participatory observation, such as: (a) to follow the process productive steps for a greater familiarity with the company routine; (b) verification of process/operation limitations in the productive area; (c) daily production meetings follow-up to observe the leadership and leaders behavior; and (d) carry out visits to the support areas, such as administrative (purchasing and commercial) and P&D (planning and development) for a better understanding of the flow of activities and information that influence the process.
Step (v) treats the collected data, consolidating ideas and taking into account the context in which they were placed, as well as analyzing the comments length and the responses specificity (Tortorella et al., 2008). Thus, the practices, barriers and CSF relevant to small companies under study are defined. In addition, this step allows grouping information that is used to explain or justify the relationship intensities between these elements, confronting the reality found.
Step (vi) aims to analyze the relationships between the lean practices implementation and the barriers and CSF, listed in (v). For this purpose, a multi-criteria decision support tool called AHP (Analytic Hierarchy Process) is used (Saaty, 1980). The AHP allows the identification of the best alternative in a variables group in view of pre-defined decision criteria (Tortorella et Fogliatto, 2008). The AHP adoption was chosen because it is a structured and documented decision process, presenting the repetition possibility and application to situations involving subjective judgments. Thus, it uses both quantitative and qualitative data to define preference values (Steiger et al., 2003). This technique is composed of the phases: (a) problem organization at a hierarchical level that reflects the relationships between decision criteria and variables; (b) pairwise comparison between elements positioned at a hierarchical level with respect to elements at the adjacent upper level; and (c) pairwise matrices analysis comparisons generated by the eigenvectors and eigenvalues calculation (Vargas, 2010).
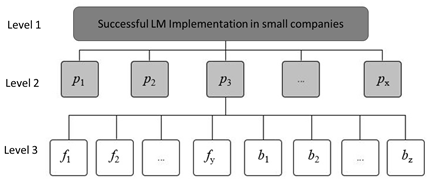
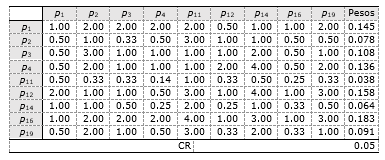
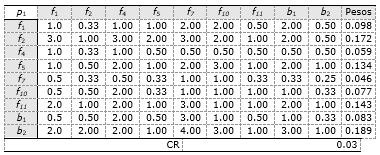
Thus, Figure 2 presents a hierarchy containing three levels. At the highest level, the multi-criteria analysis main objective is identified, which is to determine the most relevant CSF and barriers to enable successful LM implementation in small companies. At the second level, we present the practices px (x=1,...,19) and at the third level the critical success factors fy (y=1,..., 13) and the barriers bz (z=1,...,4), both previously listed in step (v). For this hierarchy analysis we need (x + 1) paired comparison matrices. The first matrix, lists levels 1 and 2 of the hierarchy. It is a matrix where paired comparisons are evaluated using expert opinion. Specialists should be chosen according to their experience both academic and practical in relation to LM implementation. For this purpose, we conduct semi-structured interviews with a planned duration of 1 hour in order to evaluate the relationships between levels. Then each pair of items (i, j) is evaluated in importance using a discrete scale from 1 to 9, where 1 denotes a scenario where items i and j are equally important, and 9 denotes a scenario where item i is extremely more important than item j. Intermediate values denote compromise situations and reciprocal values, such as (1/9), denote situations in which item i is less important than item j.
Figure 2. Hierarchy levels of multi-criteria analysis
In the first pairwise comparison matrix of levels 1 and 2 of the hierarchy, we also have the importance weight vector obtained for the elements listed in the matrix lines, thus defining the importance ranking between the CSF and barriers to LM implementation. The importance weight vector corresponds to the principal eigenvector, with normalized values such that the weights sum is equal to 1.0. The remaining x matrices of comparison relate the levels 2 and 3 of the hierarchy also defined through the specialists’ opinion. Each of these matrices brings the paired comparisons of the nine CSF options and barriers to the LM implementation process with respect to each practice of level 2. In all pairwise comparison matrices the values for the relationships ij were obtained from the medians of the specialists’ answers, in order to avoid the spurious values consideration, as recommended by Tortorella et Fogliatto (2014).
Similar to the procedure used to define the importance of the evaluation criteria, weights vectors are obtained for each criterion according to the CSF and barriers options. The CR (Consistency Ratio) values are generated based on the consistency of the qualitative assessments performed at levels 2 and 3 of the hierarchy. Saaty (1980) proposes a maximum value of 0.10 of CR for evaluations in a comparison matrix to be considered consistent.
For further details on scales, weight vector calculations and evaluations consistency determination, the work of Saaty et Vargas (1987) and Winston (1997) are recommended. According to the identified values, it is concluded that the evaluations made by the specialists are consistent and can be used in the rest of the method. In order to obtain the final weights vector, by configuring the final step of (vii) CSF and barriers ranking to favor lean implementation in small companies, the evaluations weighted average obtained for each LM implementation alternative was calculated. The weighting elements are the importance weights assigned to each criterion, so that the highest overall score sets the characteristics necessary to favor the LM implementation in small companies. Therefore, based on the proposed method, the results obtained after performing the seven steps described in this section were presented.
4. RESULTS
The company under study is characterized by a private limited company and is located in the capital of Santa Catarina. It is the branch of activity of the electronic sector. Founded in 1990 by 3 partners, electrical engineers and masters in power electronics, the company has expertise in designing, developing and manufacturing switching power supplies (DC/AC power converters, DC/DC converters, DC/AC inverters, battery chargers, USB source, among others). Its clients are from diverse segments such as banking, automotive, telecommunication, agricultural, etc. The company has a strategic team made up of managers from the Production, P&D, Administrative-Financial, Supplies, Commercial and HR (human resources) areas, as well as the three managing partners. All areas seek to communicate and interact for problem solving, but communication between production, supply and project (P & D) areas must flow in a way that does not lead to major flaws in the process. The production process of this company has a team of 34 employees and 4 industry leaders that encompass the entire assembly process of the converters (SMD mount, Magnetic Assembly, PTH Assembly, Testing and Mechanical Assembly/Packaging), with an average demand of 6 thousand fonts per month distributed in 20 product models, being therefore classified as a small company by both annual revenue and by the number of employees.
The entire production control process is done through daily time inputs, so that the operators are linked to the manufacturing orders (MOs) in real time. This can be verified by the integrated system, in which the manufacture average times and realization allow the traceability of the entire production process. The company presents specific initiatives in the LM area with the consultants’ external assistance, for more than 10 years, focusing on the factory floor. Currently this implementation has been guided in isolation without integration of all the areas involved in the process, such as Production Planning and Control (PPC), Purchasing, P&D, etc.
Regarding the focus groups performance, two different groups were formed. For the group 1 composition it was decided to invite strategic team members of the company composed by: a director, the production manager, the supply manager and the P&D manager. All members of this group have, at least, 2 years of experience in the company and a college education. Group 2 is composed of four leaders from the productive sectors, all of whom have completed high school and have a minimum of two years of leadership experience.
Meetings with focus groups were held at the company's headquarters, with a schedule and previously adjusted agenda. The duration of 60 minutes was scheduled for each meeting. The meeting with group 1 reached the planned time of one hour and the meeting with group 2 lasted around 70 minutes. Measures were taken to avoid disruption and disregard of participants. Although one of the meetings had been extended a little more than expected, there was no evidence of tiredness or impatience on the group members, indicating a good use of the time to collect information. In addition, there were no problems of punctuality to start both meetings and all participants accepted that the meetings were recorded for data collection. The members of both meetings were cooperative and participatory, questioning when there was no understanding of a certain lean practice, generating a positive expectation, interest and a friendly atmosphere during the work. There were dissenting opinions throughout the work, which were adequately explored by the moderator, without any changes in the work climate. These divergences reinforce the hypothesis of diversity observed in the sectors or areas of the company. Thus, participants are judged to have understood the issues and their objectives, having delivered transparent, honest and sincere responses and opinions.
For the participatory observation phase, the researcher had the opportunity to experience the company’s routine in a period of fifteen days, presenting a constant routine of daily observations for a better understanding of the process productive stages. During this period, the researcher observed the production manager in the MOs generation and monitored them on the factory floor, being able to better understand the process/operation limitations of the small company. There was also the daily meetings follow-up of production, in which one can identify the various types of leadership and the way in which they communicate. From these meetings, it was observed that, as it is a small company, the facility to validate the system information directly on the factory floor is already part of the daily routine of its leaderships. As a matter of physical space, there was a certain distance between the productive areas and the support areas; however, the support areas interact in a fast way because they are in the same space, favoring the verbal communication between these and via internal system or telephone between the production and the other areas.
After analyzing the audios of the two meetings with focus groups and notes made through participatory observation, it was identified that both groups believe that the company in the long term should grow using more advanced technologies and with a greater physical and organizational structure. The importance of continuous improvement is evident and indispensable if this desired growth is to be achieved. Thus, for the selection of potentially applicable practices there was a consensus on the elimination of some items from the original list, either for reasons of difficult applicability or for the lack of maturity of the current process in relation to the lean principles. Thus, of the 19 lean practices submitted, only 9 were defined as applicable in the small firm under study. In relation to the CSF and barriers, the same process occurred in a consensual way, analyzing the characteristics of the company, and 7 CSFs and 2 barriers were identified as relevant from an original list of 17 items. Table 3 consolidates the lean practices, barriers and CSFs selected from the focus groups.
Table 3. Practices, CSFs and barriers listed for the small company
Based on the two lists presented in Table 3, the multi-criterial analysis, whose hierarchy is presented in Figure 2, was performed. In this sense, 10 paired comparison matrices were analyzed by the specialists, whose median values were inserted. All the specialists involved have a PhD in lean production systems, with at least 5 years of practical and academic experience. Table 4 presents in the first line the weights of the related practices for the comparison matrix of levels 1 and 2; the other columns reveal the comparison weights of levels 2 and 3; and the column on the right reveals the final ranking for analysis. The 10 pairwise comparison matrices that gave rise to the weights in Table 4 are shown in Appendix 1, whose CR values are presented in order to confirm the consistency of the evaluations.
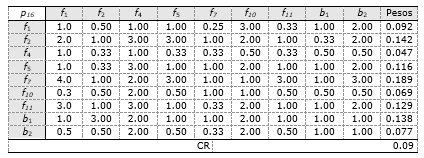
Based on the weights of practices, it was identified that practice p16 (Visual Management) presents greater importance for the LM implementation in small companies. Interestingly, this result differs from previous studies, since the frequency of citation of this practice is relatively smaller than the others in the literature (see Table 2). During the interviews with the experts, some comments emerged as a way of justifying such an assessment. Among these, it should be noted that this practice is intrinsically associated with the implementation of several others, such as pull system, 5S and standardization of work. Thus, it is understood that this practice not only presents specific benefits of its implementation, but also provides support for the implementation of the others, functioning as an elementary step (prerequisite) of these others. Regarding the scenario of the company under study, based on the observations made, it is perceived that this practice was implemented in a superficial way, being evidenced only through the identification of the products throughout the process. Thus, visual management presents great potential for adoption in the company, integrating the productive cells in order to visually order the priorities within the process and allow the occurrence of anomalies to become easily identifiable and, consequently, quick to deal with. In general, small firms tend to seek lean practices with low implementation costs and rapid results (Dora et al., 2014; Zhou, 2016). Therefore, this result corroborates with this need, since visual management is a simple and low-capital practice.
Table 4. Matrix with the vectors weights for practices and CSF/barriers
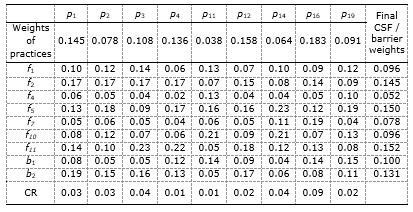
On the other hand, practice p11 (VSM) has less weight for successful lean implementation in small companies. In theoretical terms, this practice has a slightly higher incidence (7 out of 26 references) than p16. Moreover, the justifications pointed out by the experts interviewed for this evaluation contemplate the fact that small companies, in general, present less complex value flows in which the identification of waste occurs in an easier and more noticeable way. Thus, the use of practices favoring a systemic understanding and identification of wider process losses, such as the VSM, have their potential for reduced contribution, given the simplicity of the value flows in question. In the case of the company under study, it is observed that both the management and the operation present little familiarity with this practice, thus directing improvement initiatives based on short-term latent needs. This is also justified by the multi-functionality intrinsic to the context of small companies. Due to the low availability of human resources, their leaders play a variety of roles integrating functions that, in a large enterprise setting, would comprise more than one department. Thus, small companies’ leaders are encouraged to take a much more horizontal view of the processes they manage (less departmentalized view), enabling greater understanding of the value stream as a whole, and reducing the need for practices that support such a vision, such as VSM.
As for the CSF/barriers evaluated, the factors f11 (Commitment / Motivation of employees) and f5 (Education and training) were the ones that presented the greatest weight for the lean implementation, with values of 0.152 and 0.150, respectively. In the literature investigated (see Table 1), both factors present intermediate values of citation frequency (11 and 8 citations among 26 references, respectively), with no particular emphasis. However, according to the experts' understanding, f11 is the most relevant factor for the implementation of 3 (p3, p4 and p12) of the 9 lean practices reported by small companies’ leaders. In addition, since p12 (standardization of work) has a high weight (0.158) among lean practices, the relevance of f11 increases even more. The lean implementation, according to Tortorella et al. (2015), is composed of both technical and sociocultural aspects. Thus, in addition to tangible knowledge, such implementation requires behavioral changes in order to sustain the technical aspects in the long run. Thus, the high importance of workers' commitment and motivation is consistent with the Bhasin (2012b) and Manville et al. (2012). In addition, in practical terms, small companies tend to present few hierarchical levels, leading to a greater degree of autonomy of their employees. This emphasizes the importance of high levels of commitment of workers, especially the lean implementation process. The justification for the high importance value of f5 can be found in the studies carried out by Achanga et al. (2006) and Antony et al. (2005) which state that employee empowerment initiatives on LM practices and principles are essentially scarcer in small firms than in larger firms. Thus, the intensification of education and training activities in favor of lean implementation in small companies is in line with the understanding of the experts interviewed, especially for practices p2, p14 and p19.
On the other hand, f4 (Alignment with strategy at all levels) presented a lower importance value (0.052), being the least important factor in 6 (p2, p3, p4, p12, p14 and p16) of the 9 practices analyzed. Although f4 is cited in 10 of the 26 references cited in Table 1, experts indicate that, at a few hierarchical levels within small companies, communication and alignment of strategic objectives tend to be carried out in a more direct and fluid way. Thus, factors that support the development of these activities have little potential to contribute, given the small companies’ context. This can be evidenced from the visits to the company under study, whose strategic leadership (management and board) and tactical/operational (production leaders) total a team of 9 people who are in the same working environment with frequent meetings (once a day) and informal contact facilitated. Therefore, the result found for this factor corroborates with the reality observed in the company under study.
5. CONCLUSIONS
The present work presented a method to identify the relationship between critical success factors, barriers and practices for lean implementation in a small company. Two major contributions can be highlighted in this study. Firstly, in theoretical terms, the proposal of a method that evaluates CSF, barriers and practices in an integrated way for the LM implementation in small companies contributes to the body of knowledge in the area. Previous studies approach these aspects in isolation, without correlating them to the context of small enterprises. Thus, the integration of a multi-criteria analysis tool into qualitative research methods (focused groups, semi-structured interviews and participatory observation) allowed quantifying these relationships in order to identify efforts for lean implementation.
Second, in practical terms, achieving a ranking of the CSFs and barriers to lean implementation in a small company enables managers to make decisions that anticipate future difficulties. According to Marodin et Saurin (2015), the CSF and barriers to lean implementation are not easy to manage and require time for their redirection by management. Thus, the prior identification of the CSFs and barriers that most affect the lean implementation process accelerates the technical and socio-cultural changes inherent in LM. In addition, these guidelines enable the prioritization of managerial efforts that bring greater benefits to lean implementation in the context of the company in question.
As for the limitations of this study, it should be noted that the results obtained here cannot be fully generalized to small companies that aim to implement the LM. As practices, barriers and CSFs have undergone an initial critique, according to the current reality of the company under study, the selection of these can be altered if other companies present different contexts. Moreover, the relationships between the aforementioned aspects were analyzed from a linear perspective, disregarding the systemic character of lean implementation. In other words, future studies that address these relationships from the perspective of complex systems can identify complementary or even divergent effects of those reported here. For this, it is suggested the incorporation of dynamic system techniques for the continuity of these studies.
REFERENCES
Abolhassani, A., Layfield, K., Gopalakrishnan, B. (2016). “Lean and US manufacturing industry: popularity of practices and implementation barriers.” International Journal of Productivity and Performance Management, Vol. 65, No. 7, pp. 875-897.
Achanga, P., Shehab, E., Roy, R., Nelder, G. (2006). “Critical success factors for lean implementation within SMEs.” Journal of Manufacturing Technology Management, Vol. 17, No. 4, pp. 460-471.
Anand, G., Kodali, R. (2010). “Analysis of lean manufacturing frameworks.” Journal of Advanced Manufacturing Systems, Vol. 9, No. 1, pp. 1-30.
Antony, J., Kumar, M., Madu, C.N. (2005). “Six sigma in small- and medium-sized UK manufacturing enterprises: Some empirical observations.” The International Journal of Quality & Reliability Management, Vol. 22, No. 8/9, pp. 860-874.
Antony, J., Kumar, M., Madu, C. (2005). “Six sigma in small-and medium-sized UK manufacturing enterprises: Some empirical observations.” International Journal of Quality & Reliability Management, Vol. 22, No. 8, pp. 860-874.
Bakas, O., Govaert, T., Van Landeghem, H. (2011). “Challenges and success factors for implementation of lean manufacturing in European SMES.” Proceedings of the 13th International conference on the Modern Information Technology in the Innovation Processes of the Industrial Enterprise (MITIP 2011). Tapir Academic Press, 2011.
Belhadi, A., Touriki, F. (2016). “A framework for effective implementation of lean production in Small and Medium-sized Enterprises.” Journal of Industrial Engineering and Management, Vol. 9, No. 3, pp. 786-810.
Beyea, S., Nicoll, L. (2000). “Methods to conduct focus group and the moderator's rule.” Association of Operating Room Nurses Journal, Vol. 71, No. 5, pp. 1067-1068.
Bhamu, J., Sangwan, K. (2011). “Lean manufacturing: literature review and research issues.” International Journal of Operations & Production Management, Vol. 34, No. 7, pp. 876-940.
Bhasin, S. (2012). “Prominent obstacles to lean.” International Journal of Productivity and Performance Management, Vol. 61, No. 4, pp. 403-425.
Burgess, N., Radnor, Z. (2013). “Evaluating Lean in healthcare.” International Journal of Health Care Quality Assurance, Vol. 26, No. 3, pp. 220 – 235.
Caralli, R. (2004). The critical success factor method: establishing a foundation for enterprise security management. Technical Report, CMU/SEI-2004-TR-010, Carnegie Mellon Software Engineering Institute, Pittsburgh, PA, 2004.
Chiavenato, I. (1999). Gestão de pessoas: O novo papel dos recursos humanos nas organizações. Rio de Janeiro: Campus.
Cunha, A. (2017). “Implementação da metodologia Lean numa empresa do setor cerâmico.” Tese de Doutorado. Instituto politécnico de Viseu.
Dombrowski, U., Crespo, I., Zahn, T. (2013). “Adaptive configuration of a lean production system in small and medium-sized enterprises.” Production Engineering, Vol. 4, No. 4, pp. 341-348.
Dombrowski, U., Mielke, T. (2014). “Lean leadership–15 rules for a sustainable lean implementation.” Procedia CIRP, Vol. 17, pp. 565-570.
Doolen, T., Hacker, M. (2005). “A review of lean assessment in organizations: an exploratory study of lean practices by electronics manufacturers.” Journal of Manufacturing Systems, Vol. 24, No. 1, pp. 55-67.
Dora, M., Van Goubergen, D., Kumar, M., Molnar, A., Gellynck, X. (2014). “Application of lean practices in small and medium-sized food enterprises.” British Food Journal, Vol. 116, No. 1, pp. 125-141.
Dora, M., Kumar, M., Van Goubergen, D., Molnar, A., Gellynck, X. (2013). “Operational performance and critical success factors of lean manufacturing in European food processing SMEs.” Trends in Food Science & Technology, Vol. 31, No. 2, pp. 156-164.
Godinho Filho, M., Ganga, G., Gunasekaran, A. (2016). “Lean manufacturing in Brazilian small and medium enterprises: implementation and effect on performance.” International Journal of Production Research, Vol. 54, No. 24, pp. 7523-7545.
Hallgren, M., Olhager, J. (2009). “Lean and agile manufacturing: external and internal drivers and performance outcomes.” International Journal of Operations & Production Management, Vol. 29, No. 10, pp. 976-999.
Jadhav, J., Mantha, S., Rane, S. (2014). “Exploring barriers in lean implementation.” International Journal of Lean Six Sigma, Vol. 5, No. 2, pp. 122-148.
Kumar, M., Antony, J. (2009). Multiple case-study analysis of quality management practices within UK Six Sigma and non-Six Sigma manufacturing small- and medium-sized enterprises. Proceedings of the Institution of Mechanical Engineers, Part B: Journal of Engineering Manufacture, 233, 925-934.
Kumar, M., Antony, J., Douglas, A. (2009). “Does size matter for Six Sigma implementation? Findings from the survey in UK SMEs.” The TQM Journal, Vol. 21, No. 6, pp. 623-635.
Kumar, M., Khurshid, K., Waddell, D. (2014). “Status of quality management practices in manufacturing SMEs: a comparative study between Australia and the UK.” International Journal of Production Research, Vol. 52, No. 21, pp. 6482-6495.
Kumar, M., Antony, J., Singh, R., Tiwari, M., Perry, D. (2006). “Implementing the Lean Sigma framework in an Indian SME: a case study.” Production Planning and Control, Vol. 17, No. 4, pp. 407-423.
Manville, G., Greatbanks, R., Krishnasamy, R., Parker, D. (2012). “Critical success factors for Lean Six Sigma programmes: a view from middle management.” International Journal of Quality & Reliability Management, Vol. 29, No. 1, pp. 7-20.
Marodin, G., Saurin, T. (2015). “Managing barriers to lean production implementation: context matters.” International Journal of Production Research, Vol. 53, No. 13, pp. 3947-3962.
Matt, D. (2008). “Template based production system design.” Journal of Manufacturing Technology Management, Vol. 19, No. 7, pp. 783-797.
Netland, T. (2016). “Critical success factors for implementing lean production: the effect of contingencies.” International Journal of Production Research, Vol. 54, No. 8, pp. 2433-2448.
Nogueira, M., Oliveira, J. (2013). Da baleia ao ornitorrinco: contribuições para a compreensão do universo das micro e pequenas empresas brasileiras. Instituto de Pesquisa Econômica Aplicada (Ipea). Matt, D., Rauch, E. (2013). “Implementation of lean production in small sized enterprises.” Procedia CIRP, Vol. 12, pp. 420-425.
Nordin, N., Deros, B., Wahab, D. (2010). “A survey on lean manufacturing implementation in Malaysian automotive industry.” International Journal of Innovation, Management and Technology, Vol. 1, No. 4, pp. 374.
Pereira, L., Tortorella, G. (2016). “Implementação de produção enxuta em pequenas empresas de manufatura: uma revisão bibliográfica.” Proceedings of the VI Congresso de Sistemas LEAN, pp. 375-390.
Ribeiro, J., Ruppenthal, C. (2000). Grupos focalizados: revisão e emprego na engenharia de produção. Caderno de Engenharia, PPGEP/UFRGS, Porto Alegre-RS.
Ribeiro, J. (2003). Grupos focados: teoria e aplicações. Porto Alegre: FEENG.
Ribeiro, J., Newmann, C. (2012). “Estudos qualitativos com o apoio de Grupos Focados.” Proceedings of the XIII Semana de Engenharia de Produção Sul-americana. Gramado, Brasil.
Rockart, J. (1979). “Chief executives define their own data needs.” Harvard Business Review, Vol. 57, No. 2, pp. 238-41.
Rose, A., Deros, B., Rahman, M., Nordin, N. (2011). “Lean manufacturing best practices in SMEs.” Proceedings of the 2011 International Conference on Industrial Engineering and Operations Management, pp. 872-877.
Rose, A., Deros, B., Ab Rahman, M. (2013). “A study on lean manufacturing implementation in Malaysian automotive component industry.” International Journal of Automotive and Mechanical Engineering, Vol. 8, pp. 1467.
Saaty, T. (1980). The Analytic Hierarchy Process. New York: McGraw-Hill.
Saaty, T., Vargas, L. (1987). “The Legitimacy of Rank Reversal.” Omega, Vol. 12.
Sanchez, A., Perez, M. (2001). “Lean indicators and manufacturing strategies.” International Journal of Operations & Production Management, Vol. 21, No. 11, pp. 1433-1452.
Saurin, T., Ribeiro, J., Marodin, G. (2010). “Identificação de oportunidades de pesquisa a partir de um levantamento da implantação da produção enxuta em empresas do Brasil e do exterior.” Gestão e produção, Vol. 17, No. 4, pp. 829-841.
Sebrae (2014). Participação das Micro e Pequenas Empresas na Economia Brasileira. Brasília.
Shah, R., Ward, P. (2007). “Defining and developing measures of lean production.” Journal of Operations Management, Vol. 25, No. 4, pp. 785-805.
Shah, R., Ward, P. (2003). “Lean manufacturing: context, practice bundles, and performance.” Journal of Operations Management, Vol. 21, No. 2, pp. 129-149.
Sim, K., Rogers, J. (2008). “Implementing lean production systems: barriers to change.” Management Research News, Vol. 32, No. 1, pp. 37-49.
Souza, L., Pidd, M. (2011). “Exploring the barriers to lean health care implementation.” Public Money & Management, Vol. 31, No. 1, pp. 59-66.
Steiguer, J., Duberstein, J., Lopes, V. (2003). “The analytic hierarchy process as a means for integrated watershed management.” Proceedings of the First interagency conference on research on the watersheds. Agricultural Research Service, US Department of Agriculture, Agricultural Research Service, Benson, Ariz. pp. 734-740.
Timans, W., Antony, J., Ahaus, K., Van Solingen, R. (2012). “Implementation of Lean Six Sigma in small-and medium-sized manufacturing enterprises in the Netherlands.” Journal of the Operational Research Society, Vol. 63, No. 3, pp. 339-353.
Tortorella, G., Marodin, G., Fogliatto, F., Miorando, R. (2015). “Learning organisation and human resources management practices: an exploratory research in medium-sized enterprises undergoing a lean implementation.” International Journal of Production Research, Vol. 53, No. 13, pp. 3989-4000.
Tortorella, G., Fogliatto, F., Ribeiro, J. (2008). “Identificação de fatores que afetam a sustentabilidade de melhorias em células de manufatura usando grupos focados.” Proceedings of the XXVIII Encontro Nacional de Engenharia de Produção.
Tortorella, G., Fogliatto, F. (2014). “Method for assessing human resources management practices and organisational learning factors in a company under lean manufacturing implementation.” International Journal of Production Research, Vol. 52, No. 15, pp. 4623–4645.
Tortorella, G., Fogliatto, F. (2008). “Planejamento sistemático de layout com apoio de análise de decisão multicritério.” Produção, Vol. 18, No. 3, pp. 609-624.
Vargas, R. (2012). “Utilizando a Programação Multicritério (AHP) para Selecionar e Priorizar Projetos na Gestão de Portfólio.” Proceedings of the PMI Global Congress.
Vaz, C., Petter, R., Selig, P., Forcellini, F. (2011). “Mapeamento do fluxo de valor na produção de portas laqueadas em uma microempresa do setor moveleiro.” Proceedings of the XVIII SIMPEP.
Winston, W. (1997). Operations Research: Applications and Algorithms. New York: Wadsworth.
Womack, J., Jones, D. (1992). A máquina que mudou o mundo. Rio de Janeiro: Campus.
Wong, Y., Wong, K., Ali, A. (2009). “A study on lean manufacturing implementation in the Malaysian electrical and electronics industry.” European Journal of Scientific Research, Vol. 38, No. 4, pp. 521-535.
Worley, J., Doolen, T. (2006). “The role of communication and management support in a lean manufacturing implementation.” Management Decision, Vol. 44, No. 2, pp. 228-245.
Yang, P., Yu, Y. (2010). “The Barriers to SMEs' Implementation of Lean Production and Counter measures - Based on SMS in Wenzhou.” International Journal of Innovation, Management and Technology, Vol. 1, No. 2, pp. 220.
Yew Wong, K. (2005). “Critical success factors for implementing knowledge management in small and medium enterprises.” Industrial Management & Data Systems, Vol. 105, No. 3, pp. 261-279.
Zhou, B. (2016). “Lean principles, practices, and impacts: a study on small and medium-sized enterprises (SMEs).” Annals of Operations Research, Vol. 241, No. 1/2, pp. 457-474.
Appendix
Pairwise comparisons between practices
Pairwise comparison of level 3 in relation to p1– Pull System
Pairwise comparison matrix of level 3 in relation to p2- Total Productive Maintenance
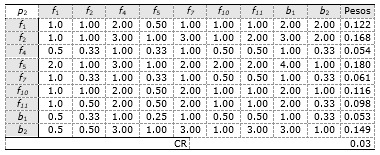
Pairwise comparison of level 3 in relation to p3- Kaizen / Groups of continuous improvement
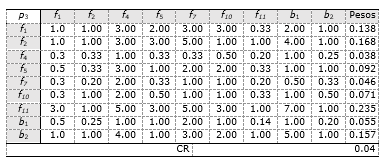
Pairwise comparison matrix of level 3 in relation to p4-5S
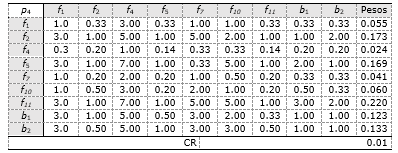
Pairwise comparison of level 3 in relation to p11 – Value Stream Mapping (VSM)
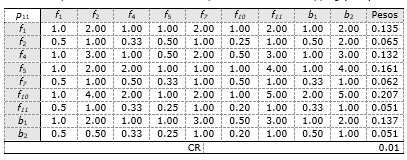
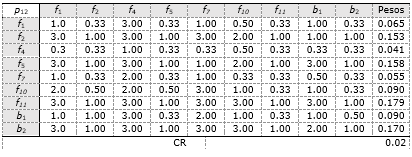
Pairwise comparison matrix of level 3 in relation to p12 - Work standardization
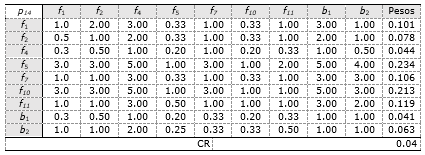
Pairwise comparison of level 3 in relation to p14 - Multifunctional team
Pairwise comparison of level 3 in relation to p16 - Visual management
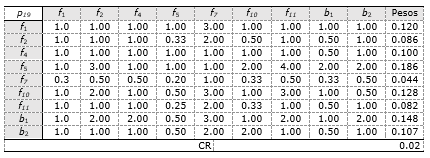
Pairwise comparison of level 3 in relation to p19 – PDCA
Received: 09 Sep 2017
Approved: 08 May 2018
DOI: 10.14488/BJOPM.2018.v15.n2.a6
How to cite: Pereira, L., Tortorella, G. (2018), “Identification of the relationships between critical success factors, barriers and practices for lean implementation in a small company”, Brazilian Journal of Operations & Production Management, Vol. 15, No. 2, pp. 232-246, available from: https://bjopm.emnuvens.com.br/bjopm/article/view/409 (access year month day).