Barriers and critical success factors applying cleaner production: a survey with Brazilian specialists
Leticia Canal Vieira1, Fernando Gonçalves Amaral1
1 Federal University of Rio Grande do Sul
Abstract
Cleaner Production is an initiative seeking for achieving sustainable development goals. Yet, it has not been satisfactorily disseminated in Brazilian industries. The purpose of this article was identifying the barriers and critical success factors, considering both the external and internal Brazilian environment. A survey was conducted among the professionals involved with the subject of Cleaner Production in Brazil, reaching 185 respondents. Data was analyzed using the Principal Component Analysis. The results indicated that the main success factors concern the organization characteristics, and are related to culture, strategic planning and resources for the implementation of Cleaner Production. In the case of barriers, it can be highlighted the inadequate vision and culture of organizations, followed by the lack of support from the external environment. Contrary to other studies, economic aspects did not seem to be crucial in the opinion of respondents. When measures that can be taken for a more effective dissemination of CP in Brazil are approached, it can be perceived that a repositioning of the external environment (government, other companies, academia, and consumers) is necessary, acting as a strong incentive and support for applying CP.
Keywords: Pollution prevention; Stakeholders; South America; Principal Components Analysis.
1. Introduction
Practices such as Cleaner Production (CP) emerged from the need to change current industrial routines to promote sustainable development. CP is a concept that has almost two decades; however, it still faces barriers and has not been largely implemented, especially in developing nations (Silva et al., 2013). Reasons for that might be the complexity that rises when environmental problems are approached, as well as the need for a paradigm shift that CP requires (Baas, 2008; Bonilla et al., 2010). More than a technological change, CP is an organizational change that involves culture and the everyday life of organizations and, as such, it faces resistance (Fresner, 1998).
Considering the Brazilian context, efforts have taken place to disseminate CP. The National Centre for Clean Technologies of UNIDO-UNEP in Brazil has worked since 1995 to get entrepreneurs, especially from industry, involved and committed with CP. It also contributes to the dissemination of information, implementation of CP programs, training professionals and working on environmental policies. The environmental regulation agency of the state of São Paulo (CETESB) is also an important peer, acting as a major player in disseminating and seeking to integrate CP in Brazilian industries. Though, considering the universe of the industries in the state of São Paulo (43% of national industry), CETESB acknowledges that the level of CP adoption is still considered low (Ribeiro et Pacheco, 2011).
The effects observed by the dissemination strategies are still marginal and have not generated significant changes in environmental licenses, which are the main instrument through which regulating agencies can prevent pollution in Brazil (Ribeiro et Pacheco, 2011). Hence, observing the reality of Brazilian industries, CP does not appear to be disseminated at the desired rate (Pereira et Sant’Anna, 2012). It is important that adequate environmental practices be adopted by countries that are in a process of development, not falling into the pitfall of remediation after degradation. In this way, fostering CP is a priority, and it is essential to identify the barriers that are preventing or creating obstacles for its adoption.
Knowing the barriers and CSF that are present in different contexts, the objective of this article is to investigate if the same aspects are encountered in the Brazilian context and therefore which directions should be taken to foster CP in Brazil. For achieving that, a survey was conducted with professionals that work with CP in Brazil. As such, in the following section the survey and data analysis method using Principal Component Analysis will be presented. After the results and discussions regarding what are the main drivers and barriers for CP in Brazil. Lastly, some final remarks pointing directions for fostering CP in Brazil.
2. Method
To identify the barriers and the critical success factors (CSF) involved in applying CP in Brazil, a cross-sectional study was performed through a survey with professionals that work with CP in Brazil (Babbie, 1999; Forza, 2002). As a starting point a systematic review of literature was performed to identify aspects related to CP dissemination (Vieira et Amaral, 2016) where it was observed in a worldwide context what are the barriers and the CSFs for CP application. CSFs were considered as the characteristics, conditions or variables that, when maintained or managed adequately, have a significant impact on a company’s success (Leidecker et Bruno, 1984). Barriers, on the other hand, are the obstacles or difficulties that can exist both in the internal and external environment of companies, making difficult or even preventing CP application. Based on the CSF and barriers found in the international literature, semi-structured interviews were performed with two specialists who apply CP in Brazilian industries, aiming to construct a research instrument adapted to the local reality.
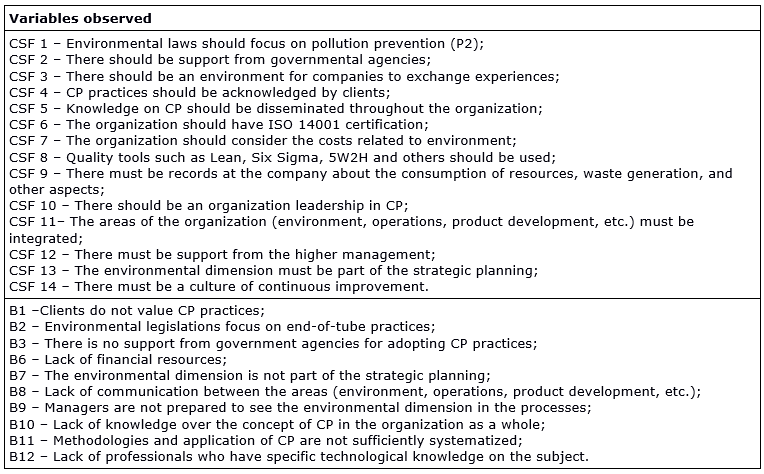
Table 1 shows the variables included in the research instrument for CSF and barriers, comprising both aspects from literature and those identified in the interviews. Each of the variables analyzed were classified by a five-point Likert scale ranging from ‘strongly disagree’ to ‘strongly agree’. The questionnaire also had demographic questions.
Table 1. Variables observed in the research instrument for CSF and barriers
Since there are no official records or consolidated associations for professionals that work with CP in the country, the sampling used was not probabilistic, considering an unknown population. The questionnaires were sent to professionals who work in the environmental department of companies, professionals who work in environmental activities, members of the Cleaner Production Network, connected to the Advances in Cleaner Production event, and authors who have published articles on this topic in the last 10 years. The respondents were also asked to indicate people who could answer the survey, creating a snowball effect. The questionnaire was sent to a group of 15 people for pre-testing. Then the questionnaires were sent by e-mail via the Survey Monkey platform to a total of 597 individuals and the survey was made available for a period of one month, with weekly reminders sent to the participants in the survey.
Descriptive analyses
Initially Cronbach’s Alpha Test was performed to verify the consistency of the research instrument. The descriptive statistics were generated to obtain an overview of the sample, evidencing their demographic characteristics. The distribution frequency of answers on the Likert scale for CSF and barriers was also observed by constructing percentage graphs.
Bivariate Analyses
To verify the existence of significant differences among the answers of participants from different groups, bivariate analyses were performed using the SPSS software. The variables analyzed were time of experience on the subject, level of schooling, and consultants or not, using the Mann-Whitney test. For the variable occupation area, the Kruskal-Wallis test was used.
Principal Components Analysis
To generate groups between barriers and CSF, enabling the identification of latent variables, the multivariate statistical method of Principal Components Analysis (PCA) was used. The PCA variables, which are more homogeneous throughout the sample, will make up the first factors; on the other hand, those that are different in the different groups of the sample will make up the last factors (Hair et al., 2006). In this way, it was possible to identify what appear to be most important factors for the respondents.
PCA was implemented, according to the recommendations of Field (2009) and Hair et al. (2006), using SPSS software and separately for CSF and barriers. To conduct PCA, the correlation between the variables was verified using the Bartlett test to confirm the existence of significant correlations (p<0.05) and after it was analyzed visually. Finally, the Kaiser-Meyer-Olkin index (KMO) was observed, considering values higher than 0.50.
For the definition of the number of components, scree-plot analysis and Kaiser’s criterion were used, where components with eigenvalues higher than 1 were maintained. The total variance explained was also observed, a solution that explained, at least, 60% of the variance was considered adequate (Hair et al., 2006). The rotation method chosen for analysis was the orthogonal Varimax.
3. Results
The survey covered a total number of 185 respondents. Considering sampling of an unknown population, it presents a confidence of 90% and an error of 6%, approximately (Bolfarine et Bussab, 2005). Observing the total number of individuals contacted (597) a return rate of 31% was obtained. Considering the quality of the instrument, the Cronbach’s Alpha coefficients were acceptable, both for CSF (α = 0.816) and for barriers (α = 0.739) (Field, 2009).
Background of the Survey Respondents
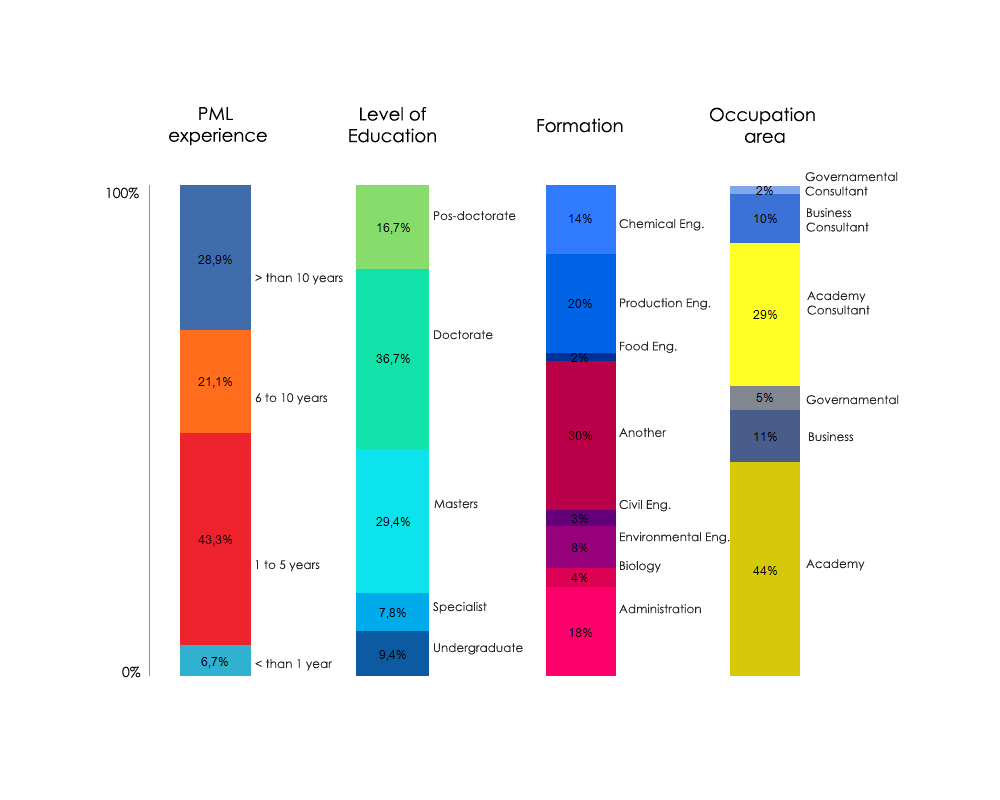
Figure 1 presents the time of experience with CP, schooling, formation and occupation area (divided among those who perform consultancy or not). Considering the formation, the respondents were from varied backgrounds, so that the category Other presents a substantial prevalence. Some formations that could be mentioned, comprised by this category, were: law, economics, chemistry and design. Observing the occupation area, it can be perceived that 41% of the sample carry out consultancy activities at businesses and 11% of the sample work in businesses (without performing consultancy activities). In this way, 51% of the respondents are connected to the entrepreneurial environment, resulting in a sample that comprises a balanced view both of academic and of business environment.
Figure 1. Demographic variables analyzed by the study.
Considering the result of the bivariate tests, in general, it was perceived that the respondents held the same opinion about the CSF and barriers, independent of the group to which they belonged. Even in the cases where the test performed proved significant, no discrepancies were found where there was a higher prevalence of answers discordant for one group and concordant for the other. The differences were rather related to one group having a greater prevalence of ‘agree’ and the other of ‘strongly agree’. This is an indication that, independently of occupation area, time of experience, level of schooling, and conducting consultancy or not, the respondents presented similar answers.
Frequencies of Answers
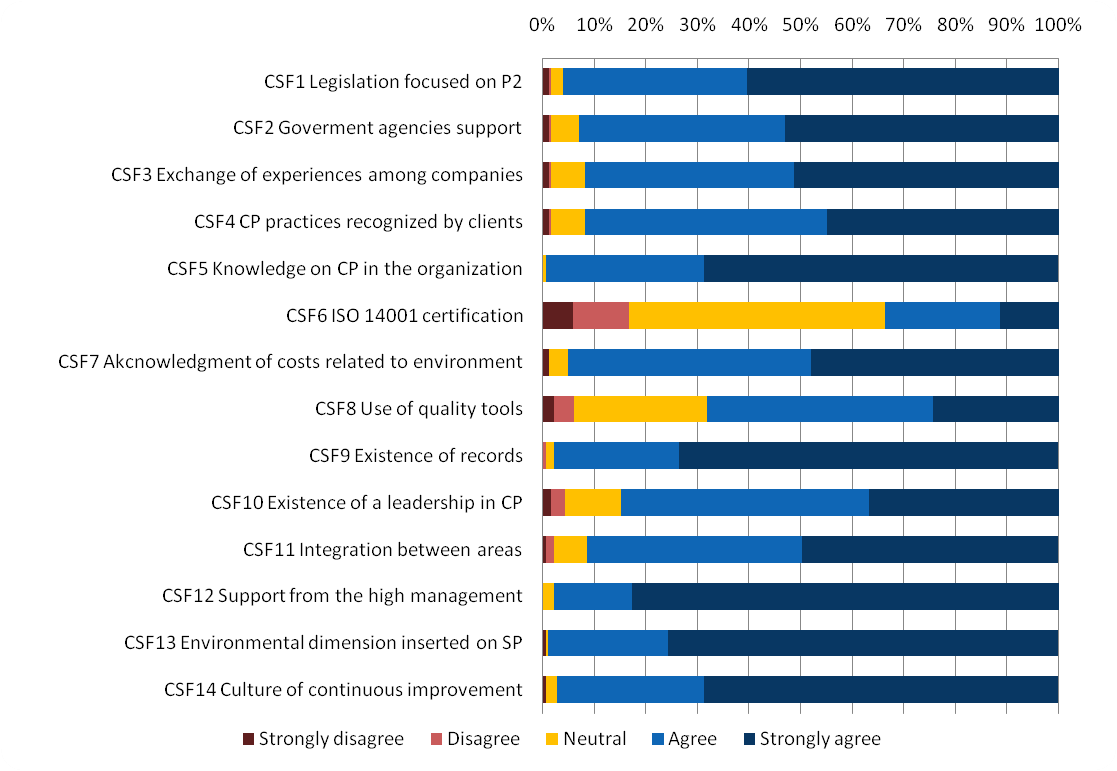
Considering the frequency of answers, figure 2 presents the results in percentage obtained for the CSF. The one with highest prevalence of strongly agree answers was ‘support from the higher management’ (CSF12 = 82.7%), followed by ‘environmental dimension inserted in the strategic planning’ (CSF13 = 75.7%), and succeeded by ‘disseminated knowledge in CP’ (CSF 5) and ‘culture of continuous improvement’ (CSF 14), equally with 68.6%. Both CSF 12 and 5 presented neutral as their minimum answer, which may be evidence of greater importance. Observing the other extreme, the factors that presented a greater prevalence of answers ‘strongly disagree’, were ‘existence of ISO 14001 certification’ (CSF 6 = 5.9%), ‘use of quality tools’ (CSF 8 = 2.2%), and ‘existence of a leadership in CP’ (CSF 10 = 1.6%). The other CSF presented values between 1.1% and zero.
Figure 2. Frequency of percentage answers for the CSF.
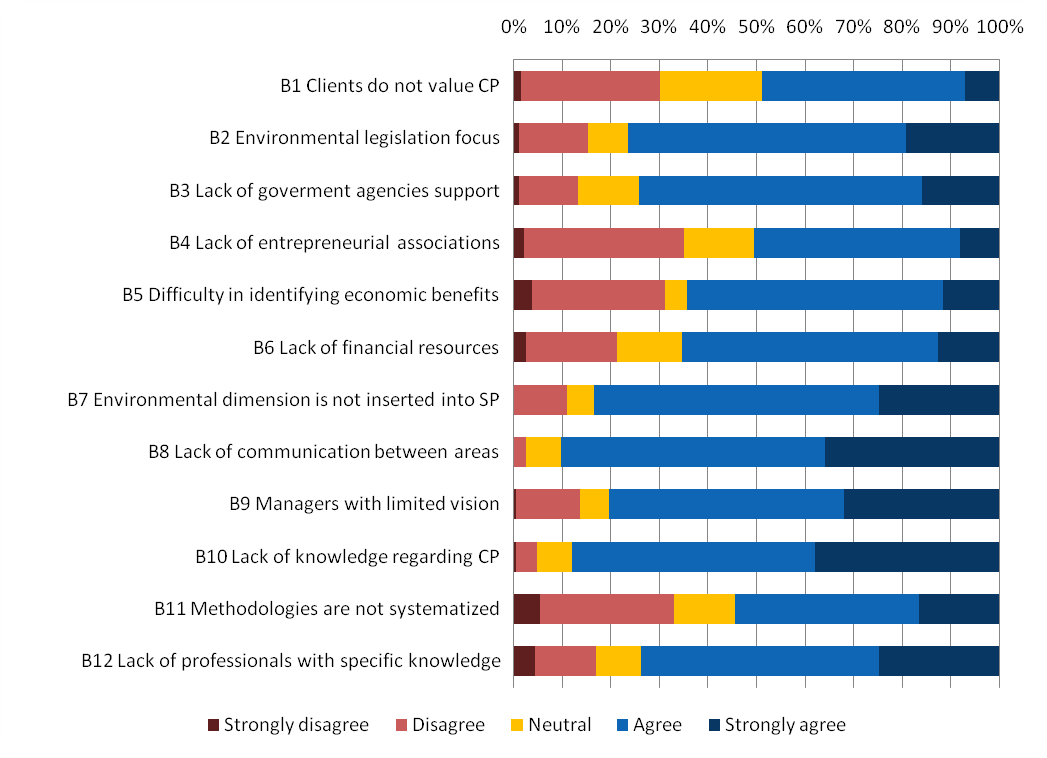
Considering the barriers, figure 3 shows the frequency of answers in percentages. The barriers with greatest frequency of answers ‘strongly agree’ were respectively: lack of knowledge regarding CP in the organization (B10 = 37.9%), lack of communication between the areas (B8 = 35.7%), managers are not prepared to see the environmental dimension (B9 = 31.9%), environmental dimension is not inserted in the strategic planning (B7) and lack of professionals with technical knowledge (B12) both with 24.7%. Observing the barriers that were most prevalently answered as ‘strongly disagree’, it is perceived that the rates of ‘disagree’ and ‘strongly disagree’ were greater than those for CSF. The barriers that had more answers as ’strongly disagree’ were respectively: lack of systematization of the methodologies (B11 = 5.5%), lack of professionals who have specific technical knowledge (B12 = 4.4%), difficulty in identifying economic benefits (B5 = 3.8%), lack of financial resources (B6 = 2.7%) and lack of entrepreneurial associations to exchange experiences with (B4 = 2.2%).
Figure 3. Frequency of answers for the barriers.
Principal Components Analysis
In order to conduct the PCA, it was first observed the existence of a substantial number of correlations greater than 0.3 and a limited number of correlations greater than 0.8, allowing the analysis execution (Hair et al., 2006). Considering the CSF, due to the low correlation presented between CSF7 and the other CSF, it was removed from the analysis. In this way, the PCA was conducted for 13 items using Varimax orthogonal rotation. The total KMO was equal to 0.816 and the individual indices of KMO were higher than 0.5, which is considered adequate (Field, 2009). Bartlett’s test was significant, indicating the existence of correlation (χ² (78) = 753.395, p<0.001).
The initial analysis indicated four components with eigenvalues greater than 1 (Kaiser’s criterion), explaining 63.6% of the total variance. The analysis of the scree-plot did not indicate a point of inflection that would justify altering the number of components. Thus, four components were maintained. Table 2 shows the loads of the factors after rotation.
Table 2. Principal components analysis for CSF.
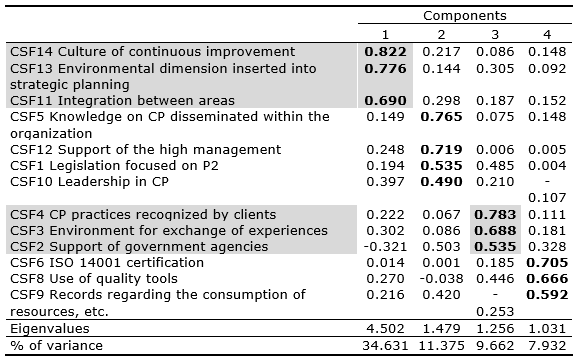
The first component comprised the CSF 14, 13 and 11, and is related to the culture of the organization. This component refers to the fact that concern about the environmental issues and a favorable organizational environment is what will enable adopting concepts such as CP. The second component contained factors related to resources to apply CP, comprising the CSF 5, 12, 1 and 10. Support, leadership, focus of legislations and existence of knowledge about CP are aspects that will enable applying CP in the organization, since there is already a culture orientated to it. The third component is related to external support and consists of the CSF 4, 3 and 2. This external support comprises clients, the chain to which the company belongs and the government. The fourth component contains CSF 6, 8 and 9, and is related to the tools and practices that may make easier to apply CP.
Observing the components order, it can be said that respondents appear to prioritize the presence of a culture turned towards environmental issues that encourages excellence, followed by the existence of people and arguments that support applying it. External support is the third most important component and lastly the technical factors.
The PCA for the barriers was conducted for 12 items using the Varimax orthogonal rotation. The total KMO was equal to 0.75 and the individual indices of KMO were higher than 0.5, which is considered adequate (Field, 2009). Bartlett’s test was significant, indicating that there are correlations (χ² (66) = 444.705, p<0.001). The initial analysis indicated four components with eigenvalues higher than 1 (Kaiser’s criterion), explaining 61.03% of the total variance; on the other hand, scree-plot analysis showed a point of inflection at five factors. However, the fifth factor presented an eigenvalue of 0.8 and would result in creating a component with only a single variable. Thus, it was considered more adequate to maintain four components (Table 3).
Table 3. Principal components analysis for barriers.
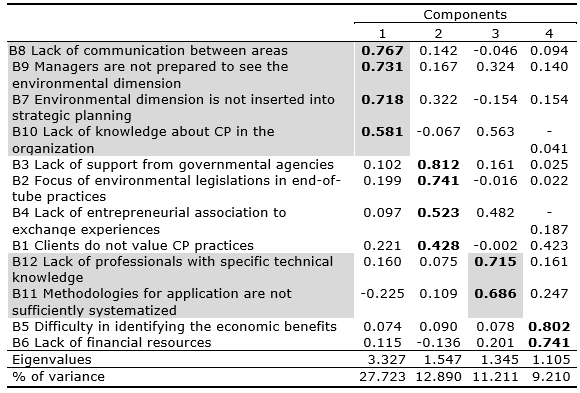
The first component comprised barriers 8, 9, 7 and 10, and was related to organization problems and to their culture. These barriers approached the lack of information, lack of concern about environmental issues and organizational aspects that are not favorable for applying CP. The second component covers barriers 3, 2, 4 and 1 dealing with external support. This component approached the lack of support mechanisms from the government and supporting entrepreneurial organizations. Besides, the external environment (other companies and society) does not encourage the adoption of CP practices. On the other hand, the third component deals with the technical factors and is composed by barriers 12 and 11. These barriers approach the lack of professionals with technical knowledge concerning CP and possible difficulties of using methodologies for applying CP. The last component deals with economic factors and is comprised of barriers 5 and 6. The financial resources ultimately are not used for environmental actions and usually the advantages of using them for this purpose are not perceived.
4. Discussion
The results present aspects that help understand what is necessary to disseminate CP in Brazil. The most crucial aspects were those that concern the internal environment, and can be divided into related to organizational culture, and subsidies to implement this culture. A graphical representation of the PCA analysis for barriers and CSF was developed, seeking to improve comprehension (figure 4). The principal components obtained in the PCA analyses were distributed in their order of importance and are marked by gates that must be read from left to right. The components may comprise factors that concern the internal and/or external environment.
The figure 4 has a central line separating CSF and barriers. However, it can be perceived that there are cases where the same attribute can be a CSF or a barrier, depending on its existence, or on whether its orientation favors CP. For instance, in the case of integration and knowledge in CP, if these do not exist, they will be considered a barrier. In the case of strategic planning, if it does not expressly include the environmental dimension it will be an obstacle.
Figure 4. Barriers and Critical Success Factors related to CP application in Brazil.
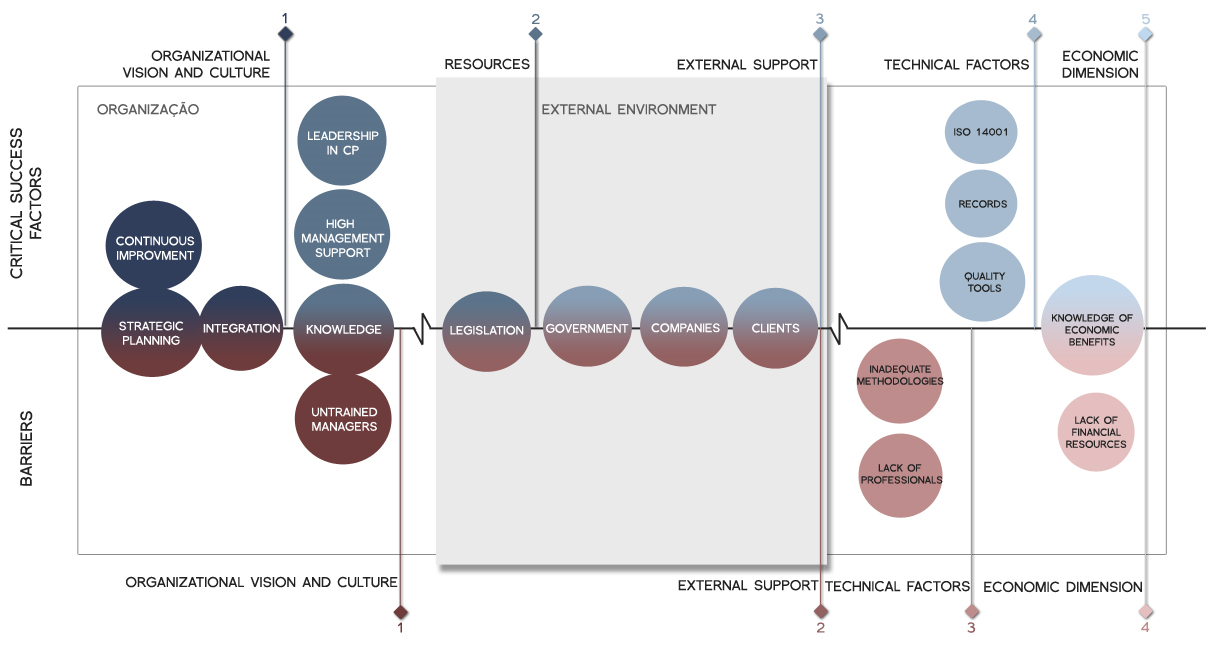
In this way, both for CSF and barriers it begins by gate number one, called organizational vision and culture, which is in the internal environment. This is a sign that everything begins with the will of the organization. Considering the CSF, the existence of concern with environmental issues in the strategic planning (CSF13), as well as a culture of continuous improvement (CSF14), and integration between areas (CSF11) are priority aspects, comprising the first component of the PCA analysis. If these aspects are not present, they become barriers. These findings agreed with some studies of the international literature, which also identified the insertion of the CP values in company strategy as a priority factor for applying it successfully (Van Hoff, 2014; Tseng et al., 2009; Shin et al., 2008; Orsato, 2006; Stone, 2006).
The second gate to CSF is composed by the resources to apply CP, which travels between the organizational environment and the external environment, due to the inclusion of legislation. According to the answers of professionals, once the organization has a culture aligned with CP goals, the resources for achieving it are approached, such as the support of high management (CSF12), knowledge of CP (CSF5) and leaders who encourage this application (CSF10). In a study performed by Stone (2006) the commitment of high management was also identified as a major factor. Tseng et al. (2009) also state that the existence of managers who act as leaders in applying CP is a priority. Agreeing with what has been said so far, Staniskis (2011) points to the greater need of human factors as compared with the technical ones for the success of CP.
Then existence of external support is included, behaving differently when faced within the scope of the CSF or of the barriers. For the CSF, it presents as the third principal component, but for the barriers, as the second. This may be evidence that, in the opinion of the respondents, if the company has a culture and internal commitment, it will be successful in applying CP even if the external environment does not support it. However, in cases where there is lack of internal support, this external incentive may be the factor that will allow the successful application of CP. Authors such as Dieleman (2007) and Shin et al. (2008) remark that the external environment may not be only a support, but an agent protagonist of change, promoting the dialogue between government, industry and community. Besides, the wish to adhere to social codes of ethics, managing the company according to the stakeholders’ interests may be a determining factor (Reinhardt, 1999). It could also be said that, ideally, this application should arise from an internal will and be supported by the external environment; however, if this internal will does not exist, the external environment should provide incentives. In addition, Shin et al. (2008) underscored that a sustainable society requires not only continuous internal efforts, but also social aspirations to improve and advance the existing structures.
The technical factors are then represented as the fourth gate for the CSF and the third gate for the barriers. And the final gate both for CSF and barriers is concerned with the economic dimension. In this way, financial aspects that were pointed out in the literature by Dieleman (2007), Daddi et al. (2013) and Dobes (2013), as a major obstacle to applying CP, appears not to be such a significant barrier in the opinion of the participants. In this study, the fourth component of the barriers PCA was comprised by difficulty in recognizing the economic benefits (B5), and lack of financial resources (B6). The barriers that were presented as more significant in this study were related to lack of communication between areas (B8) and lack of knowledge in CP (B10).
Analyzing the measures that can be taken for CP to be applied more effectively, it is perceived that the main one is the repositioning of the external environment. Especially in issues concerning legislation and government agencies, these should not be considered obstacles to applying CP. Government is one of the players that has the greatest power of influencing companies, and even the vision of society. A survey conducted by Oliveira Neto et al. (2016) also concluded that the engagement of stakeholders, such as governmental agencies and academia, is necessary to promote CP in Brazil. It is positive that companies can apply CP by their own will, but one of the measures that appear to be necessary for CP to become a common practice to all Brazilian companies is that the external environment no longer be positioned as the second gate to the barriers and become more crucial to apply CP.
5. Final Remarks
This article aimed to identify the critical success factors and the barriers involved in applying CP in Brazil. It was possible to observe a consistence among the answers of the participants in this study, independent of respondents’ background and characteristics such as time of experience on the subject or level of schooling. The answers evidenced that both the main CSF and the barriers concern the organizations. Nevertheless, these are not tools or methodologies that they use to apply it or even economic issues, but central aspects such as their vision, culture and forms of management.
The study participants indicated that the priority for achieving success applying CP in Brazil is that the organization should acknowledge its importance and internalize it in their strategic planning. Besides, it is relevant to have an internal environment that will allow cooperation and knowledge exchange. On the other hand, when measures that can be taken for a more effective dissemination of CP in Brazil are approached, it can be perceived that a repositioning of the external environment (government, other companies, academia, and consumers) is necessary, acting as a strong incentive and support for applying CP.
Considering future studies, evidences found during data collection indicate that the individual dimension should be included in future analyses. This study observed the organization and external environment and what was identified as a priority: the culture orientation of organizations; therefore, it appears useful to investigate the origin of this culture. Since it has been found that this motivation in favor of CP is crucial, it is important to understand how it emerges. Being the organization composed by individuals, it appears essential to analyze their motivations.
References
Baas, L. (2008), “Cleaner production and industrial ecology: a dire need for 21st century manufacturing”, In Handbook of Performability Engineering, Springer, London, pp. 139-156.
Babbie, E. (1999), Métodos de pesquisas de survey, UFMG, Minas Gerais.
Bolfarine, H., Bussab, W. O. (2005), Elementos de amostragem, Vol. 1, Edgard Blücher, São Paulo, SP.
Bonilla, S. H. et al. (2010), “The roles of cleaner production in the sustainable development of modern societies: an introduction to this special issue”, Journal of Cleaner Production, Vol. 18, pp. 1-5.
Daddi, T. et al. (2013), “Transferring the Integrated Pollution Prevention and Control (IPPC) Approach and Best Available Techniques (BAT) Concepts to Egypt, Tunisia and Morocco”, Sustainability, Vol. 5, pp. 2944–2959.
Dieleman, H. (2007), “Cleaner production and innovation theory; social experiments as a new model to engage in cleaner production”, Revista Internacional de Contaminación Ambiental, Vol. 23, No. 2, pp. 79-94.
Dobes, V. (2013), “New tool for promotion of energy management and cleaner production on no cure, no pay basis”, Journal of Cleaner Production, Vol. 39, pp. 255–264.
Field, A. (2009), Discovering statistics using SPSS, Sage publications.
Forza, C. (2002), “Survey research in operations management: a process-based perspective”, International Journal of Operations & Production Management, Vol. 22, pp. 152-194.
Fresner, J. (1998), “Cleaner production as a means for effective environmental management”, Journal of Cleaner Production, Vol. 6, pp. 171-179.
Hair, J. F. et al. (2006), Multivariate data analysis, Vol. 6, Pearson Prentice Hall, Upper Saddle River, NJ.
Leidecker, J. K., Bruno, A. V. (1984), “Identifying and using critical success factors”, Long Range Planning, Vol. 17, No. 1, pp. 23-32. Oliveira Neto, G. C. et al. (2016), “The state of research on cleaner production in Brazil”, Revista de Administração de Empresas, Vol. 56, No. 5, pp. 547-577.
Orsato, R. J. (2006), “Competitive environmental strategies: when does it pay to be green?”, California Management Review, Vol. 48, pp. 127-143.
Pereira, G. R., Sant'Anna, F. S. P. (2012), “Uma análise da produção mais limpa no Brasil”, Revista Brasileira de Ciências Ambientais, Vol. 24, pp. 17-26.
Reinhardt, F. (1999), “Market failure and the environmental policies of firms: Economic rationales for “beyond compliance” behavior”, Journal of Industrial Ecology, Vol. 3, pp. 9-21.
Ribeiro, F. M., Pacheco, J. W. F. (2011), “Cleaner Production at an Environmental Agency: 15 Years of Experience at CETESB, Sao Paulo–Brazil”, In III International Workshop Advances in Cleaner Production: Cleaner Production Initiatives and Challenges for a Sustainable World, São Paulo, SP, 18–20 May, 2011.
Shin, D. et al. (2008), “Development of a sustainability policy model for promoting cleaner production: a knowledge integration approach”, Journal of Cleaner Production, Vol. 16, pp. 1823-1837.
Staniškis, J. K. (2011), “Water saving in industry by cleaner production”, In Coca-Prados J., Gutiérrez-Cervelló G. (eds), Water Purification and Management, NATO Science for Peace and Security Series C: Environmental Security. Springer, Dordrecht.
Stone, L. J. (2006), “Limitations of cleaner production programmes as organisational change agents. II. Leadership, support, communication, involvement and programme design”, Journal of Cleaner Production, Vol. 14, pp. 15–30.
Tseng, M.-L. et al. (2009), “Fuzzy AHP-based study of cleaner production implementation in Taiwan PWB manufacturer”, Journal of Cleaner Production, Vol. 17, pp. 1249–1256.
Van Hoof, B. (2014), “Organizational learning in cleaner production among Mexican supply networks”, Journal of Cleaner Production, Vol. 64, pp. 115–124.
Vieira, L. C., Amaral, F. G. (2016), “Barriers and strategies applying Cleaner Production: a systematic review”, Journal of Cleaner Production, Vol. 113, pp. 5-16.