SAMU ambulance positioning using MALP model
Ormeu Coelho1, Fernando Alexandrino1, Bruno Barreto1
1 Federal Center for Technological Education Celso Suckow da Fonseca – CEFET/RJ
Abstract
One of the constitutional principles of the public health care system in Brazil is universality, which turns health into a fundamental right and ensures that all citizens shall have access to health service whenever required. The purpose of this study is to assess the positioning of ambulances in Duque de Caxias-RJ, and find new arrangements to maximize the covered population. The configuration of a network that provides such service is indeed significant since small deviations may lead to users’ death. Therefore, four scenarios were built in order to represent different network arrangements, according to the manager’s strategy or the budget limitations of the city. An Integer Programming model for servers’ positioning was used in each scenario. Indicators such as percentage of coverage population and total cost were then used to compare and choose the best solution. Results have shown that the current coverage could be doubled by just relocating facilities that already exist, without adding any costs. It is important to notice that this solution is rather different from the current positioning.
Keywords: facility location; emergency services; Integer Programming; ambulance positioning.
1. Introduction
In the public sector, particularly in health care, one of the logistics problems of greatest interest is the ambulances’ location, in order to create an emergency care network. The location of this kind of facility is quite sensitive to the required service level, mainly characterized by the service response time, since a poor coverage may result in the death of the user of this service. Bertelli et al. (1999) say that the highest frequency of survival in cardiac arrest victims occurs when the resuscitation maneuvers are carried out within 8 minutes.
Thus, it can be found in the literature plenty papers that use optimization techniques in order to design a network that maximizes coverage or minimizes the response time. For instance, Eaton et al. (1985) saved $3.4 million in construction costs in Austin (Texas), while, in Bangkok, Fujiwara et al. (1987 reduced the total number of ambulances from 21 to 15, keeping the average response time and, more recently, Takeda et al. (2004) reduced the average travel time by only repositioning ambulances.
According to the Brazilian Health Ministry, the Serviço de Atendimento Móvel de Urgência (SAMU - Mobile Emergency Care Service) system covered 70.9% of Brazilian population in 2012 (Ministério da Saúde, 2013). Besides, SAMU’s policy also allows the decision maker to create decentralized operational bases for ambulances and their teams, using headquarters’ infrastructure or the minimum essential space for a proper work. This paper is mainly based on this concept, as will be seen further.
Duque de Caxias is a city in the metropolitan region of Rio de Janeiro that has 464,619 square kilometers of land area and 855,048 inhabitants, distributed among 40 districts (IBGE, 2010). They are grouped in four regions: Duque de Caxias, Campos Elíseos, Imbariê and Xerém. The city has only 9 ambulances to provide cover for its population, which is almost one ambulance for each 100,000 inhabitants.
The current study aims: (i) to analyze the service level of the current disposition of ambulances in the city; (ii) to propose new logistics arrangements through the use of optimization models for increasing the system’s coverage; and (iii) to compare the alternative solutions obtained by the optimization model. In order to accomplish these goals we have analyzed four scenarios, which give the decision maker alternatives that can be chosen according to the city’s policies. In each scenario new arrangements are proposed for positioning the ambulances, increasing the coverage, even when lacking budget.
This paper was organized into 5 sections. Section 2 presents a brief literature review on emergency location models, thus allowing a proper selection of a model adherent to our application. Section 3 details the way data have been acquired and how the mathematical model was applied to them. The results obtained for each scenario are discussed in Section 4 and compared to the current situation. Finally, Section 5 sums up the achievements and considerations of this study for future research.
2. Literature Review
When it comes to emergency service location and relocation models, it is possible to find plenty of models in the literature, which have been developed over the last 30 years (Brotcorne et al., 2003). Despite each model’s particularity, the coverage of the users by servers within a predefined response time is a common requirement for all of them.
Coverage problems such as this are usually defined over a valued graph G=(V,E), such that each node in V represents a demand point and/or a potential location for the ambulances. The set of edges represents the urban road network through these nodes. There is a positive real number dij indicating a distance/time for crossing edge (i,j). Given a pair of nodes i and j, a demand node j is covered by a server located in node i if, and only if, the distance or travel time tij between these nodes is less than or equal to a coverage limit, T, i.e. tij≤T. Thus, Vj = {i ∈ V:tij≤T} is the set of sites i that cover demand point j.
The most incipient models, regarding ambulance, location is the Location Set Covering Model (LSCM), proposed by Toregas et al. (1971) and Maximal Covering Location Problem (MCLP), introduced by Church et ReVelle (1974). While LSCM aims to minimize the number of vehicles needed to cover all demand points, MCLP tries to maximize population coverage by means of a given limited number of ambulances.
However, such models are not suitable to deal with traffic jam. As pointed out by Galvão et al. (2003a), in congested systems, ambulances can be busy among 20% and 30% of the time, thus requiring any sort of modeling of that probabilistic behavior. The usage of backup servers is a possible strategy for increasing the service level. Following these ideas, Hogan et ReVelle (1986) introduce BACOP1 and BACOP2 models. The authors use two different binary variables to indicate the coverage of a demand point by one or two servers, respectively.
Later, Schilling et al. (1979) come up with a model called Tandem Equipment Allocation Model (TEAM) that couples with two different types of vehicles. Usually, health emergency systems operate with two types of vehicles: basic life support (BLS), which is able to serve basic emergencies, since it is equipped with a limited number of instruments; and advanced life support (ALS), which is equipped to deal with severe cases. In Brazil, BLS is used for patients who do not need medical intervention during the transport, while ALS assists high risk patients who need intensive medical care (Ministério da Saúde, 2006). In TEAM, each type of vehicle has its own coverage limit, given by TA or TB, such that:

are, respectively, the set of sites i that cover the demand point j by a BLS and an ALS. TEAM aims to maximize covered demand covered by both kinds of ambulances.
Gendreau et al. (1997) introduce the Double Standard Model (DSM) based on the concept of multiple coverage: all demand points should be covered by an ambulance to a time less than T and a rate β of the requests should also be met by another ambulance in S units of time (T>S). This response time is limited by Ball et Lin (1993) to, at most, 10 minutes in urban areas with β=95%, and may be augmented to 30 minutes in rural areas, according to United States regulations. At the beginning of the last decade in London, 95% of the requests should be answered within 14 minutes; however, there was no limit on T (Galvão et al., 2003b).
All previous formulations are deterministic whereas the usage of probabilistic models is an evident research direction in these kinds of applications. The Maximum Expected Covering Location Problem proposed by Daskin (1983) assumes that all facilities have the same probability ρ of being busy (the busy fraction). Therefore, given a node j covered by k ambulances, the expected covered demand is defined by:
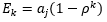 .
.
It is important to note that more than one ambulance may be located at the same node (Brotcorne et al., 2013).
The Maximum Availability Location Problem (MALP) was presented by ReVelle and Hogan (1989) in two different versions, which differ from each other according to the busy fraction imposed to each type of ambulance. Galvão et al. (2003a) explain that MALP I assumes that all servers have the same busy fraction ρ. On the other hand, in MALP II the busy fraction is computed to each server, thus resulting in specific values for each geographic area. The authors note that MALP II requires a simulation model, or anything similar, in order to compute specific rates for each server according to the solutions. ReVelle and Hogan (1989) also attest that MALP II is more complex, since the busy fraction is an output of the model and cannot be known a priori. Both models deal with stochasticity under simplifying assumptions.
MALP I aims to locate P ambulances so that the greatest number of calls to a particular emergency service always have a server to answer them within a distance/time of no more than T with reliability θ (Galvão et al., 2003a). Daskin (1983) defines the busy fraction as shown in (1).
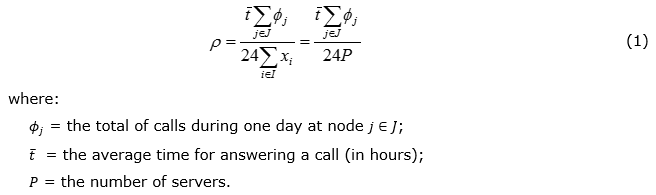
Furthermore, constraint (2) defines that, at least, one vehicle must be available to a demand node j ∈ J for a distance/time of, at most, T, with probability of, at least, θ.
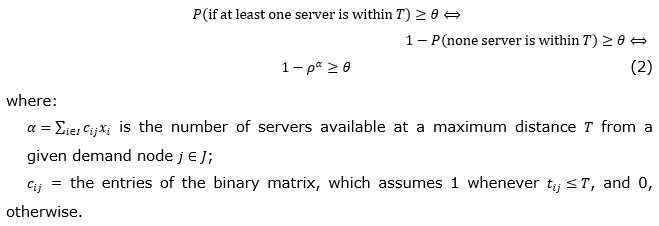
As the desire is to cover a specific area with reliability θ, there must be, at least, b servers able to attend this area as shown in (3).

It means that, for each demand point j, there must be, at least, b servers within T so that it can be covered with reliability θ. Thus, in order to maximize the number of calls that are answered with the given reliability, one can maximize the number of calls with, at least, b servers available within T (Galvão et al., 2003a). Thus, consider the following decision variables:
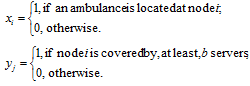
MALP I formulation, as defined by Mohorosi (2008), is given in (4)-(7).
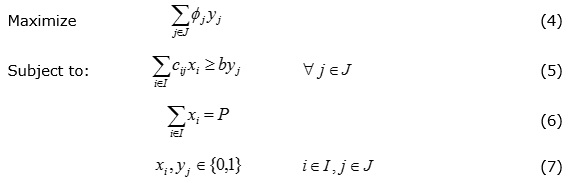
The objective function (4) maximizes the total calls along all demand points. Constraint (5) ensures that a node j is covered only when there are, at least, b ambulances within a distance of, at most, T. Equation (6) specifies the number of ambulances to be located. Along the following section the MALP I, a formulation is used for evaluating possible positioning strategies for SAMU ambulances in the city of Duque de Caxias-RJ.
3. Data Modeling
The previous literature review suggests that MALP I is the most suitable model, according to our main proposal: maximize coverage while taking into account the effect of server’s congestion. The application of this model to the data obtained from the Duque de Caxias’s ambulance system assumes a partition of the geographical area of the city into 48 nodes: 22 nodes are related to sites where there already exists an infrastructure for ambulance location (such as hospitals or emergency units), while the others 26 refer to districts in which the city is divided, but do not have such structure. The same population distribution of the city's districts was adopted, according to information acquired through the census carried out by IBGE in 2010 (IBGE, 2010). When there was more than one allocation candidate site at the same district, the population was divided equally between them. For instance, Xerém district has 3 candidate sites for ambulance location. Therefore, this district’s population has been divided by 3 and each site turned into a node with its own ZIP code and specific demand.
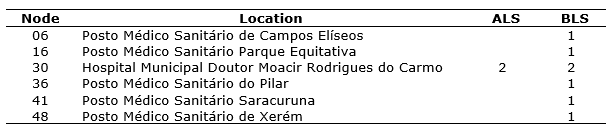
Through an interview with the operational coordination of SAMU in Duque de Caxias, hospitals, health clinics and UPAs (emergency units) in the city were identified as candidate points for receiving a facility without fixed installation costs. In the remaining districts, a ZIP code was arbitrarily chosen, and the installation costs were estimated according to information provided by real estate market companies. The following ZIP codes have been randomly chosen according to the district zone. Table 1 describes the nodes of the network considered in the study, such that the shaded ones are those where installation costs are null.
Table 1. Network nodes
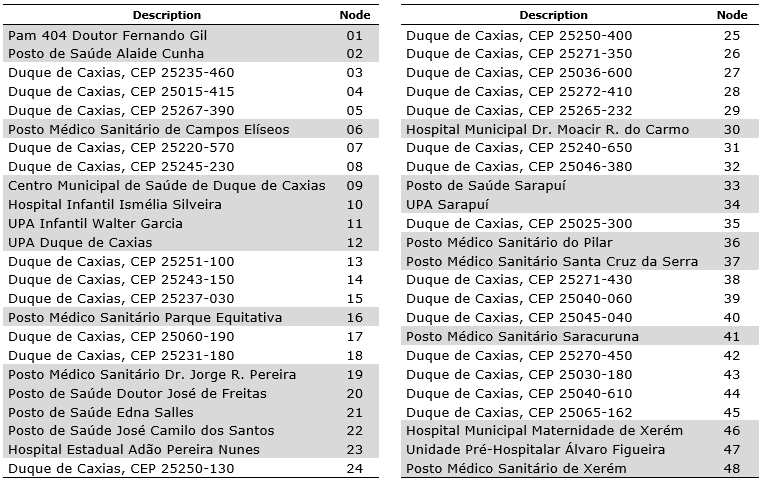
Source: The authors’ own
The total cost for installing each new facility was estimated by: (i) a fixed cost for building and equipping sites (28m² for every building); (ii) a variable cost accord to the number of ambulances to be located at the facility (20m² for each ambulance). Table 2 shows the estimated costs of a new facility in each district. While the first column refers to fixed costs, the second one is presented as the cost per ambulance, as it is related to the area occupied by each server.
Table 2. Installation costs
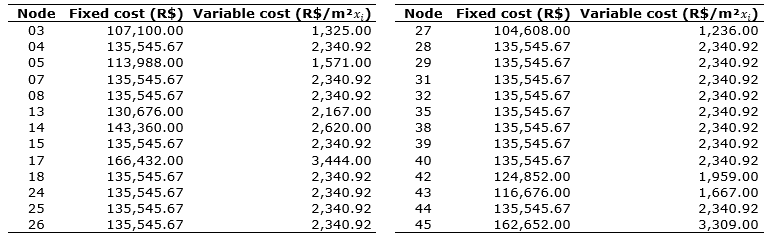
Source: The authors’ own
In this study the number of calls ϕj was replaced by the number of inhabitants in the geographical area of node j, aj. In the lack of historical calls to SAMU data system in Duque de Caxias, this is a reasonable simplifying assumption in terms of the distribution of emergency calls along population in a long term analysis. The population of each node and its geographic coordinates (latitude – LAT – and longitude – LONG) can be found in Table 3.
Table 3. Population distribution
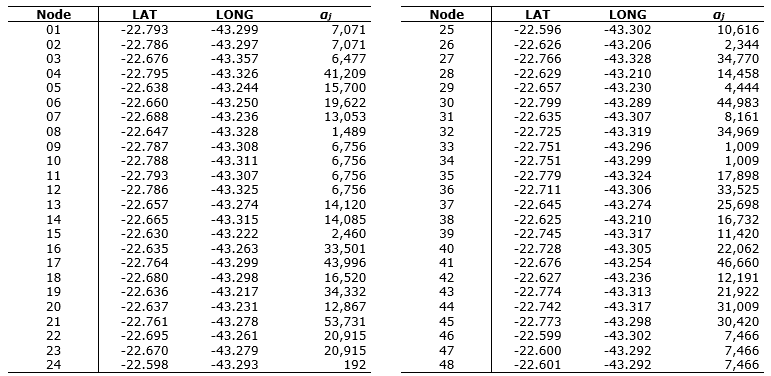
Source: The authors’ own
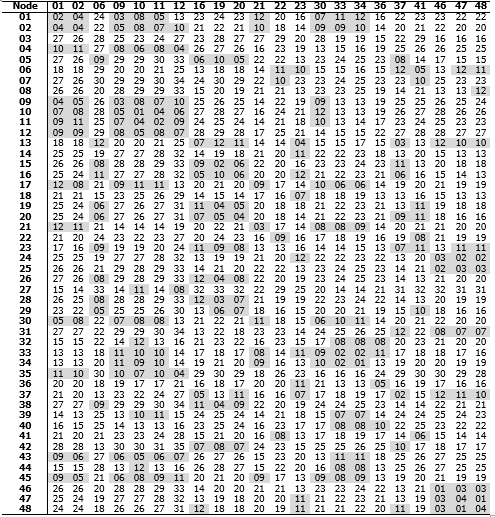
The travel time between a facility i and demand point j, tij, in minutes, was computed, taking into account the geographical coordinates of these nodes and the urban infrastructure for mobility. A simple VBA code was then used for recovering the routes and the travel time between i and j, with the support of Google Maps API. Once travel time is usually higher during rush hours, samples of the travel time were taken between 5 and 7 pm, in order to simulate the worst traffic condition. Table 4 shows the average of these samples, such that the shaded ones are those where cij=1.
Table 4. Average travel time tij (in minutes)
Source: The authors’ own
4. Alternative Network Configuration
This section was split into two parts. First, the current network configuration is presented, followed by its attendance statistics. After that, four alternative configurations for the SAMU network were analyzed by changing a few premises, representing different management strategies. All experiments were made, assuming a coverage limit = 12 minutes and P = 9 ambulances of BLS type. Moreover, the required confidence level θ was 80%, which corresponds to coverage of a demand node by, at least, b = 3 servers.
The computational experiments described in this section were computed in a notebook Dell Inspiron 14R 3350 model with Intel Core™ i5 processor, operating system Windows 7 Ultimate 64-bit and 6GB of RAM. The Integer Program (1)-(8) model was coded in AIMMS (Advanced Integrated Multidimensional Modeling Software) version 4.0 and optimized by CPLEX 12.6.
4.1 Current scenario analysis
As in many Brazilian cities, the positioning of ambulances of the SAMU system in Duque de Caxias is made empirically, without the support of any computational tool. This often leads to an increase in the response time and the probability of losing calls due to low confidence level. Table 5 shows the current positioning of ambulance in the city.
Table 5. Ambulances current distribution
Source: The authors’ own
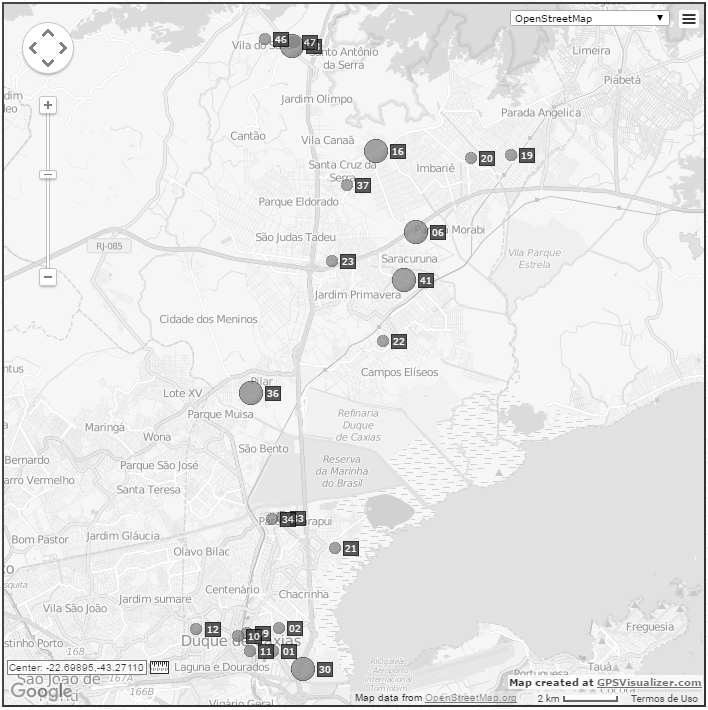
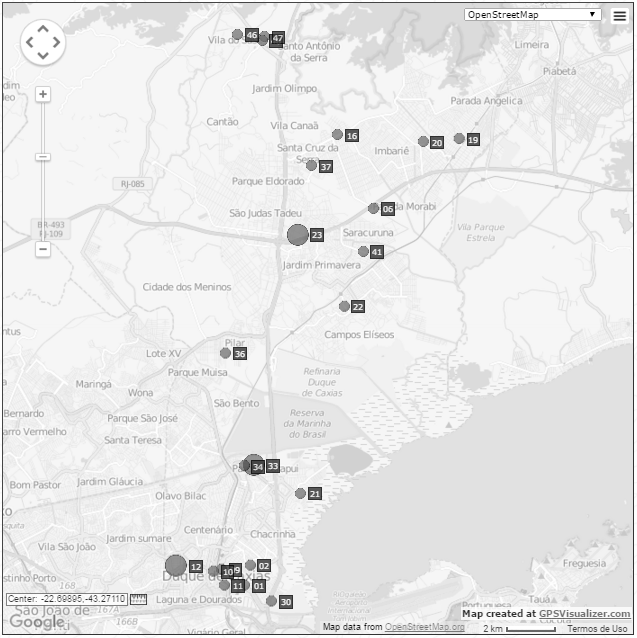
The coverage for this configuration was computed according to MALP’s premises and, thus, no distinction has been established between basic and advance ambulances, in order to keep homogeneity required by this model. Therefore, only 37.9% of the population is covered within 12 minutes for θ = 80%. It follows that almost two thirds of the citizens are not covered to the required service level. The current distribution of servers is shown in Figure 1, which shows the 22 vertices with no location costs. Spots with smaller diameter are nodes which have the structure for ambulance location but there is no ambulance currently, while those ones with larger diameter represent a node where there is a server positioned.
Figure 1. Current distribution of ambulances
Source: The authors’ own
4.2 Proposed scenarios
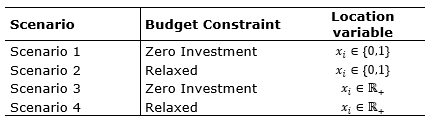
Four planning scenarios were built in order to evaluate the impact of the redistribution of ambulances along the same or the new candidate locations. By enforcing the usage of the same set of candidate nodes of the original configuration, the decision maker searches an improved solution without the need of new investments. Thus, it is a more conservative approach. Later, the model is allowed to position the ambulances in any of the 48 nodes considered in the study. The solution produced by the MALP I model, in the absence of any budget limitation, corresponds to the best solution attainable by a set of 9 ambulances. The placement of more than one ambulance in the same node was also evaluated, once managers tend to disperse the ambulances along the network as an attempt of increase coverage, regardless of the congestion effects. First, the decision variables were defined binary, as in the original MALP I formulation, and then changed to nonnegative integers to allow the positioning of more than one ambulance per node. Table 6 summarizes the characteristics of the scenarios.
Table 6. Proposed scenarios
Source: The authors’ own
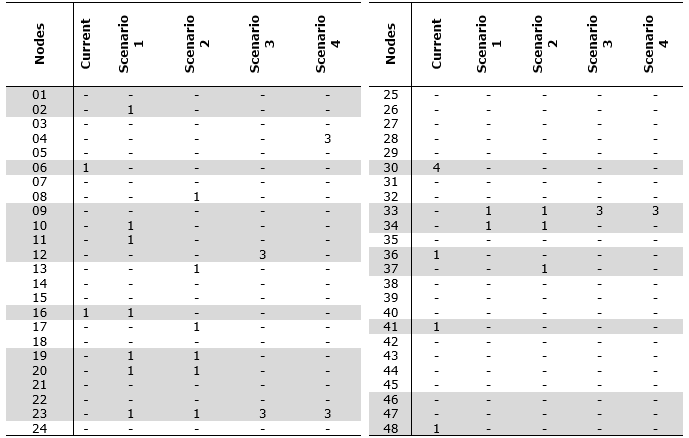
The optimal solutions found for each scenario are shown in Table 7, in which the shaded lines indicate these nodes, where there is already infrastructure capable of receiving one or more ambulances. Note that, even in scenarios where the budget constraint is relaxed, the opening of new facilities is not fully used by the model, being requested three times in scenario 2 (nodes 08, 13 and 17) and only once in scenario 4 (node 04). It is worth to point out that the current position of the servers was not chosen by the model in any of the studied scenarios, except by one ambulance located at node 16 in scenario 2. Thus, as it follows, the same set of resources (bases and ambulances) is able to provide better coverage through a quite distinct allocation of servers.
Moreover, the results suggest that nodes 23 and 33 are chosen in all tested scenarios, showing that these are strategic facilities to increase population coverage. However, they are not used in the current configuration of this logistic network, which concentrates four servers at node 4 whilst other nodes are not covered by, at least, three servers.
Table 7. Optimal distribution of ambulances in each scenario
Source: The authors’ own
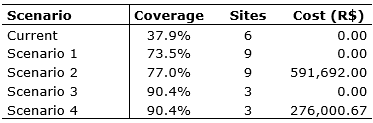
Another interesting result is the smaller number of used bases in scenarios 3 and 4 that clearly favors the reduction of the overall logistic cost. In both cases, two facilities received three ambulances. Comparisons among the solutions found for each scenario were based on the obtained coverage and the installation cost. The results are summarized in Table 8 together with the number of opened sites. The benefits of using an optimization technique for designing emergency service networks are expressive, enabling the care of population twice as large as the current one. And this improving is obtained by just relocating the already available ambulances.
Table 8. Indicator for each optimization scenario
Source: The authors’ own
Once the binary variables decision variables in (1)-(6) have been relaxed to nonnegative integers, the solution of scenarios 3 and 4 are upper bounds of the solutions found for scenarios 1 and 2, respectively. There is a remarkable gap among solutions found for these scenarios, which emphasizes the advantage of concentrating ambulances in certain strategic nodes. It should also be noted that, among the proposed scenarios, the integer alternative (90.4% coverage – scenarios 3 and 4) is more efficient than the original MALP I (77% coverage – scenario 2), where allocation variable is binary. In other words, coverage decreases when it is forbidden to locate more than one ambulance at the same facility, forcing their dispersion along the network. It means that, in this study, the strategy that maximizes coverage population creates clusters, or partitions, at nodes, instead of using coverage intersections for different sites. Figure 2 shows geographical servers’ distribution for the best configuration – scenario 3.
Figure 2. Distribution of ambulances on scenario 3
Source: The authors’ own
5. Conclusion
This work showed the considerable benefits of designing emergency service networks with the aid of optimization techniques. The results achieved in our case study show that the coverage of the population of Duque de Caxias could be considerably increased by just relocating the already available resources. This simple step reduces the response time of the callings received by the SAMU system in this city.
The service network was modelled according the distribution of the city's districts and their respective population. Four scenarios were built to represent possible alternatives for the repositioning of the ambulances. According to the achieved results, it is possible to expand the covered population by only relocating servers along facilities already in operation. The allocation of more than one ambulance per site seems to be the most effective strategy for this real instance. Another advantage is the substantial reduction in the number of required operational sites.
The main limitations of our study refer to availability of data, making it necessary to adopt simplifications, such as modeling only one type of demand/ambulance. New studies should focus on data collection on arrival rate of callings from each demand node, as well the transit time throughout the network. The stochastic nature of such data suggests the usage of a stochastic approach. In this sense, there are possibilities as a bi-level optimization approach that integrates one model for positioning the ambulances and another to evaluate the response time under random transit times, random arrival rates and congestion effects on servers. The recent advances in Stochastic and Robust Optimization techniques also offer new possibilities for modeling and solving the problem of designing emergency service networks.
References
Ball, M. O.; Lin, F. L. (1993), “A reliability model applied to emergency service vehicle location”, Operations Research, Vol. 41, No. 1, pp. 18-36.
Bertelli, A. et al. (1999), “Estudo preliminar das relações entre duração da parada cardiorrespiratória e suas consequências nas vítimas de trauma”, Revista Escola de Enfermagem USP, Vol. 33, No. 2, pp. 130-141.
Brotcorne, L. et al. (2003), “Ambulance location and relocation models”, European Journal of Operational Research, Vol. 147, pp. 451-463. Church, R. L.; ReVelle, C.S. (1974), “The maximal covering location problem”, Papers of the Regional Science Association, Vol. 32, pp. 101-118.
Daskin, M. S. (1983), “A maximum expected location model: Formulation, properties and heuristic solution”, Transportation Science, Vol. 7, pp. 48-70.
Eaton, D. J. et al. (1985), “Determining emergency medical deployment in Austin, Texas”, Interfaces, Vol. 15, No. 1, pp. 96-108.
Fujiwara, O. et al. (1987), “Ambulance deployment analysis: A case study of Bangkok”, European Journal of Operational Research, Vol. 31, pp. 9-18.
Galvão, R. D. et al. (2003a), “Solução do problema de localização de máxima disponibilidade utilizando o modelo Hipercubo”, Pesquisa Operacional, Vol. 23, No. 1, pp. 61-78.
Galvão, R. D. et al. (2003b), “Towards unified formulations and extensions of two classical probabilistic location models”, Computers & Operations Research, Vol. 32, pp. 15-33.
Gendreau, M. et al. (1997), “Solving an ambulance location model by tabu search”, Location Science, Vol.5, pp.75-88.
Hogan, K.; ReVelle, C. S. (1986), “Concepts and applications of backup coverage”, Management Science, Vol. 34, pp. 1434-1444.
Instituto Brasileiro de Geografia e Estatística - IBGE (2010), “Censo Demográfico 2010”, available at: http://cidades.ibge.gov.br/xtras/perfil.php?codmun=330170 (Acessed on 26 March 2014).
Ministério da Saúde (BR) (2006), Regulação médica das urgências, Ministério da Saúde, Brasília, DF, available at: http://bvsms.saude.gov.br/bvs/publicacoes/regulacao_medica_urgencias.pdf (Acessed on 11 October 2013).
Ministério da Saúde (BR) (2013), SAMU – Conheça como funciona o Serviço de Atendimento Móvel de Urgência, Ministério da Saúde, Brasília, DF, available at: http://www.blog.saude.gov.br/index.php/programasecampanhas/33194-samu-conheca-como-funciona-o-servico-de-atendimento-movel-de-urgencia (Acessed on 22 September 2013).
Mohorosi, H. (2008), “A case study of optimal ambulance location problems”, paper presented at 7th ISORA: International Symposium on Operations Research and its Applications, Lijiang, China, 31 October – 3 November 2008.
ReVelle, C. S.; Hogan, K. (1989), “The maximum availability location problem”, Transportation Science, Vol. 23, pp. 192-200. Schilling, D. A. et al. (1979), “The TEAM/FLEET models for simultaneous facility and equipment sitting”, Transportation Science, Vol. 13, pp. 163-175.
Takeda, R. et al. (2004), “Aplicação do modelo Hipercubo de filas para avaliar a descentralização de ambulâncias em um sistema urbano de atendimento médico de urgência”, Pesquisa Operacional, Vol. 24, No. 1, pp. 39-71.
Toregas, C. R. et al. (1971), “The location of emergency service facilities”, Operations Research, Vol. 19, pp. 1363-1373.