$AV€𝛑 – Web System to Support the Teaching and Learning Process in Engineering Economics
José Donizetti de Lima1, Márcio Bennemann1, Luiz Fernando Puttow Southier1, Dayse Regina Batistus1, Gilson Adamczuk Oliveira1
1 Federal University of Technology - Paraná (UTFPR) – Campus Pato Branco
Abstract
Considering that the teaching and learning process of Engineering Economics (EE) has limitations regarding the tools used, this article aims at presenting a web system to assist in this process, with emphasis on the economic viability analysis of Investment Projects (IPs). This system, called $AV€𝛑, allows the evaluation of a variety of IPs, both of didactic and entrepreneurial nature, in addition to providing auxiliary tools for autonomous knowledge construction. In the text the modeling and development process of $AV€𝛑 and the main features of the system are detailed, highlighting it as an auxiliary tool for the learning process. The system test version was used by teachers, professionals, researchers and students of undergraduate and graduate courses at the Federal University of Technology – Paraná (UTFPR). The results obtained regarding the development process of the final product ($AV€𝛑) and the teaching were promising, revealing more comprehensive analysis on IPs by the academic students.
Keywords: Engineering Education; Project-Based Learning; Web-Based Technology; Economic Viability; Multi-Index Extended Methodology.
1. Introduction
The decision of investing should be categorized as complex in nature, because it includes several factors, including those of a personal decision-making nature (Souza et Clemente, 2009). There are several methods and techniques to support the decision to invest (Gonçalves et al., 2009; Bruni, 2013; Götze et al., 2015), which seek to analyze the economic viability of an Investment Project (IP). In this context, a common practice is to analyze the alternatives for investments of an organization through estimates of cash flows, discounted to the present moment (Zdanowicz, 2000). However, in general, such practice is weak because it uses few return and risk indicators, which can compromise the analysis quality.
Multi-Index Extended Methodology (MIEM) is one of the most recent ways to analyze the economic viability of an IP (Souza et Clemente, 2009; Rasoto et al., 2012; Lima et al., 2013; Lima et al., 2016; Lima et al., 2015; 2017). In the process of alternative investment selection, MIEM allows the use of consistent concepts, methods and techniques, enabling the analysis of various factors that guide investment decisions, which, according to Souza et Clemente (2009), is fundamental.
As the methods and techniques focused on the economic viability analysis of an IP involve the calculation of various economic and financial indicators and the development of graphics, making it difficult to compile information to support decision-making, the use of software in investment evaluation seems appropriate. However, the correct interpretation of these indicators will provide a better understanding of the economic merits of an IP (Souza et Clemente, 2009).
It is noticed, however, that in the teaching process of Engineering Economics (EE), specifically in the economic viability analysis of an IP, the time spent in the generation of indicators and graphs is excessive. This time could be directed to the interpretation of each criterion used to evaluate the economic merits of an IP, followed by a critical and pooled analysis of results.
In this sense, it is understood that the use of software for the implementation of tools to assist the achievement of results related to some Financial Mathematics elements, to Amortization Systems (PRICE system, Constant Amortization System – CAS and American Amortization System – AAS) and mainly related to the main analysis methods and techniques of the economic viability of an IP under the deterministic and stochastic approaches, which can help optimizing the teaching and learning process in EE. The software can display the compiled form of information, which would favor the analysis of the data and the implications of the various factors that guide the IP. This computational tool could also function as a learning environment, if, in parallel, support materials were developed in it with the technical description of the implemented methods, together with illustrative examples and case studies applied in industrial and agricultural projects, for example.
In this way, the emphasis on EE teaching would be centered in the analysis process of money value change along a time scale (Rasoto et al., 2012), since the operation would be through specific software (Souza et Clemente, 2009), which would present a friendly computing environment and would make the study of EE more stimulating. In addition, the use of software to evaluate investments can help increasing competitiveness in the process of decision making of IP proposing organization (Casarotto Filho et Kopittke, 2010).
In this context, the main objective of this paper is to describe the methodology used and the results obtained from the modeling and the development of the computational tool called System for Analysis of Economic Viability of Investment Projects ($AV€𝛑) and its application as a support to the teaching and learning process of EE. Besides this brief introduction, the structuring of the article has sections on theoretical framework, methodology, results and discussion, final considerations and appendix.
2. Theoretical Framework
2.1 Economic Analysis of Investment Projects
In Brazil, two types of investment analysis methods in real assets are highlighted. They are:
-
Non-analytical or non-exact methods, highlighting the simple Payback and Accounting Rate of Return (Souza et Clemente, 2005; Casarotto Filho et Kopittke, 2010; Dornelas et al., 2016). These methods have serious limitations, because they do not observe the value of money over time and should not be used. However, these criteria are still used as parameters for decision-making in investments by various companies. Furthermore, some authors still present them, even though they warn about their use limitations (Souza et Clemente, 2005; Casarotto Filho et Kopittke, 2010).
-
Analytical or exact methods. These methods observe the value of money along a time scale (Souza et Clemente, 2009; Rasoto et al., 2012; Lima et al., 2015). There are two currents: (i) defense that some indicators: Net Present Value (NPV), Internal Rate of Return (IRR) and Discounted Payback, in general, are sufficient to evaluate an IP from the economic perspective; and (ii) the defense of a Multi-Index Methodology (MIM) which seeks to base the decision-making process of investment issues considering expected return versus associated risks.
According to Souza et Clemente (2009), MIM supports the decision-making process regarding the acceptance or rejection of the project through various indicators, categorizing them in return and risks dimensions. The return, measured by Return on Investment Additional/Minimum Acceptable Rate of Return (ROIA/MARR) index can be understood as a degree of IP profitability. The main indicators of return are: Present Value (PV), Net Present Value (NPV), Annualized Net Present Value (ANPV), Benefit Cost Index (BCI) or Profitability Index (PI), Return on Investment Additional (ROIA), ROIA/MARR index and Return on Investment (ROI) or Modified Internal Rate of Return (MIRR) (Souza et Clemente, 2009; Rasoto et al., 2012; Lima et al., 2015).
The main risks indicators are: Internal Rate of Return (IRR), MARR/IRR index, Payback, Payback/N index, Degree of Revenue Commitment (DRC), Management Risk (MR) and Business Risk (BR), and Fisher’s Point for the case of more than one project. In addition, to assist in the decision-making process, Elasticity Limits (ELs) and Limit-Values (LVs) proposed by Lima et al. (2015; 2017) are used, which can be classified as a new dimension of MIEM. In Figure 1 it is possible to identify the dimensions of MIEM and their respective indicators.
Figure 1. MIEM Dimensions and indicators. Source: elaborated by the authors (2017).
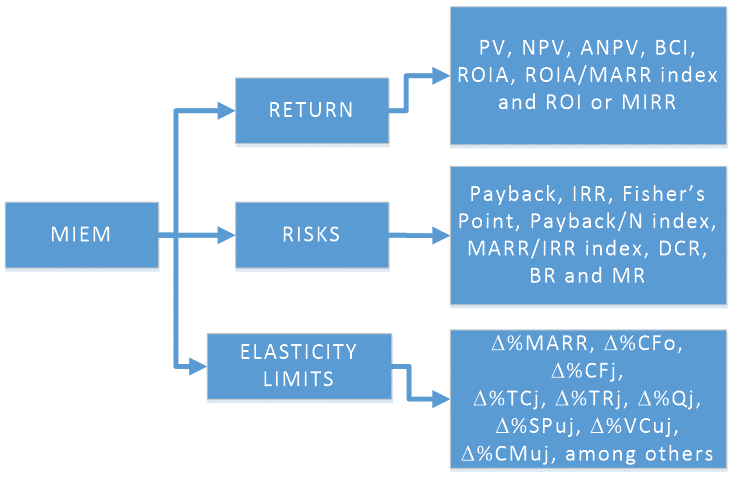
Where:  %: Percentage Variation; CF0: Cash Flow initial; CFj: Cash Flow for period j; TC: Total Costs; TR: Total Revenues; Q: Quantity sales; SPu: unit Sales Price; VCu: unit Variable Cost; CMu: unit Contribution Margin; Payback: return time. Other acronyms have already been presented in the text.
However, besides these methods resulting from designed and discounted cash flow, the literature highlights several techniques (Sensitivity Analysis, Scenario Analysis, Decision Trees and Monte Carlo Simulation, for example), approaches (deterministic or stochastic) and the use of the Real Options (RO) Theory to conduct a study of the economic viability of an IP (Dixit et Pindyck, 1994; Kodukula et Papudesu, 2006; Gonçalves et al., 2009; Macedo et Nardelli, 2011; Mun, 2010; Correia Neto, 2015).
The traditional theory of investment analysis in real assets, Discounted Cash Flow –Net Present Value, in general, has been criticized, since they have not grasped the value of managerial flexibility present in several projects (Rêgo et al., 2015). To overcome this limitation, the literature suggests the use of Real Options (RO) theory (Dixit et Pindyck, 1994; Kodukula et Papudesu, 2006).
2.2 Process of teaching and learning in the area of Engineering Economics
In this section, the theoretical framework underlying the prospect of working with $AV€𝛑 is presented, in view of the teaching and learning of Engineering Economics in relation to the analysis of investment projects (IPs).
The subject characteristics and curriculum guidelines for graduations in Engineering, according to the Resolution CNE / CES 11, 2002, led to the adoption of Project-Based Learning (PBL), with emphasis on case studies, aiming at understanding and solving real problems.
2.2.1 Project-Based Learning (PBL)
The teaching methodology based on projects has, among its main proponents, John Dewey and William Heard Kilpatrick. John Dewey proposed an education whose purpose was to provide students with the resolution to problems of their interest, by themselves. This proposal was due to his views on education: "Education is life, not preparation for life" (Dewey, 1967, p. 37).
Supported in Dewey's conceptions, Kilpatrick established a methodological referral for teaching with projects focused on oriented self-activity. Involving the applied learning, he aimed at developing creativity, judgment and initiative power on the part of students for understanding that: "A generation can no longer impose to the following generation solutions it has found to its problems" (Kilpatrick, 1967, p. 61).
For these authors, student’s involvement in projects requires research, data logging, hypothesis formulation, decision-making and problem solving, that is, a teaching methodology that places students as protagonists of their own knowledge. As the teacher, they are responsible for managing the process, coordinating the expertise of their qualified area with the project needs.
According to Hernandez et Ventura (1998) and Fonseca et al. (2004), the intense participation of students in the project, by assuming responsibilities, enables the development of skills in the articulation of knowledge, in addition to promoting the attainment of autonomy and critical thinking, basic elements for academic qualification.
It is therefore a challenge that, nowadays, incorporates a technological scenario other than that in which the methodological foundations of teaching with projects were designed. Presently available digital technologies have the potential to develop different research scenarios, which are very useful for project development.
2.2.2 The Use of Information and Communication Technologies in PBL
The use of Information and Communication Technologies (ICTs) in education has been the focus of many studies. Specifically, for mathematical content, which is the foundation that allows investigations on IPs, as proposed in this article, researchers such as Borba et Villarreal (2005), Allevato et al. (2010) and Fernández (2010) among others, have identified the potential of digital technologies in regard to the change of focus concerning the content itself.
When permeating the teaching activity with measures supported by ICTs, the collective "Humans-with-media" (Borba et Villarreal, 2005) uses reasoning mechanisms that are different from those in which digital media is not present. This differentiation opens the way to explore new aspects of the problems under study.
Probabilistic models and numerical methods, for example, can be programmed without requiring extensive calculations. In this change of perspective, the attention was focused on the meaning of the process to understand the concepts underlying the algorithms, as these will later be deployed in an automated fashion.
Another factor favored by the use of ICTs is the multiple representations. When there are different sources, such as graphics, numeric tables, conceptual maps and diagrams, thoughts are organized differently from when they are connected to only one source. The "reorganization of thought" (Tikhomirov, 1981) occurs, favoring the emergence of different reasoning according to different learning styles.
Considering the potential of ICTs and the assumptions of project-based learning, the following didactic structure, which is adopted when proposing the $AV€𝛑 as a tool to support the process of teaching and learning EE topics, is presented.
2.2.3 $AV€𝛑 as a teaching resource
The need to produce an educational resource that facilitates the study of IPs during Engineering Economics classes is noted both in undergraduate and graduate courses (lato and stricto sensu). Using resources such as spreadsheets, it was noticed as empirical knowledge that students avoided the application of more difficult analysis methods to their projects, that is, methods that demanded greater effort in terms of spreadsheet programming, such as, for example, the Monte Carlo Simulation or Real Options.
This position eventually affected the analyses because they were restricted, in general, to the use of deterministic approach. In this context, a program had to be designed to enable the calculations in a didactic sequence to allow the resumption and analysis of the concepts, assumptions and calculations that guide the definition of each indicator.
With the first version of $AV€𝛑 in 2015, we began to use the system in a phase of the discipline in which we prime the analysis of real-world case studies obtained in the literature or that was developed by students from prior semesters. It is worth noting that the software was introduced after the students programmed the resolutions in spreadsheets, exploring the conceptual part of both the indicators and the economic, mathematical and statistical contributions. Concomitant to case studies, students are guided in the development of individual projects as well as in the use of the system to remake case studies, emphasizing the analysis of different indicators that the program offers.
In the final stage of the course, the students write articles which present their projects with a case study chosen by them and analyzed according to the indicators they deemed appropriate. These works are presented in seminars of the discipline, enabling the whole class to become aware of the studies.
3. Methodology
Regarding the nature of this research, it can be classified as Applied Research, because it seeks to generate knowledge for immediate application. As for the procedures, this work can be classified as Action-Research (Turrioni et Mello, 2012).
For the development of $AV€𝛑 the action-research method was used. This method is the implementation of an action by people or groups involved in the problem under observation and in problem setting through the active participation of the researcher in the studied reality (Thiollent, 2007; Van de Ven, 2007). It was chosen to allow the development of the system and adjustment through the practical evaluation of potential users, which, in this case, are teachers, professionals, researchers and academics from undergraduate and graduate courses (lato and stricto sensu). To achieve this goal, the methodological steps of action-research proposed by Mello et al. (2012) were followed, which can be observed in Figure 2.
Figure 2. Action Research methodological steps. Source: elaborated by the authors (2017).
The following activities are developed in detail:
-
Definition of the theoretical and conceptual framework: this step is the literature review and theoretical construction of what would be implemented in the $AV€𝛑;
- Theoretical background: Dixit et Pindyck (1994), Kodukula et Papudesu (2006), Souza et Clemente (2009), Correia Neto (2009), Gonçalves et al. (2009), Mun (2010), Casarotto Filho et Kopittke (2010), Rasoto et al. (2012), Lima et al. (2013), Lima et al. (2015); Lima et al. (2016), Ferro et al. (2016), and Lima et al. (2017) were used as the basis for the definition of indicators to be incorporated into the system. These authors propose that the indicators are categorized in the dimensions: return, risks, Elasticity Limits (ELs) and Limit-Values (LVs). In all submodules, the Newton-Raphson's method (Franco, 2006) was used to calculate the Internal Rate of Return (IRR) and Fisher's.
-
Selection of analysis units: the practical cases for the functionality analysis of the software were chosen for convenience. Examples of several textbooks and practical case studies of industrial and agricultural projects were used;
-
Data collection: the data collection in the action-research was conducted directly by completing the system fields, i.e., the input served as the study protocol;
-
Data analysis: data analysis was performed by means of the results obtained from the application of the system and the evaluation of the users’ perceptions in developing their studies of interest in agricultural and industrial areas. As a result, features that need to be adjusted were identified, which, when deemed appropriate, were implemented in sequence;
-
Implementation: the actions consisted of a system tuning and the new application and evaluation of changed features; and
-
Evaluating results: The results obtained were also contrasted with proposals in the literature, through a discussion.
Besides being an educational tool, it is expected that the system will also support decision-making in real IPs in industrial and agricultural areas. Figure 3 presents the methodology used to develop the $AV€𝛑.
Figure 3. Model of methodology used to develop the system. Source: elaborated by the authors (2017).

For the project development, the first approach was the requirement gathering. The requirements of a system are the descriptions of what a system should do – services it should provide and restrictions and characteristics of its operation (Sommerville, 2012).
The general problem presented was the development of a Web System for computational implementation of Economic Viability Analysis of Investment Projects ($AV€𝛑). Thus, among the main requirements of the system are:
-
Presentation of stylized and dynamic charts. These resources are automatically generated on the basis of input data;
-
Mathematical support for the execution and calculation of functions, as well as the possibility of implementing numerical methods such as Newton-Raphson's; and
-
Easy distribution and accessible to many different devices.
Choice of programming language and features: With the general problem presented, some programming languages, which could implement the solution quickly and effectively and comply with the proposed requirements, were studied. The programming languages Java and C++ were analyzed considering a desktop and offline implementation; however, they were put away, because they require the system’s updates to be realized by the users, and also some features required a high computational effort that would be done by user’s devices. Therefore, web development was selected through PHP programming language, because the updates are easily done by the development staff and the computational resources that are required are made available by a server and not by users. More details are presented in section 4.1.
Implementation Approach: Faced with the proposed problem and the chosen programming language, the next step was to choose the best programming paradigm for the project scope. We chose the interactive and incremental development model in which, at the end of each module, the subsequent module is planned by changing and correcting characteristics to best serve the end-user (Pressman, 2001).
Validation and testing: System testing is a critical element of software quality and represents confirmation that the specifications are correct (Pressman, 2001). For the validation of modules and submodules, and possible error correction, classic examples available in Engineering Economics literature were used.
Figure 4 highlights the main stages of development of modules and submodules in the $AV€𝛑. Figure 4 highlights the main stages of development of modules and submodules in the $AV€𝛑. The module’s features and objectives analysis were always followed by its implementation on the presented programming language. After being implemented, the modules were tested and validated by the developers and, in case of unexpected results, they returned to the implementation stage. The modules that had satisfactory behavior were released online for validation and testing by students, teachers and other users. If the modules’ behavior presented the need of correction, they were submitted again to the implementation stage.
Figure 4. Development stages of $AV€𝛑 modules. Source: elaborated by the authors (2017).
4. Results and Discussion
4.1 Choice of programming language features and implementation approach
Faced with the problem presented, the computational approach was analyzed through a web application or a JAVA® desktop application. It was decided that a Web application fits better in the research project’s scope because of the following advantages:
-
Web applications have high portability, being accessed from different operating systems, as well as different devices such as desktop computers, laptops, netbooks, ultrabooks, tablets and smartphones.
-
It has a wide range of features that can be incorporated into the project, such as the plotting of charts, advanced mathematical features and ease of use of media, such as images, videos and animations.
-
Being a web processing system, it does not require a virtual machine installation, or any other program for its full implementation, aside from a web browser. Therefore, it requires less memory, and it is processed in less time than a typical desktop application.
Although the advantages are evident, the system has the disadvantage of requiring Internet access to run, as well as hosting on a Web server and the registration of a domain for access. $AV€𝛑 is hosted on the server of UTFPR - Pato Branco Campus and can be freely accessed at: http://pb.utfpr.edu.br/savepi/EN/cadastrar.php.
Among the Web development options, HTML5 was chosen as a user language, grouped with JavaScript and CSS resources. PHP was chosen for server-side language and MySQL database. These languages were chosen for ease of use of these technologies to quickly create dynamic elements on websites. MySQL is an easy to use, fast and robust system, and offers all the features that a website needs. When PHP, MySQL, JavaScript and CSS are combined, one has the necessary items to build dynamic and interactive websites (Nixon, 2012). For the generation of charts, Google Display resource pack was used, available on Google Developers (2016).
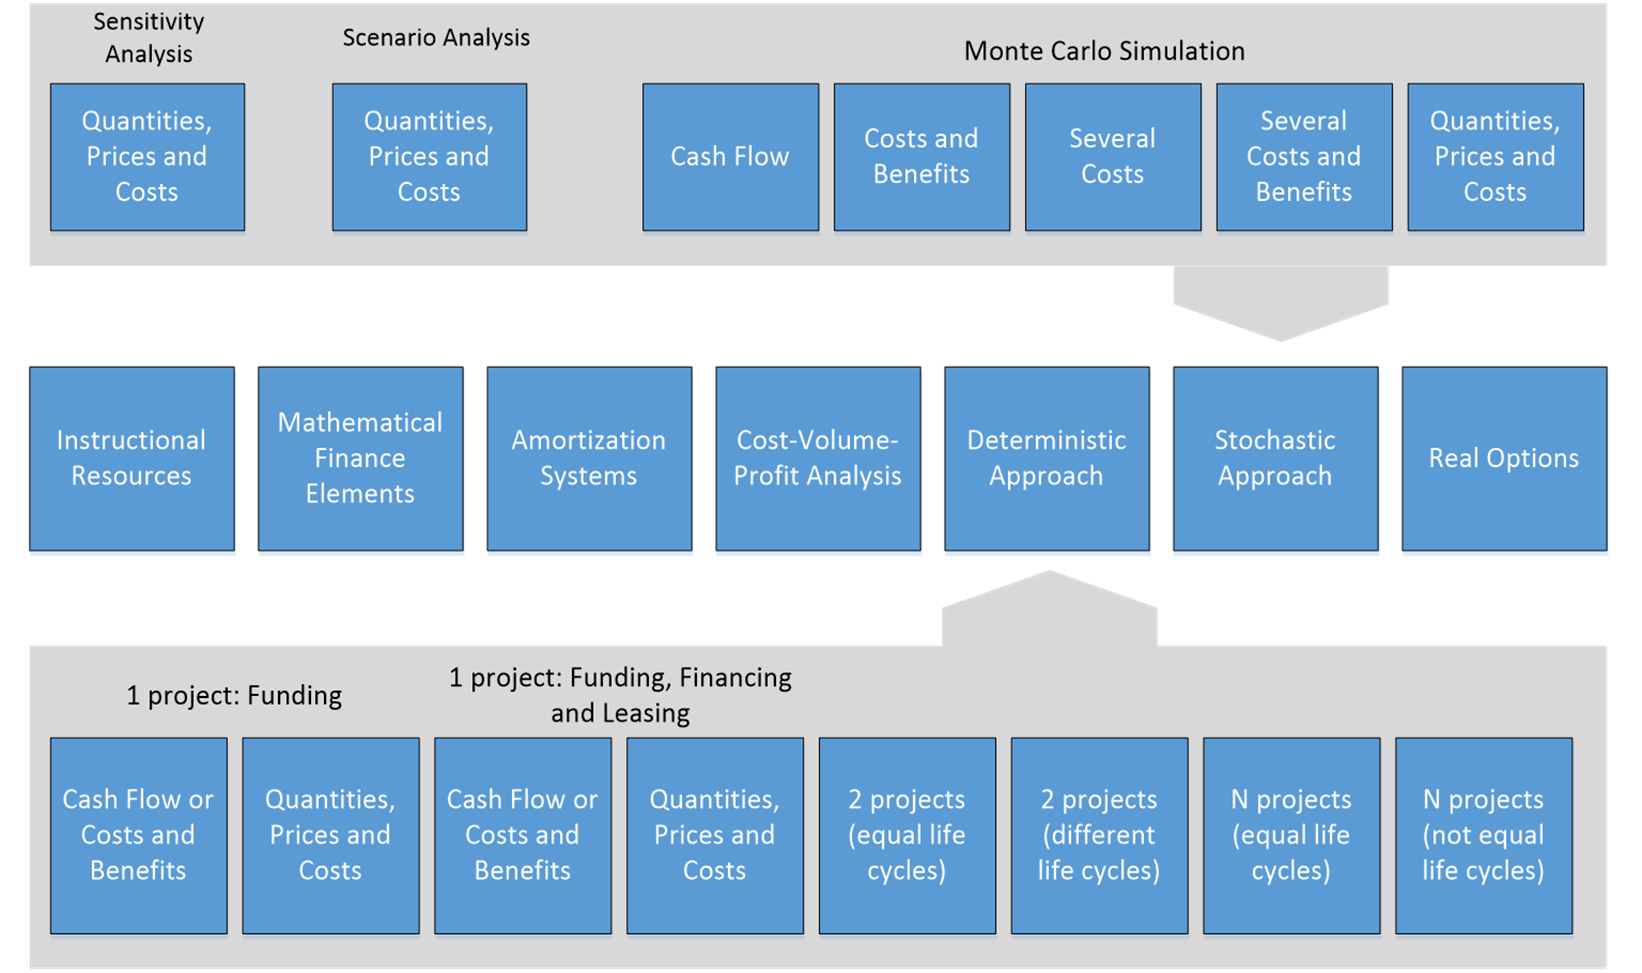
The process chosen for the development of the project was the interactive and incremental development model addressed through modules in which, at each stage, a project module was studied, implemented (and its respective submodules when necessary), tested, corrected and released. Figure 5 shows the seven proposed modules and the respective submodules of deterministic and stochastic approaches. In the following sections and appendices, each module and submodule are detailed.
Figure 5. System Structural Project $AV€𝛑 divided into modules and submodules. Source: elaborated by the authors (2017).
4.2 Presentation of modules and submodules of $AV€𝛑
The methods and techniques for the analysis of the economic viability of an IP are varied. According to Gonçalves et al. (2009), Bruni (2013), and Götze et al. (2015), the process of investment analysis can be conducted with the aid of various techniques. In this sense, $AV€𝛑 was developed in the format of modules and submodules. On the home page, the system displays options of different modules that can be used. Figure 6 illustrates the $AV€𝛑 main interface, that is, modules offered to the user.
Figure 6. Main Interface of $AV€𝛑 system. Source: Screen capture of $AV€𝛑.
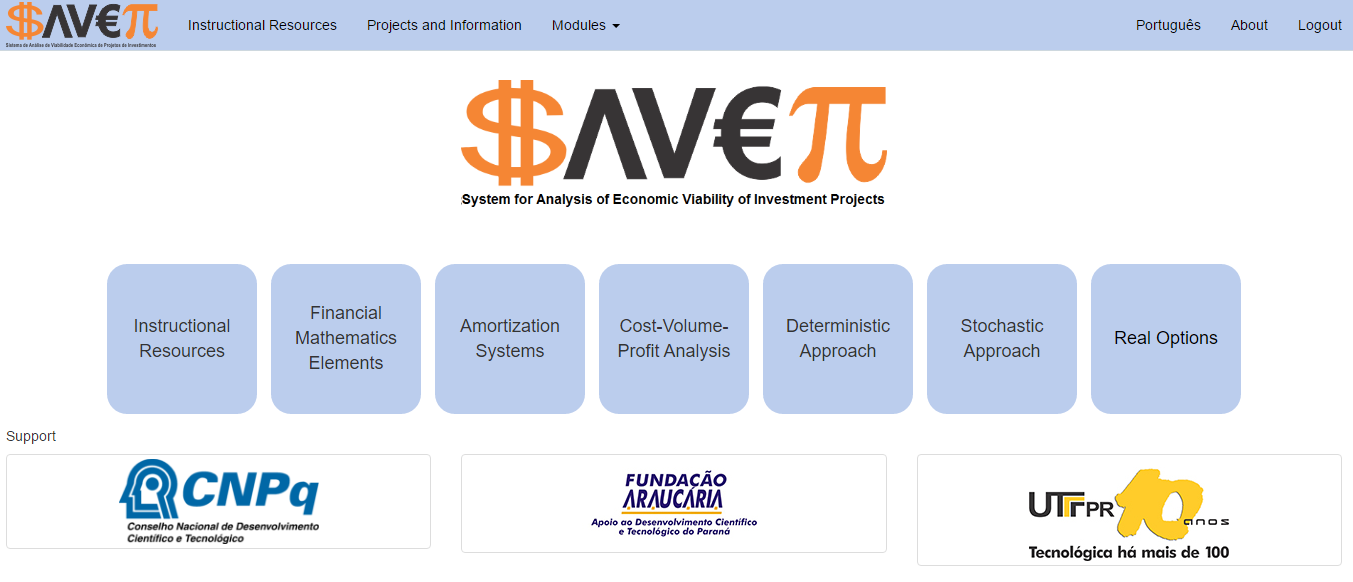
The modular structure facilitates the generation of appropriate information, i.e., according to the needs of each user. Thus, when organizing $AV€𝛑 in modular format we seek to respect the user's knowledge level and degree of maturity of the IP proponent organization, offering to the user the choice of modules according to their needs.
The first module, called "Instructional Resources", whose objective is to provide information on economic engineering, contains a number of publications, such as online books, class notes, conference articles, seminars and national and international journals, as well as illustrative examples and case studies of investment projects developed in $AV€𝛑. Thus, this module functions as a kind of library, which will be continuously updated. Other modules and submodules are presented and illustrated in Appendix A.
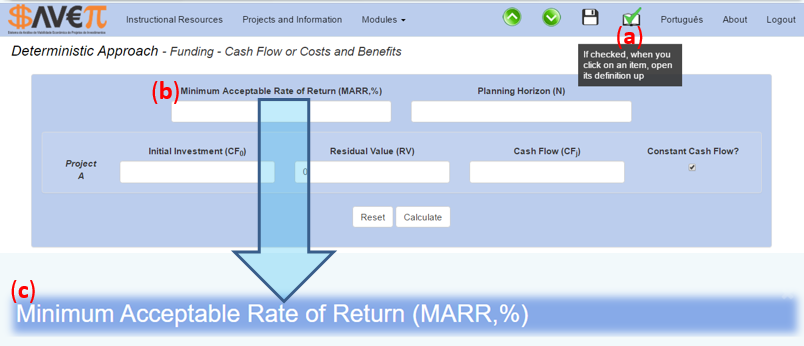
In each submodule, the initial interface requests the user to fill out the fields according to the main module and the chosen submodule. At any time, one may ask for support from the system. For this purpose, it is necessary to activate the button with the icon of an open book (a) and click on the parameter for which you want information (b). For the selected option, a quick conceptual review, the mathematical model and its parameters are offered, in addition to the appropriate way to identify or determine them (c). Figure 7 shows an illustrative example of this description.
Figure 7. An Input example of one of the submodules. Source: Screen capture of $AV€𝛑.
According to Bruni (2013), one of the most crucial parts of evaluating any investment is the analysis of the inherent risks and their effect on wealth and decision generation parameters. In this sense, dozens of indexes were incorporated in all the submodules of deterministic and stochastic approaches, called Elasticity-Limits (ELs) and Limit-Values (LVs), which are extensions of proposals by Lima et al. (2015; 2017). In Figure 8 it is possible to observe an illustrative example of the graphic result for some ELs. Due to the question of scope and space and to an adequate interpretation of the indicators that appear in Figure 8, we suggest the works of Lima et al. (2015, 2017).
Figure 8. Example of graphical representation of an IP ELs. Source: Screen capture of $AV€𝛑.
4.3 $AV€𝛑 in the teaching and learning process
In this section we describe the experience of using $AV€𝛑 as support for the teaching and learning process in the investment project analysis in real assets. The computational tool was used in the Federal University of Technology – Paraná (UTFPR) – Pato Branco Campus with undergraduate and graduate students.
The undergraduate students are from Agronomy and Mechanical Engineering courses. The lato sensu graduate students are from Production Engineering and Accounting courses. In addition, the system was also used by the master’s students of the Graduation Program in Production and Systems Engineering (PPGEPS) of UTFPR. In undergraduate and graduate lato sensu courses, the use of this system has been occurring in both Investment Analysis and Economic Management subjects (60 and 30 hours respectively). In the master’s course, the tool is used in the subject of Engineering Economics (60 hours). In total, it is estimated that, at least, 250 students have used the system in 2015 and 2016.
As noted in section 2.2.3, the used teaching strategy consists in the academic student choosing a project, which should be developed during the semester under the guidance of the subject’s teacher and if necessary, co-supervised by an expert in the area of study. Subsequently, the results should be reported to the class and argumentative text should be prepared in the form of a scientific article, following a template provided by the teacher. It is worth noting that the presentation of the difficulties is stimulated for the practical application of the developed theoretical concepts and how these were overcome.
The exception occurs in the Accounting Management lato sensu graduate course in which $AV€𝛑 is used in a different way. Lists of exercises in which users become familiar with the program modules are presented. The subject’s final work consists in the presentation of students' company cases, in which they should use the system to make the investment analysis.
When generating all the viability indicators and graphics needed, $AV€𝛑 contributes to greater dedication to the steps of interpretation, analysis and issuance of the conclusive opinion on the economic merit of the IP under study. That was clear in the academic students' most common reports reproduced below: "$AV€𝛑 is a simple and self-explanatory system"; "there is more time to do what I think is more important: to do the analysis of the data generated by the system and making the decision on the implementation of the IP studied"; "the use of spreadsheets spent unnecessary efforts and, mainly, limited time, which were directed to the concept fixation and for the application in a case study in my area of knowledge".
In the professor's report there was a substantial improvement in terms of the quality of the analyses presented by academics, who previously avoided using the stochastic approach through MCS due to difficulties in electronic spreadsheets handling and/or programming. Moreover, during the reporting of the presentations it was clear that the students had greater mastery of the concepts with a view to the dedication of more time for the interpretation of the indicators and the possibility to review concepts at any time, whenever necessary. In a professor's report "... the creation of the web system to support the teaching of EE seeks to contribute to the learning of the contents of this discipline, showing up as a complement to traditional expository approach".
In addition to the improved quality and the in depth analysis, the proposed computational tool optimizes the professors’ and students' time. Professors can add more case studies and discussion to the analysis with academics. Academics are encouraged to choose, among all the generated indicators, a subgroup of indicators to base their reports on for the company managers of the analyzed projects. The reality of each company is considered and the same set of indicators may represent a favorable opinion or not. Thus, the critical sense is stimulated and the time that was once lost in repetitive tasks in spreadsheets now is better used. Spreadsheets are still used in the early stages, in which users consolidate the traditional relations of financial mathematics, amortization systems and some viability indicators.
It is worth noting that the teaching methodology was used in the subjects in which the students should develop case studies in their field of study, that is, IP evaluation. In this context, the use in real situations led to the incorporation of new features to meet the diversity of potential user needs. Therefore, updates and/or improvements were constant, using the limitations mainly perceived in the implementation of case studies, which always have peculiarities/specificities. Thus, there is the importance of experience of use and meeting the users' needs for system improvement. Case studies conducted by academics, for example, began to incorporate the stochastic approach through MCS by the need to improve the perception of risk.
In summary, $AV€𝛑 covers the most common methods for the economic evaluation of IPs. It also offers three useful tools available for analyzing and understanding the risks in the project: sensitivity analysis, scenarios analysis, and Monte Carlo Simulation. The system, divided into modules, allows the evaluation of many kinds of IPs, considering their specificities and offering a didactic focus on the assessment process. Teachers, professionals, researchers, and graduate and undergraduate students have been testing the system, obtaining promising results. After starting to use $V€𝛑 academics and teachers have been publishing articles in congresses, as well as submissions in qualified journals in Engineering III, Business Administration and Accounting areas. In addition, the system has been used by academics to conduct economic feasibility studies as part of Completion of Course Work (CCW) in Engineering and Agronomy.
5. Final considerations
Learning to learn is the main challenge of education (Duarte, 2000). In this sense, the development of tools that help in this process is an important task for teachers and academic students. Thus, in this work, $AV€𝛑 was presented to support the process of teaching and learning on Engineering Economics topics and related areas. Besides being an educational tool, the system can support decision making in real-world IPs, in industrial and agricultural areas.
The results were promising regarding both the process of modeling and development of the final product ($AV€𝛑) and for the teaching and learning process. In addition, the tool has been speeding up and qualifying the academics and teachers' submissions in congresses and qualified journals. This system proved to be an important educational tool as a support tool for teaching Engineering Economics, favoring the use of multiple representations in the analysis of investment projects under different approaches.
The educational perspective adopted was teaching with projects; however, we understand that different approaches are possible, as illustrated in section 4.3. $AV€𝛑 may become a computational tool via web to provide support to the process of decision-making in IPs due to its ease of use and utilization of various indicators and charts.
In the perspective of future work, $AV€𝛑 will be continuously reviewed and/or modified and/or expanded and/or improved, seeking to meet the largest possible number of users and be up to date with the advances in this area of knowledge. A future work consists in converting the $AV€𝛑 to a virtual environment to support the teaching and learning process on the main topics of Engineering Economics. To that end, a database is being developed with the definitions and explanations of the various terms of the Financial Mathematics and Engineering Economics areas in the system, so the user can study and/or recall the lessons previously learned without much difficulty.
In the future, we will also develop educational videos, which should explain the operation of all modules. In addition, the system should generate standard reports to help users in the interpretation and analysis of the results found for the studied IP.
Despite being a consistent and widely used methodology, the multi-index approach does not allow the insertion of managerial flexibility such as abandoning, expanding, contracting, or postponing the starting of an IP (Kodukula et Papudesu, 2006). For this, it is necessary to use the Real Options (RO) theory to allow such flexibilities (Dixit et Pindyck, 1994; Mun, 2010). The model of RO should be used to complement the traditional analysis of Discounted Cash Flow - DCF (Macedo et Nardelli, 2011). In this sense, as provided for in the project, a module for RO will be developed in the future.
References
Allevato, N. S. G. et al. (2010), “O computador no ensino e na aprendizagem de matemática: reflexões sob a perspectiva da resolução de problemas”, In: Jahn, A. P.; Allevato, N. S. G. (Org.), Tecnologias e educação matemática, SBEM, Recife.
Borba, M.; Villarreal, M. E. (2005), Humans-with-media and the reorganization of mathematical thinking, Springer, New York. Bruni, A. L. (2013), Avaliação de investimentos, Série Finanças na Prática, Atlas, São Paulo.
Casarotto Filho, N. C.; Kopittke, B. H. (2010), Análise de investimentos: Matemática financeira, Engenharia econômica, Tomada de decisão, Estratégia empresarial, Atlas, São Paulo.
Conselho Nacional de Educação - CNE (2002), Câmara de Educação Superior, Resolução CNE/CES 11/2002, Diário Oficial da União, Brasília, 9 abr. 2002.
Correia Neto, J. F. (2009), Elaboração e avaliação de projetos de investimento, Campus, São Paulo.
Correia Neto, J. F. (2015), Excel para profissionais de finanças, Elsevier, Rio de Janeiro.
Dewey, J. (1967), Vida e educação, Melhoramentos, São Paulo.
Dixit, A. K.; Pindyck, R. S. (1994), Investment under uncertainty, Princeton University Press, Princeton.
Dornelas, J. et al. (2016), Plano de Negócios com o Modelo Canvas: Guia prático de avaliação de ideias de negócios a partir de exemplo, LTC, Rio de Janeiro.
Duarte, N. (2000), Vigotski e o “aprender a aprender”: crítica às apropriações neoliberais e pós-modernas da teoria vigotskiana, Autores Associados, Campinas, SP.
Fernández, C. V. (2010), “Conocer reflexivo, conocer tecnológico Y matemático: la alfabetización matemática em los recintos universitarios”, TEACS – Revista Científica Teorías, Enfoques y Aplicaciones em las Ciencias Sociales, Vol. 2, No. 4.
Ferro, W. A. et al. (2016), “Viabilidade econômica da aquisição de uma linha de pintura associada ao tratamento de superfície de metais com tecnologia nanocerâmica”, Espacios (Caracas), Vol. 37, No. 26, pp. 19-32.
Fonseca, N. A. et al. (2004), Os projetos de trabalho e suas possibilidades na aprendizagem significativa, Revista Educação e Tecnologia, CEFET-MG, Vol. 9, No. 1.
Franco, N. B. (2006), Cálculo numérico, Pearson Prentice Hall, São Paulo.
Gonçalves, A. et al. (2009), “Análise de investimentos: Custo de capital, risco e decisões financeiras”, In: Gonçalves, A. et al., Engenharia Econômica e Finanças, Elsevier. Rio de Janeiro.
Google Developers (2016), Charts, available from: https://developers.google.com/chart/ (Access: 20 Nov 2017)
Götze, U. et al. (2015), Investment Appraisal: Methods and Models, Springer-Verlag Berlin Heidelberg, New York. Texts in Business and Economics.
Hernandez, F.; Ventura, M. (1998), A organização do Currículo por projetos de trabalho: o conhecimento é um caleidoscópio, Artes Médicas, Porto Alegre.
Kilpatrick, W. H. (1967), Educação para uma civilização em mudança, Melhoramentos, São Paulo.
Kodukula, P.; Papudesu, C. (2006), Project Valuation Using Real Options: A Practitioner's Guide, J. Ross Publishing, Florida, USA.
Lima, J. D. et al. (2013), “Propostas de ajuste no cálculo do payback de projetos de investimentos financiados”, Custos e Agronegócios Online, Vol. 9, No. 4, pp. 162-180, disponível em: http://www.custoseagronegocioonline.com.br/numero4v9/calculo%20payback.pdf (Acesso em: 25 nov. 2017).
Lima, J. D. et al. (2015), “A systematic approach for the analysis of the economic viability of investment projects”, International Journal Engineering Management and Economics, Vol. 5, No. 1, pp. 19-34, available from http://dx.doi.org/10.1504/IJEME.2015.069887 (Access: 25 Nov 2017).
Lima, J. D. et al. (2016), “Estudo de viabilidade econômica da expansão e automatização do setor de embalagem em agroindústria avícola”, Custos e Agronegócios Online, Vol. 12, No. 1, pp. 89-112, disponível em: http://www.custoseagronegocioonline.com.br/numero1v12/OK%206%20automatizacao.pdf. (Acesso em: 25 nov. 2017).
Lima, J. D. et al. (2017), “Systematic Analysis of Economic Viability with Stochastic Approach: A Proposal for Investment”, In: Amorim, M. et al. (Eds.), Engineering Systems and Networks: The Way Ahead for Industrial Engineering and Operations Management, Lecture Notes in Management and Industrial Engineering, Springer International Publishing, Switzerland, Vol. 10, pp. 317-325, available from: http://dx.doi.org/10.1007/978-3-319-45748-2 (Access: 25 Nov 2017).
Macedo, M. A. S.; Nardelli, P. M. (2011), “Teoria de opções reais e viabilidade econômico-financeira de projetos agroindustriais: o caso da opção de abandono”, Organizações Rurais & Agroindustriais, Vol. 13, No. 1, pp. 109-123, available from: http://ageconsearch.umn.edu/bitstream/133913/2/8%20Artigo%2009.514.pdf (Access: 25 Nov 2017).
Mello, C. H. P. et al. (2012), “Pesquisa-ação na engenharia de produção: Proposta de estruturação para sua condução”, Produção, Vol. 22, No. 1, pp. 1-13.
Mun, J. (2010), Modeling Risk: Applying Monte Carlo Risk Simulation, Strategic Real Options, Stochastic Forecasting and Portfolio Optimization, John Wiley & Sons, New York.
Nixon, R. (2012), Learning PHP, MySQL, JavaScript and CSS, O’Reilly Media, Califórnia.
Pressman, R. S. (2001), Software engineering. A practitioner’s approach: McGraw-Hill, New York.
Rasoto, A. et al. (2012), Gestão financeira: Enfoque em inovação, Aymará, Curitiba.
Rêgo, T. F. et al. (2015), “Expectativas de retorno e riscos percebidos no agronegócio corante natural de caju para o mercado B2B”, Custos e Agronegócios Online, Vol. 11, No. 2, pp. 162-180, available from: http://www.custoseagronegocioonline.com.br/numero2v11/K%2018%20caju.pdf (Access: 25 Nov 2017).
$AV€𝛑 (2017), Sistema de análise da viabilidade econômica de projetos de investimento. Available in http://pb.utfpr.edu.br/savepi/
Sommerville, I. (2012), Software engineering, Pearson, São Paulo.
Souza, A.; Clemente, A. (2005), Decisões financeiras e análises de investimentos: Conceitos, técnicas e aplicações, Atlas, São Paulo.
Souza, A.; Clemente, A. (2007), Gestão de Custos: aplicações operacionais e estratégicas, Atlas, São Paulo.
Souza, A.; Clemente, A. (2009), Decisões financeiras e análises de investimentos: Conceitos, técnicas e aplicações, Atlas, São Paulo.
Thiollent, M. (2007), Metodologia de pesquisa-ação, Cortez, São Paulo.
Tikhomirov, O. K. (1981), “The Psychological consequences of computerization”, In: Wertsch, J. V. (Ed.), The concept of activity in soviet psychology, M. E. Sharpe, New York.
Turrioni, J. B., Mello, C. H. P. (2012), “Pesquisa-ação na Engenharia de Produção”, In: Cauchick Miguel, P. A. (org.), Metodologia de Pesquisa em Engenharia de Produção e Gestão de Operações, Elsevier, Rio de Janeiro.
Van de Ven, A. H. (2007), Engaged scholarship: a guide for organizational and social research, Oxford, New York.
Zdanowicz, J. E. (2000), Fluxo de caixa: Uma decisão de planejamento e controle financeiro, Sagra Luzzatto, Ponto Alegre.
APPENDIX A - MODULES AND SUBMODULES OF $AV€𝛑
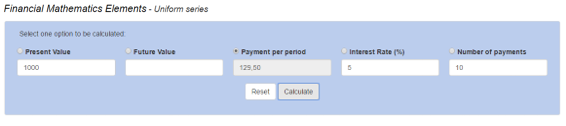
- Module "Elements of Financial Mathematics"
This module allows the user to calculate: Interest rates (i), Present value (PV), Future Value (FV), number of periods (N) and Cash Flow constant (CF), based on entries required for each of the items shown in Figure 1. The user selects one of the five options that he/she wants to calculate and, among the possible remaining entries, enters the information related to three of them, necessary for the selected option. The result is displayed in the text box next to the selected option as can be observed in the example shown in Figure 1.
Figure 1. Interface with example "Elements of Financial Mathematics" submodule – uniform series. Source: Screen capture of $AV€𝛑.
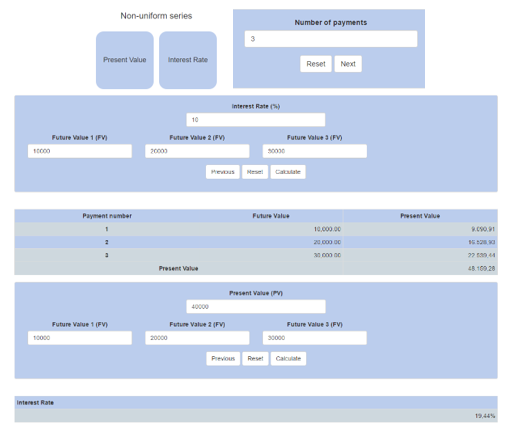
For the treatment of non-uniform series, there are two (2) submodules, which are illustrated in Figure 2. In this case, we used three (3) periods.
Figure 2. Interface with example "Elements of Financial Mathematics" submodule – non-uniform series. Source: Screen capture of $AV€𝛑.
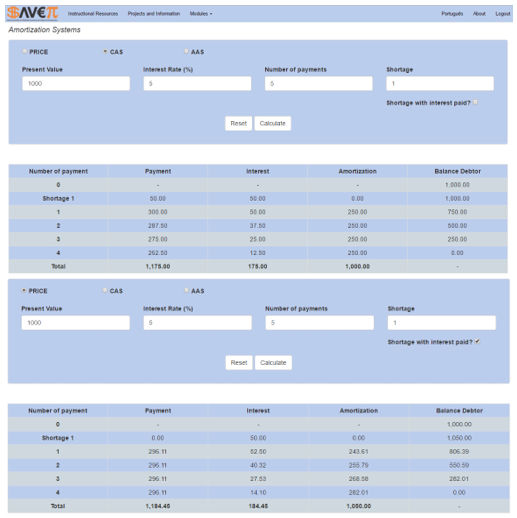
- "Amortization Systems" Module
This module allows the user to use an amortization system to check the figures in every period for due interest, installment/payment, amortization and debtor balance when a loan/financing is done. The user selects one of the available amortization systems (Price System, Constant Amortization System – CAS, or American Amortization System – AAS) and inserts the 4 inputs required, besides being able to incorporate a grace/shortage period with or without capitalization of the outstanding debtor balance due to the payment or not of interest generated during that period. In Figure 3 we can observe examples of using this module.
Figure 3. Interface with an example of "Amortization Systems" module. Source: Screen capture of $AV€𝛑.
- "Deterministic Approach" Module
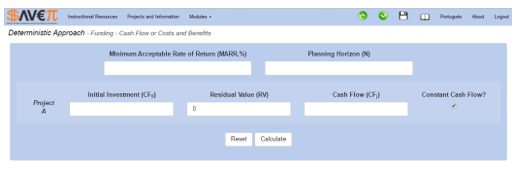
This module is divided into 8 (eight) submodules and presents the part of investment analysis for different types of projects through a deterministic approach. It provides the analysis of a project with the option of considering or not the effects of accounting depreciation, taxes and the project funding source, and makes a comparison between the project execution with Own Resources, Financing and Leasing. Cash flow, which may or may not be constant in such cases of a single project, can be supplied directly by specifying costs and revenues, or detailing the sales quantity, pricing, and fixed and variable costs. The remaining modules aim at the comparison between 2 or more projects not necessarily with the same planning horizon. In Figure 4 it is possible to observe an illustrative example of data input interface of the first submodule of the deterministic approach module.
Figure 4. Interface of one of "Deterministic Approach" submodules. Source: Screen capture of $AV€𝛑.
- "Stochastic Approach" Module
This module is divided into 7 (seven) submodules and allows the evaluation of investments via Sensitivity Analysis (SeA), Scenario Analysis (ScA) and Monte Carlo Simulation (MCS) for different types of investment projects.
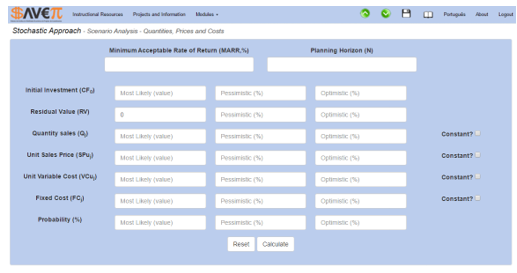
In the "Scenario Analysis" submodule, the traditional Scenario Analysis (ScA), which consists in contemplating 3 (three) scenarios, has been implemented, namely: (i) most likely; (ii) pessimistic; and (iii) optimistic (Correia Neto, 2009; Rasoto et al., 2012). However, MIEM was used to assess the economic viability of each scenario (Lima et al., 2015). Figure 5 shows the input screen of this submodule.
Figure 5. Initial Screen of "Scenario Analysis" submodule. Source: Screen capture of $AV€𝛑.
For Monte Carlo Simulation (MCS) submodules, several possibilities can be performed. For this, one should perform some steps, namely: Step 1: Select the stochastic variables and distribution of probabilities for each stochastic variable selected.
Step 2: Provide the parameters of each distribution of probabilities and choose the number of simulations to be performed.
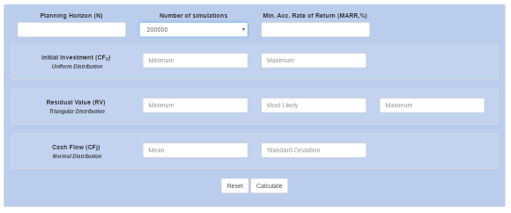
Figure 6 shows an illustrative example of carrying out the first step. After the selection, click next. Then, comes the screen shown in Figure 7, which calls for the provision of input parameters for each distribution and the selection of the number of simulations to be performed (1,000, 5,000, 10,000, 100,000 or 200,000). Fill it in and click again to Calculate. In the same submodule, we can use a Cash Flow (CF) that is not constant or provide the Total Cost estimates (TCj) and Total Revenues estimated (TRj) for each j period in the planning horizon (N).
Figure 6. Initial Screen of MCS submodule: Option - Cash Flow. Source: Screen capture of $AV€𝛑.
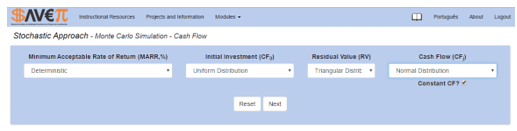
Figure 7. Secondary screen of MCS submodule: Option - Cash Flow. Source: Screen capture of $AV€𝛑.
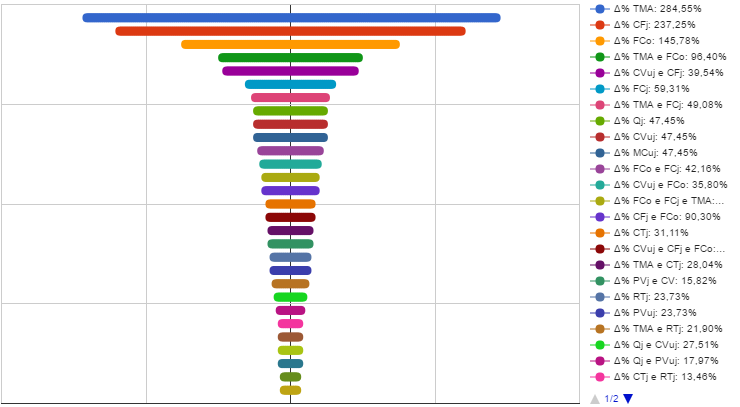
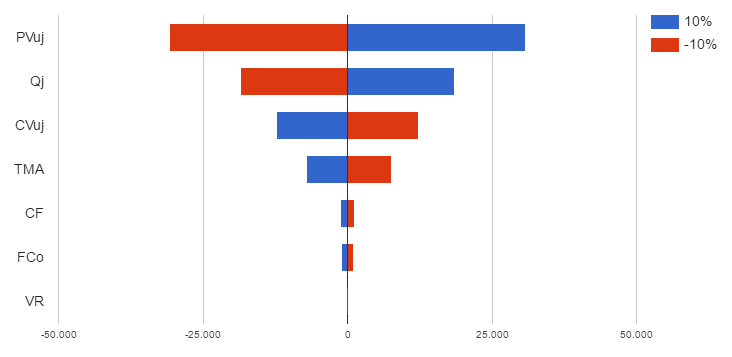
In the "Sensitivity Analysis" submodule, traditional sensitivity analysis was implemented for key parameters and their impact on NPV. In spite of the input interface being similar to some already presented, this submodule generates interesting results such as NPV sensitivity analysis through Tornado Diagram (Lima et al., 2015). An illustrative example is shown in Figure 8.
Figure 8. Example of NPV Sensitivity Analysis through Tornado Diagram. Source: Screen capture of $AV€𝛑.
- "Cost, Volume and Profit Analysis" Module
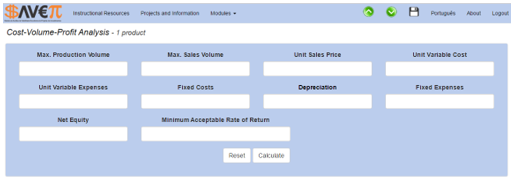
This module allows the user to calculate the Accounting, Economic and Operational break-even points, the sensitivity analysis for cost, volume and profit ratio, as well as various indicators based on the works of Souza & Clemente (2007), Rasoto et al. (2012) and Lima et al. (2015). It also allows the use of scenario analysis (Lima et al., 2015). In Figure 9 we can observe the data input interface for this module.
Figure 9. Initial Screen of ''Cost Volume and profit'' module. Source: Screen capture of $AV€𝛑.
In the future, there will be a module to address the Real Options (RO) theory and a submodule for Cost, Volume and Profit Analysis for the case of more than one product.
Finally, the system is completed with a module that offers teaching resources (eBooks, scientific and technical articles and lecture notes, for example) that have a theoretical and practical contribution for the other modules. Among the computational resources offered by the system, it includes the exporting of all the graphs and charts generated by the system into jpg image format, and the user has the option to export and import projects which are being analyzed, optimizing the data input process.