Evaluation and comparison of a lean production system by using SAE J4000 standard: a case study on the automotive industry in the state of Mexico
Lina María Tabares1
Manuel Robles-Cárdenas2
Francisco Pino Romainville3
1 Instituto Tecnológico y de Estudios Superiores de Monterrey, Mexico
2 Dpto. de Ingeniería Industrial y de Sistemas. Escuela de Ingeniería y arquitectura. Instituto Tecnológico y de Estudios Superiores de Monterrey, Mexico
3 Centro de Investigación en Mecatrónica Automotriz. Tecnológico de Monterrey (ITESM), Mexico
Abstract
Lean manufacturing (LM) is a management system focused on eliminating waste and activities that do not add value, with the aim of reducing costs and improving the quality and productivity of organizations. LM has been adopted in diverse industries and several countries due to its advantages in cost, flexibility and rapid response (Muslimen et al., 2013). The objective of this investigation is to analyze the implementation level to the Lean System via the SAE J4000 (SAE 1999a) standard carried out among companies of the State of Mexico automotive industry. In addition, this investigation shows the inferential and descriptive statistics data analysis of Mexican companies compared to the automotive industries in Spain and Brazil. Results show that the implementation level of the automotive industry is at 48.4% in the State of Mexico according to the SAE J4000 standard. Moreover, the involvement of suppliers and the use of lean tools in processes are higher in the State of Mexico compared to automotive industries in Spain and Brazil. However, previous studies ranked the State of Mexico at a lower level of LM in contrast with Spain and Brazil production lines.
Keywords: Lean Manufacturing Implementation; SAE J4000; Automotive Industry; Automaker-Supplier-Customer Relationship; Lean Implementation; Automotive Comparison.
1. Introduction
The Toyota Production System (TPS) is a rational manufacturing method that seeks to eliminate waste, with the aim of increasing productivity and quality in organizations (Monden, 1983). This system originated from Toyota's efforts to compete with the advanced nations of the West automotive industry after the end of World War II. In 1950 the General Director, Eiji Toyoda, was convinced that he had to introduce the mass production systems of Ford plants. Nevertheless, he realized that implementing Ford's mass production system would be very difficult for Japan's economic reality at that time, because this production system operated with a lot of muda (waste), from staff, space, time used, raw materials, over-processing and inventories (Vilana Arto, 2011).
As copying Ford's mass production system was not possible, Toyota had to think of another way to do it. For this reason and based on several fundamental principles, Taiichi Ohno has implemented a series of groups in order to find the best way to perform operations with their new way of visualizing the production system. These types of groups were the precursors of quality circles and Kaizen equipment (continuous improvement). These are an organizational element in which the participation of the employees allows contributing to the development of the company. On the other hand, Taiichi Ohno focuses on small batch production, developing a new system that coordinated the flow of parts and materials where each part or material could only be produced if the next production step demanded the part. This system is known as the Pull System. The key instrument developed by Ohno was the Kanban (information card), which represented the link of the entire new production system (Hosseini et al., 2015) (Ohno, 1988).
The main objective of TPS is to increase the production efficiency consistently and completely, eliminating waste (Shingo, 1989). According to Taiichi Ohno, all waste occurs when an attempt to produce the same products in large homogeneous quantities is made. For the Toyota Production System, the waste can be divided into seven types (Hosseini et al., 2015): transportation, inventories, movements, waiting, overproduction, overprocessing and defects. As a result, this increases the costs of the organization and supports the idea that it is cheaper to make one article at a time.
Gradually TPS became a great instrument of production and management, combining the advantages of small production batches, produce-to-order, continuous improvement of processes, quality, economies of scale in manufacturing and purchasing, generating a great dynamics of learning and growth (Vilana Arto, 2011).
TPS concept was first introduced to the western world in 1990, with the name of Lean Manufacturing (LM), after the publication of the book "The machine that changed the world" (Roos et al., 1990). Published by MIT teachers during the 1980’s, there was a great deal of interest in this system’s implementation across US companies, because of the significant growth of Japanese vehicles imports and the oil crisis of 1973 (Holweg, 2006).
Some researchers claim that, if organizations ignore LM strategies, they will not be able to compete with leading companies because of the high-quality requirements, low costs and short lead times that customers demand (Holweg, 2006). Currently, in Mexico, the TPS tools are mainly implemented by companies that manufacture products solely for US exports (Srinivasaraghavan et Allada, 2006), and not only automotive industry related, but also from different productive sectors.
The aim of the present investigation is to analyze the Lean System implementation level, according to the SAE J4000 standard (SAE 1999a) in the State of Mexico automotive industry companies. Data collection is carried out, organized, and analyzed to study the Mexican automotive industry. Comparisons are made with the Spanish and Brazilian automotive industries, using data from a previous investigation (Araújo et al. 2012). A comparison is made with similar annual production ranking such as Spain and Brazil – rank eighth and ninth respectively – to Mexico – rank seventh (Expansión, 2016).
2. Literature review
The Lean System focuses primarily on eliminating waste, improving system capacity, standardizing work, eliminating bottlenecks, and improving communications. All this with the aim of manufacturing products of the highest quality, fastest delivery, and lowest cost (Hosseini et al., 2015). It was called "Lean" because its system uses less of everything compared to mass production: half of the workforce in the factories, half the space for manufacturing, half the investment in tools and half the hours of engineering to develop a new product. In the same way, Lean Manufacturing System requires less plant and less inventory, thus allowing fewer defects and the production of a greater variety of products in small lots (The LeanMan, 2016).
Womack et Jones (1996) describe lean thinking as the pursuit of perfection and an antidote to Muda, that is, a systematic proposal for the search of activities that add value to the product by eliminating waste in all aspects of the organization's processes. In the same way, it proposes to differentiate the system from mass production and highlights the importance of people as a key piece of the model.
The fundamental idea of LM is to maintain the continuous flow of products in the factories, so that the organization can adapt flexibly to the changes of the demand. As a result, this system naturally reduces staff and stock surpluses, increasing productivity and reducing costs (Monden, 1983). By implementing the concepts of Just in Time and Jidoka, a continuous production flow is achieved, adapted to the variations in demand. Both concepts are the basic pillars of TPS. "Just in Time" (JIT), which means to produce only the necessary items, when they are needed and in the necessary quantity. For its part, "Jidoka" means automation with a human touch (Ohno, 1988). This should be interpreted as defect self-control and it supports the concept of production in a timely manner, by preventing the entry of defective units into the flow that would disrupt the following process (Monden, 1983).
Some analysts (Srinivasaraghavan et Allada, 2006) even pointed out that, if an organization ignores the LM strategy, the company would not stand a chance against the current leading companies due to the high requirements demanded by customers.
LM implementation has also shown to improve quality and productivity in the automotive industry (Muslimen et al., 2013); therefore, several methodologies have been developed to analyze it. Researchers can determine the implementation level and carry out classifications by taking into account specific criteria. For example, Panizzolo (1998) classified Italian companies into three categories: flexible, network and customer-driven enterprises. Nordin et al. (2010) divided the Lean System into five categories (Process and Equipment, Manufacturing Planning and Control, Human Resources, Supplier relationship, Customer Relationship) and classified the Malaysian automotive companies into three types: non-lean, in-transition, and lean firms.
On the other hand, other researchers focused to determine the main factors that influenced the successful implementation and the factors that prevented the adoption of The Lean System. Achanga et al. (2006) identified critical factors in implementing LM: leadership and management, finance, skills and expertise, and supportive organizational culture of the organization. However, Nordin et al. (2010) state the factors that drive LM implementation focus to customers’ satisfaction, in order to achieve continuous improvement within the organization. He also states that the main barriers that prevent LM implementation are lean concepts, such as lack of understanding and shop floor employees’ attitude.
The Lean System implementation level in Mexican Automotive companies is rising; however, the level of implementation has not been measured; therefore the authors want to compare the LM implementation level of the Mexican state automotive industry – 3,465,615 vehicles produced in 2016 (AMIA, 2017) – with Spain, since it is the second largest vehicle manufacturer in Europe – with 2,885.907 units (ANFAC, 2017) – and Brazil – 1,016,680 vehicles (OICA, 2017) – being the second largest in Latin America.
2.1 SAE J4000
The Society for Automotive Engineers (SAE) approved the Lean System best practices specifications, the J4000 standard (SAE 1999a) in 1999. The standard includes elements (Process and Equipment, Manufacturing Planning and Control, Human Resources, Product Design, Supplier Relationships, Customer Relationships) identified in a study carried out by Panizzolo (Bergmiller et McCright, 2009). A previous standard study also included the development of a survey that allows determining the critical factors that impact LM implementation in the organizations (Panizzolo, 1998).
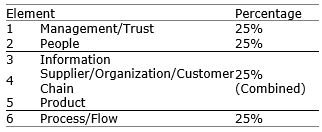
The standard mentioned lists the criteria through which LM can be reached. The main portion of the standard is made up of 52 components, divided into 6 elements. They are: Management/Trust (element 1), People (element 2), Information (element 3), Supplier/Organization/Customer Chain (element 4), Product (element 5), and Process/Flow (element 6). Each element possesses a weight in the implementation (estimated by the relative importance they have for the Lean Production System), as established by the standard SAE J4000.
This standard was complemented by SAE J4001 (SAE 1999b), which provides the necessary instructions to carry out the evaluation suggested by SAE J4000 standard and related percentages for each element, in order to obtain the overall rating using a weighted average. These percentages are shown in Table 1.
Table 1. Percentages assigned to each element
3. Design of research and methodology
This effort seeks to determine the Lean System implementation level in the State of Mexico automotive industry and how the existing knowledge can be expanded in LM (exploratory research).
A field of research that analyzed each company, using a survey as measurement instrument proposed by SAE J4000, was utilized. Interviews with managers were corroborated with field information to validate the information provided. This process allowed collecting and selecting the required information to measure the LM implementation level of each specific element for each company in the sample.
Moreover, the Cronbach’s Alpha reliability test was used to measure the stability and consistency of the research instrument. Several researchers (Sekaran et Bougie, 2010; Nordin et al., 2010; Eswaramoorthi et al., 2011) agreed that 0.7 is a lower limit value for Cronbach’s alpha. However, this value may be used as low as 0.6 for exploratory research (Panizzolo, 1998).
The formula used to calculate the Cronbach’s Alpha is shown below:
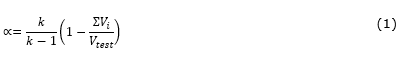
k = Refers to the number of scale items.
Vi = Refers to the variance associated with item i.
Vtest = Refers to the variance associated with the observed total scores.
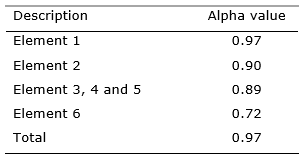
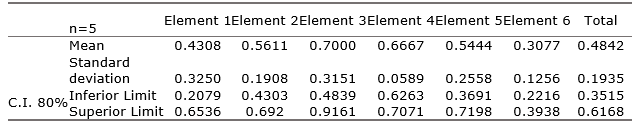
The Cronbach's alpha calculation was performed for each of the elements of the standard and for the overall result. The results can be seen in Table 2. All the results proved to be highly consistent, and therefore reliable with a Cronbach's alpha greater than 0.7.
Table 2. Reliability Test Results
3.1 Discussion of results
Statistical analysis of the data includes descriptive and inferential statistics. The level of adherence of LM was calculated individually for each company and generally for all companies obtaining the detailed level of implementation. All of the above was done by taking into account the weighted average indicated in the SAE J4000 standard. The results are divided in two sections: the first one focuses on the analysis of the implementation level to the Lean Production System in Mexico State; The second comprises a comparison between Mexico, Brazil, and Spain, with the corresponding statistical inferential analysis.
3.2 Evaluation on the Lean Production System implementation level
The analysis of the implementation level was performed for each company in the sample. The current level of each element and an overall score for each company are shown in Table 3.
Table 3. Results obtained for each company
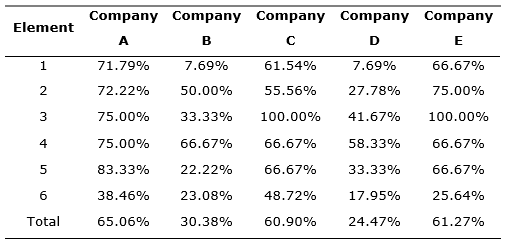
As shown below, a radar chart was made with the information of Table 3, allowing visualizing the best and the worst result obtained for each element of the sample in the Figure 1.
Figure 1. State of Mexico Implementation level to the Lean Production System
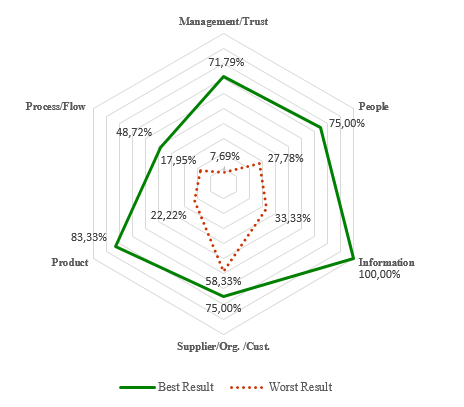
Companies with higher implementation level obtained scores for elements 1 (Management/Trust) and 2 (People) as best overall ratings. This could indicate that the involvement of LM techniques in strategic planning, the commitment of the managers, the inclusion of Lean principles in the organizational objectives and in the Human Resources policies are essential in the organization to successfully implement the Lean System in the whole organization.
Additionally, the State of Mexico average implementation level for each element and a total score was determined, as shown in Table 4. This information shows that the data has a high standard deviation resulting from the large confidence intervals. Thus, these results exhibit that the State of Mexico Lean System implementation level is 48.42%. However, the confidence interval obtained indicates with an 80% confidence that this level is between 35.15% and 61.68%. This range can be reduced by adding more observations to this research.
Table 4. Results obtained for The State of Mexico
3.3 Comparison of Results between the State of Mexico, Brazil and Spain
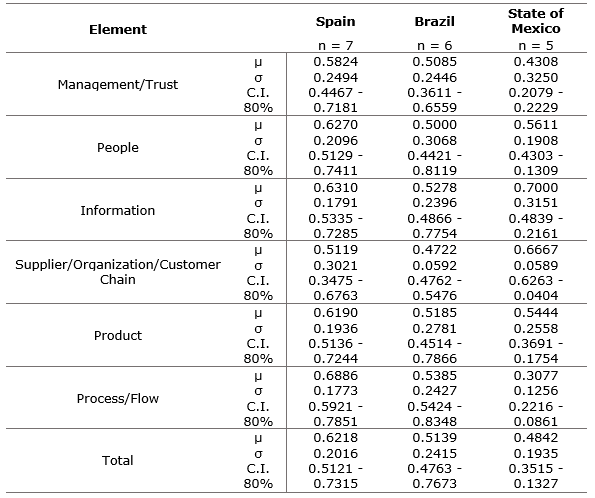
Based on the information gathered through the methodology mentioned above, the information for the State of Mexico is compared with the data from Spain and Brazil, according to Araújo et al. 2012. The data was incorporated through the SAE J400 standard and it is shown in Table 5.
Table 5. Confidence intervals for Brazilian, Mexican and Spanish companies' implementation level
Likewise, hypothesis tests were performed in Table 6 and Table 7 to compare the average of The State of Mexico with Brazil and the average of The State of Mexico with Spain respectively.
In order to develop the hypothesis tests of all the elements, except for the fourth (supplier / organization / customer), the test statistic and the critical value correspond to the mean difference of two random samples of size n1 and n2, respectively. This information was taken from two normal and independent populations with unknown but equal variances, using formulas 2, 3, 4 and 7.
Only for element four, which evaluates the relationship of the organization with its customers and suppliers, the statistical test and the critical value correspond to the mean difference of two random samples of size n1 and n2, respectively. This data was calculated from two normal and independent populations with unknown but different variances by using formulas 5, 6 and 7.
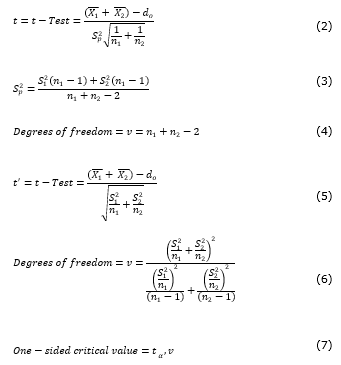
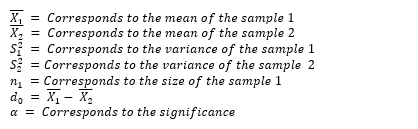
Table 6. Hypothesis test for mean values of the implementation levels between Brazil and The State of Mexico
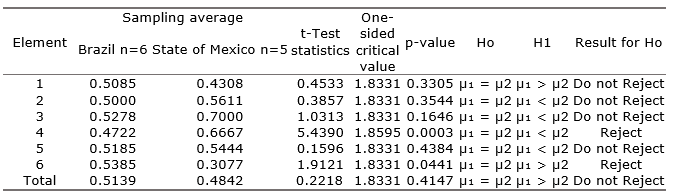
As shown in Table 6, the null hypothesis, which evaluates that the mean of the State of Mexico and Brazil is equal for element 4, is rejected with 95% confidence. This means that it can be confirm that the degree of implementation of this element is greater in the State of Mexico than in Brazil. This result may be due to Mexico having automakers since 1962 (Holweg, 2006). Brazil started its production significantly after 1990, when a "New Automotive Regime” law was introduced (Vanalle et Salles, 2012). Another reason may be due to the present political circumstances in Brazil.
The importance of the above is that automakers make an effort to develop successful relationships with their suppliers. They achieve these successful relationships by sharing their best practices and information, contributing to improving their technical skills and plant capacity. Through this, they target the acceleration of new products development and the promotion of JIT delivery (Vanalle et Salles, 2012). Therefore, Mexico has almost 30 years of advantage, compared to Brazil.
Table 7. Hypothesis test for mean values of the implementation levels between Spain and The State of Mexico
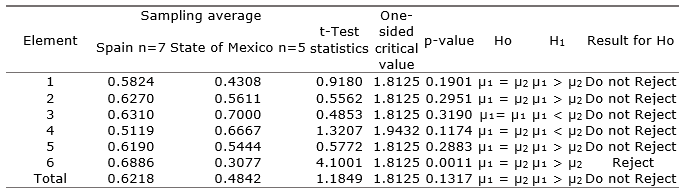
In the same way, the results observed in Table 6 and Table 7 allow the rejection of the element 6, equality of means null hypothesis, with a 95% confidence. Then, it can be concluded that The State of Mexico shows a lower level of implementation to the elements related to LM techniques in the production lines, compared to Spain and Brazil. This result was not expected because North America was the first regional group to establish vehicle assembly plants that implemented LM techniques (Holweg, 2006). For this reason, this unexpected result could be the answer to the fact that data from Spain and Brazil was collected through surveys sent by mail and there was not on-site verification of the information provided (Araújo et al., 2012).
4. Conclusions
The State of Mexico implementation level is 48.42%; however, this response presented a wide confidence interval ranging from 35.15% to 61.68%. This ranging can be reduced by adding more observations to the research, as mentioned previously.
Based on the hypothesis tests carried out, the element 4 degree of implementation is greater in the State of Mexico compared to Brazil. This may be due to Mexico possessing automakers since 1960, almost a 30-year difference compared to Brazil. Consequently, the State of Mexico automotive industry has developed successful relationships with its suppliers for longer periods of time. This is one of the most important requirements of automakers with their suppliers and a reason to invest in their development and continuous improvement.
Statistical results show that the State of Mexico presents a lower level of LM techniques implementation in the production lines, compared to Spain and Brazil. However, this result was not expected, given that Mexico is part of the first regional group to establish vehicle assembly plants that implemented LM techniques. Future research is suggested in this element, since the data was only collected in the State of Mexico. Further verification of information collected from Spain and Brazil is recommended since it was not face-to-face.
The State of Mexico has shown a significant difference in the elements 4 and 6; however, for the others (1, 2, 3, and 5), the confidence level has remained the same, with 95%. Despite these results, the total adherence level for the State of Mexico, Spain, and Brazil is about the same.
Finally, other researchers use their own evaluations different from the SAE J4000 standard; thus, it is complicated to compare their results with the data presented in this study to establish the LM adherence level.
Acknowledgments
We would like to thank to The Automotive Cluster of the State of Mexico (CLAUTEDOMEX) and its Operational Excellence Team for allowing the development of this research. In the same way, we show gratitude to The Automotive Cluster of Nuevo León (CLAUT) for sharing their knowledge about TPS. Additionally, we appreciate the academic collaboration and the time used in the revision and comments on this article by Dr. Karla Valenzuela.
References
Asosiación Mexicana de la Industria Automotriz - AMIA (2017), Cifras de diciembre y cierre del 2016, Ciudad de México.
Asociación Española de Fabricantes de Automóviles y Camiones - ANFAC (2017), España supera los objetivos de producción de vehículos para 2016 con 2,88 millones de unidades fabricadas, Madrid.
Araújo, F. et al. (2012), "Evaluation of Lean Production System by using SAE J4000 standard : Case study in Brazilian and Spanish automotive component manufacturing organizations", African Journal of buisness Management, Vol. 6, No. 49, pp.11839–11850.
Bergmiller, G.; McCright, P. (2009), "Parallel Models for Lean and Green Operations", in Proceedings of the 2009 Industrial Engineering Research Conference, 8-11 Dec. 2009, pp.1138–1143.
Eswaramoorthi, M. et al., (2011), "A survey on lean practices in Indian machine tool industries", International Journal of Advanced Manufacturing Technology, Vol. 52, No. 9-12, pp.1091–1101.
Expansión, (2016), Producción de vehículos 2015, available at: http://www.datosmacro.com/negocios/produccion-vehiculos. (Access 2017 Mar 17).
Holweg, M., (2006), "The genealogy of lean production", Journal of Operations Management, Vol. 25, No. 2, pp.420–437.
Hosseini, A. et al. (2015), "Lean Manufacturing", in García-Alcaraz, J. L. et al. (Eds.), The Lean Manufacturing in the Developing World", SPRINGER, Switzerland, pp. 249–269.
Monden, Y. (1983), Toyota production system: practical approach to production management, Industrial Engineering and Management Press, Michigan.
Muslimen, R. et al. (2013), "A Case Study of Lean Manufacturing Implementation Approach in Malaysian Automotive Components Manufacturer", Electrical Engineering and Intelligent Systems, Vol. 130, pp. 327–335.
Nordin, N. et al. (2010), "A Survey on Lean Manufacturing Implementation in Malaysian Automotive Industry", International Journal of Innovation, Management and Technology, Vol. 1, No. 1, pp.1467–1476.
Ohno, T. (1988), Toyota Production System: Beyond large-scale production, Diamond, Tokyo.
Organisation Internationale des Constructeurs d’Automobile - OICA (2017), 2016 Production Statistics, available at: http://www.oica.net/2016-q2-production-statistics/ (Access 2017 Feb 15).
Panizzolo, R. (1998), "Applying the lessons learned from 27 lean manufacturers: The relevance of relationships management", International Journal of Production Economics, Vol. 55, No. 3, pp. 223–240.
Society of Automotive Engineers - SAE (1999a), SAE J4000 - Identification and measurement of best practice in implementation of lean operation, Society of Automotive Engineers, Warrendale.
Society of Automotive Engineers - SAE (1999b), SAE J4001 - Implementation of lean operation user manual, Society of Automotive Engineers, Warrendale.
Sekaran, U.; Bougie, R. (2010), Research Methods for Business: A skill building approach 5. ed., John Wiley & Sons, New Jersey.
Shingo, S. (1989), A Study of the Toyota Production System, Tokyo.
Srinivasaraghavan, J.; Allada, V. (2006), "Application of mahalanobis distance as a lean assessment metric", International Journal of Advanced Manufacturing Technology, Vol. 29, No. 11-12, pp. 1159–1168.
The LeanMan, (2016), Lean Principles Training Guide, The Evolution of Lean Lean Factory Simulation Kits.
Vanalle, R.M.; Salles, J.A.A. (2012), "Buyer-supplier relationships in the Brazilian automotive industry", African Journal of Business Management, Vol. 6, No. 31, pp. 9056–9064.
Vilana Arto, J.R. (2011), Fundamentos del Lean Manufacturing: Dirección de Operaciones Fundamentos del Lean Manufacturing, Available at: http://api.eoi.es/api_v1_dev.php/fedora/asset/eoi:75259/componente75258.pdf. (Access 2017 Feb 17).
Womack, J.; Jones, D. (1996). Lean Thinking, Free Press Business, London.