Proposed system for analyzing the location of preschools: a Brazilian case study
Kellen Dayelle Endler1, Cassius Tadeu Scarpin1, Maria Teresinha Arns Steiner2
1 Federal University of Paraná – UFPR
2 Pontifical Catholic University of Paraná - PUCPR
Abstract
Early infant education and care have become priority issues in Brazil. The present article evaluates the spatial distribution of public preschools in the municipality of Curitiba, in Paraná State, Brazil. This problem is an important aspect of school administration and can relieve problems of inequality in public education, such as accessibility and availability of places. The main contribution of this article is the system it proposes for rationalizing decision-making in the education system in question. This system presents four complementary analyses, although they are independent of one another: (i) analysis of the current location of facilities; (ii) analysis of the proposed location; (iii) analysis for expanding the capacity of existing units; and (iv) analysis of the opening of new facilities. The models were generated using VB.NET© modeling language and were solved by the CPLEX© solver. The results showed that, in general, there is a need for immediate planning to increase the number of places available in public infant education in Curitiba, which is also a requirement for compliance with the goals of the National Education Plan (NEP) that is now in force nationwide.
Keywords: Location; linear programming; decision-making; preschool.
1. Introduction
Infant education is widely recognized as the basis of the path to full citizenship, “in its physical, psychological and social aspects, complementing the actions of the family and community” (Article 29 of the LDB - Law of Directives and Bases of National Education). Education is doubly protected by the Brazilian Federal Constitution of 1988, both as a right for children and a right for workers and their children and dependents.
The NEP (National Education Plan), enacted through Law 13.005/2014, addresses infant education, stating that places in preschools should be available for all 4-5-year-old children by 2016. Therefore, the public authorities were faced with making an important strategic decision regarding the best location for the new facilities required by the new law, taking the location of existing facilities into account with a view to guaranteeing the necessary number of places and facilitating access to schools.
The present article addresses the evaluation of the spatial distribution of public preschools in Curitiba. This problem is an important aspect of school administration and can reduce inequalities in public education, such as accessibility and availability of places. The aim of this article is to present an analysis system to rationalize decision-making in education. This system includes four complementary, but independent, analyses: (i) analysis of the current location of facilities; (ii) analysis of the proposed location; (iii) analysis of expanding the capacity of existing units, and (iv) analysis of the opening of new units. Analyses (i) and (ii) have been presented and used in several other works (see e.g., Pizzolato et al., 2004). Analysis (iii) shows the number of places that should be added to the infant education units to meet demand according to the criterion of proximity. Finally, analysis (iv) shows, in the same scenario, the best locations for facilities if demand increases and new facilities are required.
This work is important in practical terms because the results can help identifying regions where more places are required. They can also help to define the best investment strategy in public infant education units in Curitiba. Furthermore, other municipalities could benefit by applying the methodology, especially those with a considerable shortage of places. These municipalities need to evaluate the best locations by using strategies for the expansion or creation of places.
The article is organized as follows. Section 2 contains a review of the literature on the subject. In Section 3, the proposed system for analyzing the location of preschools in the public education network is presented, with a description of how the data were collected and treated and the methods used to address the problem. In Section 4, the development of the proposed system and the results are presented. Finally, the conclusions and suggestions for future studies are presented in Section 5.
2. Literature Review
Facility location decisions are an important element in strategic planning in the private and public sectors, as they can have a strong and lasting impact on operational and logistical performance (Drezner et Hamacher (2002)). A facility location problem seeks to find the best position for facilities in a region to optimize a specific objective function ReVelle et al. (2007). For some interesting reviews of models and methods for addressing FLP, see Drezner et Hamacher (2002), ReVelle et al. (2007), Klose et Drexl (2005), Revelle et Eiselt (2005) and Eiselt et Marianov (2011).
Regarding facility location decisions, Current et al. (1990), Lirn et al. (2003) and Randhawa et West (1995) include factors such as minimizing costs, the proximity of suppliers and consumers, local infrastructure, the location of competitors, government barriers, economic impact, environmental damage and determining the number of facilities required to guarantee the desired level of services. These factors vary according to the type of business involved.
Formally, the study of location problems began with the pioneer work of Alfred Weber. Owen et Daskin (1998) recall that in 1909, Weber analyzed the problem of building a single warehouse and minimizing the distance between it and its various customers. The work was first published in German and translated into English twenty years later (Weber, 1929). The seminal paper by Hakimi (1964) generalized the original Weber problem (Weber, 1909) from a single Facility Location Problem (FLP) to a multiple facility location problem. This publication marked a revival of the facility location problem, which has become one of the standard problems in the operations research community (Eskandarpour et al., 2015).
Location problems have been widely studied in a variety of sectors, resulting in the development of different methods and an impressive number of solutions particularly designed for various types of location problems. In recent decades, there have been many applications concerning the location of public (i.e. schools, post offices, emergency services, fire stations, hospitals, ambulances) and private (i.e. plants, warehouses, industrial sites) facilities (Aboolian et al., 2007, Bruno et al., 2015).
There have been many recent works on deterministic multi-period models, where decisions are made in different periods of a given planning horizon, based on the known value of parameters over time. Likewise, there are stochastic models, where decisions are made once based on uncertain knowledge of the future value of input parameters. See Dias et al. (2007), Albareda-Sambola et al. (2009), Wilhelm et al. (2013), Correia et Melo (2015), Jena et al. (2016) for recent articles related to multi-period models. For some interesting and recent stochastic models, please see Berman et Drezner (2008), Sonmez et Lim (2012), Klibi et al. (2016), Marković et al. (2017).
Recently, many articles have worked with multi-objective models when addressing problems that involve location. Some important contributions can be listed. Najafi et al. (2015) proposed a multi-objective integrated logistic model to locate disaster relief centers while taking into account network costs and responsiveness. To solve the location problem, they presented a genetic approach. Steiner et al. (2015) presented an optimization-based model for developing a better system for patients by aggregating various health services offered in the municipalities of Paraná into some micro regions. The problem is formulated as a multi-objective partitioning of the nodes of an undirected graph (or network) with the municipalities as the nodes and the roads connecting them as the edges of the graph. As an optimization tool, they used an integer-coded multi-objective genetic algorithm.
Basar et al. (2016) presented an integrated decision support methodology for locating bank branches. In the model, they considered the characteristics and importance of the selected criteria, and proposed a novel multi-objective mathematical programming model. The proposed methodology was applied to locating branches of a Turkish bank. Paul et al. (2016) analyzed the effectiveness of the current and optimal locations of a set of existing regional assets maintained by the Department of Defense to respond to large-scale emergencies. They formulated a multi-objective hierarchical extension of the maximal covering location problem that sought to maximize coverage of the population within a rapid response window while minimizing modifications to the existing structure.
Guerriero et al. (2016) proposed some optimization models to support the decision-making process in a healthcare service network. They compared the existing health care service network of the northern area of Calabria (Italy) with the configurations determined by solving well-known facility location models. Ares et al. (2016) considered the problem to locate a fixed number of Roadside Wellness Centers (RWCs) based on these effectiveness and equity objectives. They came up with a novel, set-partitioning type of formulation for the problem and proposed a column generation algorithm to solve it.
The present study focuses on evaluating the location of educational units. In the literature, such studies have been conducted in several countries. For studies conducted in Italy, see Bruno et al. (2015; 2016). The former presented a mathematical model to support location decisions oriented to rationalize facility systems in non-competitive contexts. To test the model, they showed computational results and an application concerning the Higher Education system in an Italian region. The latter presented two new mathematical models to support the decision to modify the current configuration of educational units. Another work that deserves to be mentioned is that from Deruyter et al. (2013), which evaluated the spatial inequality in preschools in Belgium, considering accessibility and area analysis. The paper provides an instrument for local authorities to support decisions aimed to increase the capacity of existing schools, implement new schools or suppress non-essential school locations. For Brazilian papers on school location, see Pizzolato et al. (2004), Pizzolato et Silva, (1997), Figueiredo et al. (2014) and Mapa et Lima (2014).
In general, the models commonly used in a public context are the median, covering and center models, which provide a solid base for most location studies (Owen et Daskin, 1998). The complexity of the location problem depends on its nature and the criteria to be considered to make the decision. However, these have two characteristics: (i) they are difficult to solve, since even their simple versions are considered NP-hard and (ii) they appear to be sub-problems of several other problems (Current et al., 1998; and Noor-e-Alam et al., 2012).
3. Proposed Analysis System
The schema of the stages of the proposed system for analyzing the location of preschools is described in Figure 1. Details on each step are mentioned throughout Section 4.
Figure 1. Schema of employed methodology
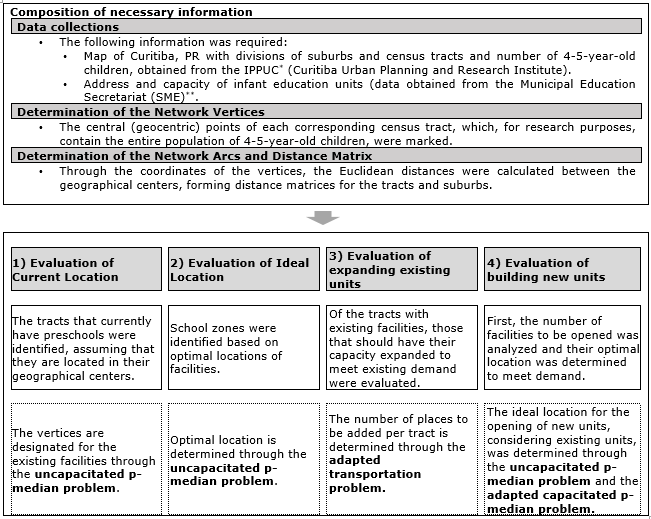
*IPPUC is the Curitiba Urban Planning and Research Institute. It is responsible for urban planning and monitoring of actions in the municipality through urban projects aligned with the master plan
**The Municipal Education Secretariat seeks to ensure quality education for children, young people and adults in the municipal network
Source: The author(s)’ own
4. Development and Results
To study the spatial distribution of the infant education units, it was necessary to discretize the population into micro regions called census tracts. This enabled normative studies of the population. Therefore, the map of the region to be studied must be divided into census tracts, which are small divisions determined by the Brazilian Institute of Geography and Statistics (Instituto Brasileiro de Geografia e Estatística – IBGE). The tracts facilitate the conducting of the Census (IBGE, 2010). The census tracts will be referred to hereafter on as a tract or tracts.
Regarding the number of children in each tract, information was used on the school-age population in the 2010 Census conducted by the IBGE (2010). The number of children per Tract who require a place in preschools, according to the 2010 Census, is partially shown in Table 1. As shown in the table, the number of tracts is 2,395, and the total number of 4-5-year-old children in 2010 was estimated at 43,717.
Table 1. Population divided by age and by tracts and suburbs of Curitiba
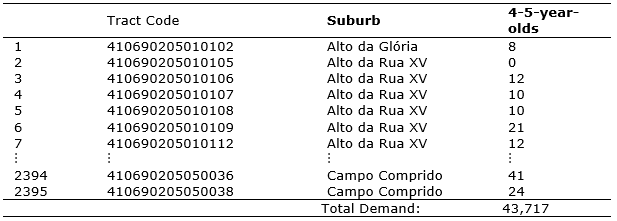
Source: Compiled from IBGE - IPPUC - Database (2010 Census) available at: http://curitibaemdados.ippuc.org.br/curitiba_em_dados_pesquisa.htm Accessed on 9 February 2017.
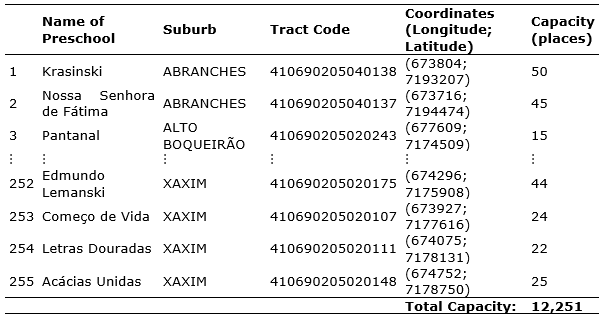
Furthermore, information was collected on the address and enrolment capacity of each of the 255 preschools in Curitiba, provided as mentioned above by the Municipal Education Secretariat. Table 2 shows the location of some of these units and their current enrolment capacity. Each preschool has an average of 46 places, with a standard deviation of 28 places. For further analysis, it was estimated that the capacity of the new units to be built would be 50 places.
Table 2. Public Preschools in Curitiba
Source: The author(s)’ own
It was necessary to locate the center of gravity for each tract, i.e. a point to represent the geographical center of the tract. Figure 2 shows the map of Curitiba, scanned using ArcGis® software, with boundaries of 2,395 census tracts, with the different colors representing the clusters that form the 75 suburbs. It is assumed that these points, for the purposes of the study, contain the entire school population of four and five-year-olds in the tract, as it is not possible to know the exact position of each student. This figure also shows the geocoding of the existing unit with a label for the current capacity of each one.
Figure 2. Geocoding of the addresses of the preschools illustrating the capacity of each unit
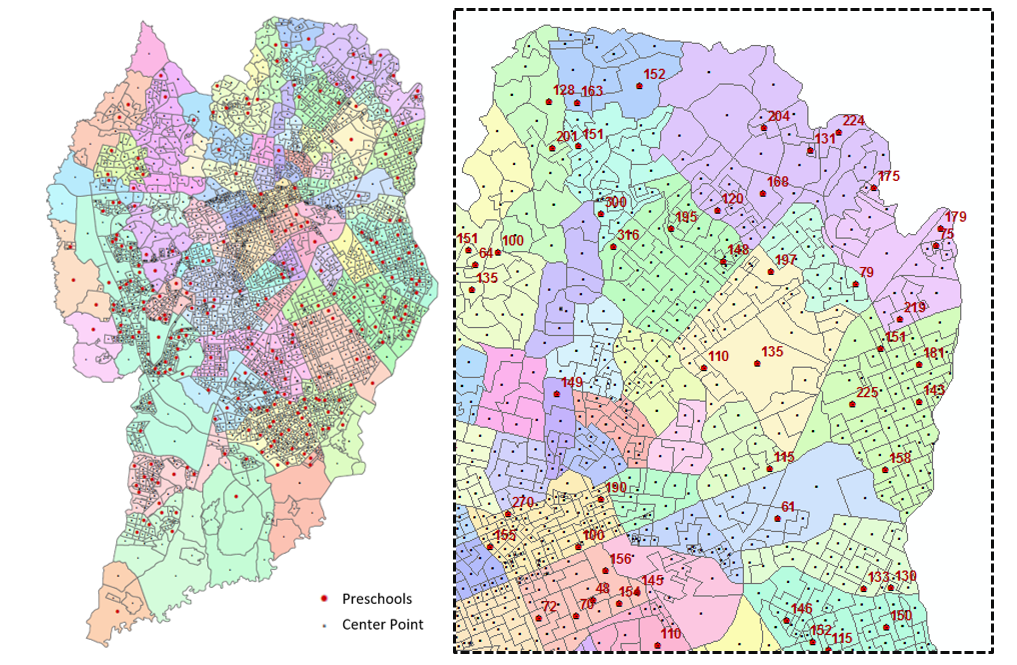
Source: The author(s)’ own
With the network vertices and their respective geographical coordinates defined, a graph G = (N, A) is created with N = {1,...,n} vertices, representing the geographical centers of the tracts in the area under study, measuring the distances between geographical centers, using Euclidean distances between the pairs of vertices. Thus, for each vertex i ∈ N a weight demi is associated, which represents the demand centered on that vertex. With each pair of vertices (i, j) a distance dij is associated. The matrix D = [dij] combines the distances between all the pairs of vertices.
An important factor to consider due to its impact on the use of public education units is the number of private institutions. The Ministry of Education estimates that, in 2014, private units accounted for 54.60% of all units. Thus, the following simplification was adopted: it is assumed that the private education network fills 50% of the necessary places. Consequently, the remaining 50% should be the responsibility of the public network.
This premise may be considered valid because a certain percentage of children will resort to the private units, irrespective of the number of places in the public network. In other words, seeking to meet 100% of the demand for places in schools in public units would mean an excess of places, overestimating demand for the public network, as part of the demand is met by the private tract. At the same time, there is the possibility that some children would not use the private network if places were available in the public units.
Based on this information, an analysis was made of the location itself, adjusting for the aforementioned percentage rate (50%) in all subsequent analyses. The required places values in each census tract were rounded up to non-integer percentages, resulting in 22,441 places in total that should be provided by the public network.
4.1 Evaluation of Current Location
The first evaluation was concerned with the current location of preschools, distributed over 75 suburbs and 2,395 tracts in Curitiba. This stage consists of taking the facilities in their current locations and identifying their respective catchment areas, i.e. the areas that, due to their proximity, would be served by each unit. Thus, the demand from the catchment area could be compared with the enrolment capacity to determine whether there was a shortage or surplus of places.
In this stage, the p-medians model is applied to designate children to public preschools. Ref. 39 links the p-median problem (PMP) to an undirected graph G = (V,A), where the set of vertices V contains n demand points interconnected by the arcs of the set A. The purpose is to identify a set of vertices Vp (Vp∈V) selected as medians, so that the sum of the costs between the vertices of {V-Vp} and the corresponding (or associated) vertices of {Vp} is minimal.
For this model, a graph G = (N, A) is created with N = {1,...,n} vertices, so that the indices i and j ϵ N. The decision variables correspond to [xij]nxn, which is an assignment matrix, with xij=1 if the vertex i is assigned to the median j, and xij=0, otherwise; xij=1 if the vertex j is a median and xij=0, otherwise. The parameters are: n is the total number of vertices (demand points) on the graph G; p = number of demand points to be chosen as medians; dij is the Euclidean distance matrix between i and j; demi is the demand point of the vertex i.
Thus, the p-medians problem can be formulated in accordance with the following model of Binary Integer Linear Programming (BILP), from (1) to (5).
The objective of the problem in (1) is to minimize the sum of the weighted distances of each vertex to the nearest median. In other words, minimize costs between the vertices of {V-Vp} assigned to the medians of {Vp}. The constraints in (2) and (4) guarantee that each vertex i (demand point of {V-Vp}) is assigned to only one vertex j, which must be a median. The constraint in (3) ensures that the set {Vp} contains exactly p elements, and the constraint in (5) defines the decision variables xij as binaries. Constraint (6) is added to this model, defining which schools already have units.
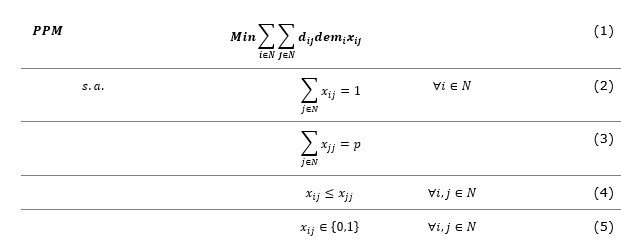
The objective of the problem in (1) is to minimize the sum of the weighted distances of each vertex to the nearest median. In other words, minimize costs between the vertices of {V-Vp} assigned to the medians of {Vp}. The constraints in (2) and (4) guarantee that each vertex i (demand point of {V-Vp}) is assigned to only one vertex j, which must be a median. The constraint in (3) ensures that the set {Vp} contains exactly p elements, and the constraint in (5) defines the decision variables xij as binaries.
Constraint (6) is added to this model, defining which schools already have units.
To solve this problem, it is possible to identify the suburbs/tracts with preschools and the shortage or surplus of places. An excess of places is calculated by comparing the number of children seeking a place and the capacity of the facilities.
In this stage, no attempt is made to optimize, only to confirm. Thus, the model makes a simple designation of each suburb or tract without a crèche or preschool to the suburb or tract with the nearest facilities.
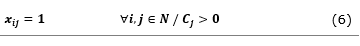
Figure 3 illustrates the problem in a broad sense for suburbs and in detail for tracts. These figures are given colors according to a code that indicates the seriousness of the imbalances identified, according to bands of excess or shortages of places in the regions (suburbs and census tracts) in question. Thus, it is clear that the priority investment areas will be those in red, as they have the greatest shortage of places.
Figure 3. Evaluation of the current situation by rates of excess or shortage of places in suburbs and census tracts
Source: The author(s)’ own
This initial analysis leads to a conclusion regarding the management of the system in the short term. The greatest imbalance is in the suburbs of Cajuru, Sítio Cercado and Cidade Industrial. Despite the existence of active facilities, there is a shortage of over 500 places. Therefore, any new openings or expansions should prioritize these suburbs a priori.
Regarding the analysis of the current location for the tracts, the ones farthest from the city center suffer the greatest shortage of places, with over 20 places required. There are tracts with a surplus of places (in blue), such as the extreme south and west of the city.
4.2 Evaluation of Ideal Location
In this phase, the ideal or optimal location is obtained by solving the p-median model, from (1) to (5) using CPLEX. Although the existing facilities are not easily and cheaply removable physically, the study of the optimal location is justified when the inequalities are serious or when there is a need to supplement the construction of new facilities. It is important to review the inequalities and analyze the necessary expansions. In this stage, zoning based on optimal locations is established, and can be compared with the current locations of existing schools.
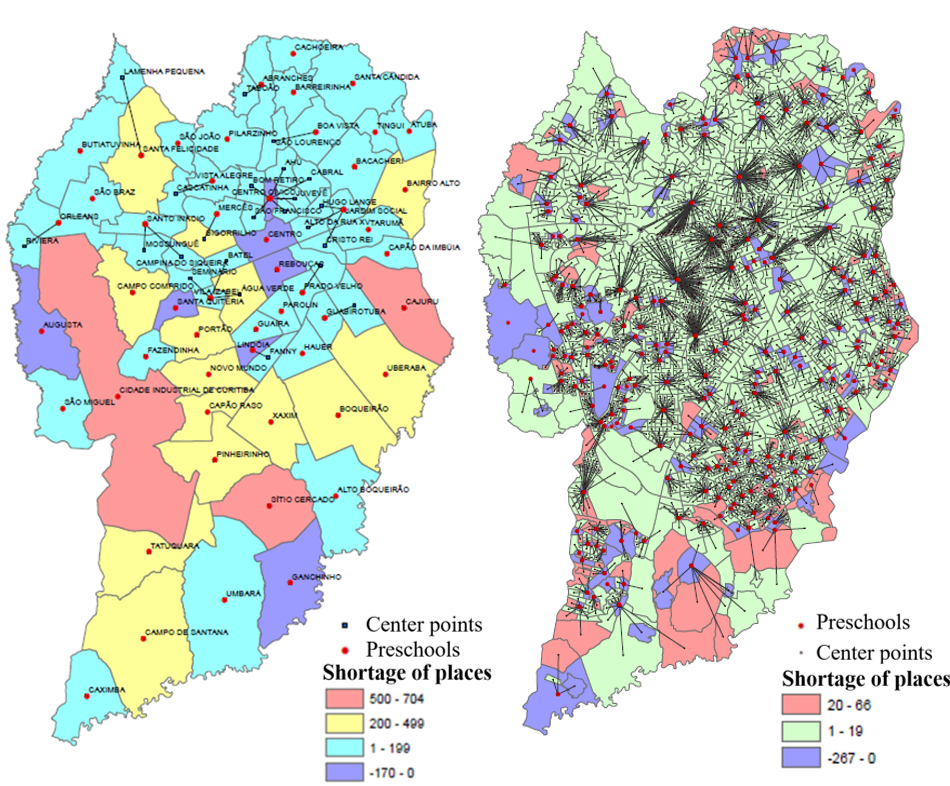
It should be highlighted that, for managerial purposes, the proposed reallocation must include procedures to conciliate it with the existing network, not disregarding existing units, with their land and facilities. The proposed locations divide the area into regions, and each preschool will belong to one of these, adding its capacity to it. Therefore, although the current facilities are not in the proposed locations, they will have the capacity to serve the regions identified by the model. Thus, for each proposed region there was a demand from students and a supply from the capacity of the existing schools. The results of this comparative evaluation are shown in Figure 4.
Figure 4. Solution of the uncapacitated model for suburbs and tracts
Source: The author(s)’ own
The analysis of the ideal location for facilities found, for instance, that the suburb of Prado Velho, with 82 children, would cease to have preschools. The children would be sent to the suburb of Parolin, which has 176 children. An analysis of the 2,395 tracts shows the formation of well-balanced regions, with an even distribution of schools all over the map.
4.3 Evaluation of the Expansion of Existing Units
The analysis based on the expansion of preschools through the mathematical model for the linear programming of transportation identifies the existing physical facilities that should expand their capacity and determines the required number of extra places.
The classical Transportation Problem (TP) refers to situations such as the transport or distribution of products from production centers to consumer markets in such a way that the cost of transport should be as low as possible.
The transportation model in the present work is used to minimize the sums of distances traveled by children to their preschools. Therefore, it is admissible that, instead of having (1) production centers with a determined quantity produced or on offer and (2) consumer markets with demand for a determined quantity, there are 1) public preschools with a determined number of places on offer and (2) a determined number of children than need these places. In the mathematical formulation of the TP adapted to the problem in question, the origins are clusters of children on the vertices and the destinations are the preschools.
The decision variables for this model are: xij, representing the number of children (therefore, xij≥0) conducted from the origin vertex i to the destination vertex j, which represents a preschool; kj, representing the number of places to be added in the tracts j within the existing facilities in each tract j.
The parameters are: demi, referring to the total number of children in the vertex i; Cjis the number of places on offer or the capacity of each j and the distance dij. The value of M is also added to the model. This is a sufficiently large number (for calculation purposes M=100,000). Thus, the lowest number of places kj is accepted. Empirically, it may be considered that M>[∑i∈N)dij.xij]∀j. The complete model of the TP is defined in (7) to (11), below.
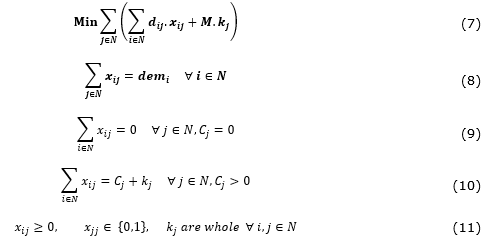
The objective function (7) focuses on minimizing the sums of the distances traveled by the children to the preschools. If xij is the number of children “transported” from origin i to destination j, then dijxij is the cost of this transport. The total cost of transport is the sum of the distances traveled by all the children transported from every origin i to every destination j.
The constraint in (8) determine that the total number of children that leave a determined vertex i for the facilities j must not be higher than the number of children in this vertex. The constraint in (9) does not allow children to be taken to vertices without preschools. The constraint in (10) determines that for suburbs or tracts with preschools, i.e. those with Cj>0, the total number of children taken to each vertex j must be equal to the capacity of this preschool, added to kj. The constraint in (11) is concerned with the domain of the decision variables.
The results of the model showed that 187 units out of 255 needed to increase the number of places. In other words, the configuration of this model demonstrated that, approximately, 27% of the units had not seen an expansion in terms of preschools. Figure 5 highlights the designation of children to preschools and the number of places that need to be added.
Figure 5. Illustration of the solution of the Transportation Model for tracts. Note: In parenthesis: (Demi; Ci) for all of vertex i
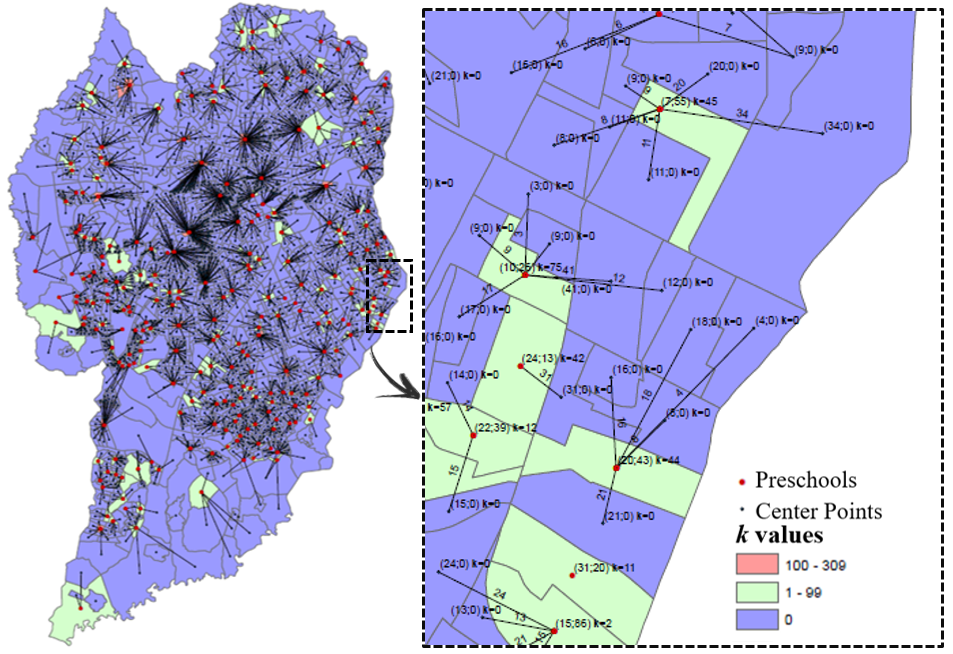
Source: The author(s)’ own
The analysis showed that the tract requiring the greatest increase needed to add 309 places. Considering that that average number of children enrolled in a preschool is 50, as estimated by the average capacity of preschools in the initial data, the equivalent of six facilities would be required to meet this demand.
There are ways of adjusting the capacity of a school, such as increasing the number of classes, greater use of the classroom and/or small building works to expand the facilities. However, the results indicated that 28 of the units requiring expansion have a shortage of over 100 places. This result may justify the opening of new units. This strategy will be assessed in the following subsection.
4.4 Evaluation of Opening New Units
With the analyzes presented, it is confirmed that the number of vacancies should be expanded so that the entire demand for children is met. For the strategy of opening new units, two analyzes were conducted. The first is based on the traditional p-median model, except for considering the location of existing schools. The second was based on the adapted capacitated p-median problem.
It is important to mention that, for this analysis to be conducted, the number of tracts with preschools had to be close to the real number of existing units. The tracts represent better the capacity of a single preschool than the suburbs.
4.4.1 Adapted uncapacitated p-median problem
The model used in this analysis, (12) to (17), differs from the one presented as (1) to (5), as it contains a constraint (16) that defines the vertices j with existing schools, and adds the parameter pnew to the existing p-medians, representing new units, in (14).
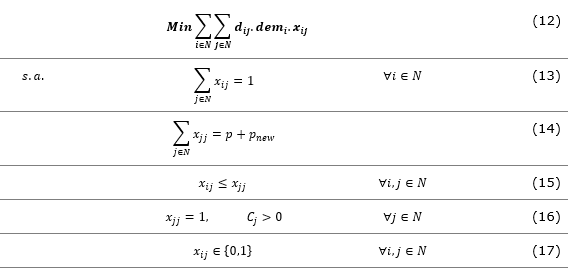
The number of units to be built, pnew, was obtained as follows. First, the total number of required vacancies was determined, calculated by the difference between the estimated demand (22,441 children) and the total capacity (12,251 places) in the tracts (resulting in 10,190 places). This number was then divided among the number of places that a new unit would have, estimated at 50 places (as estimated in the initial data).
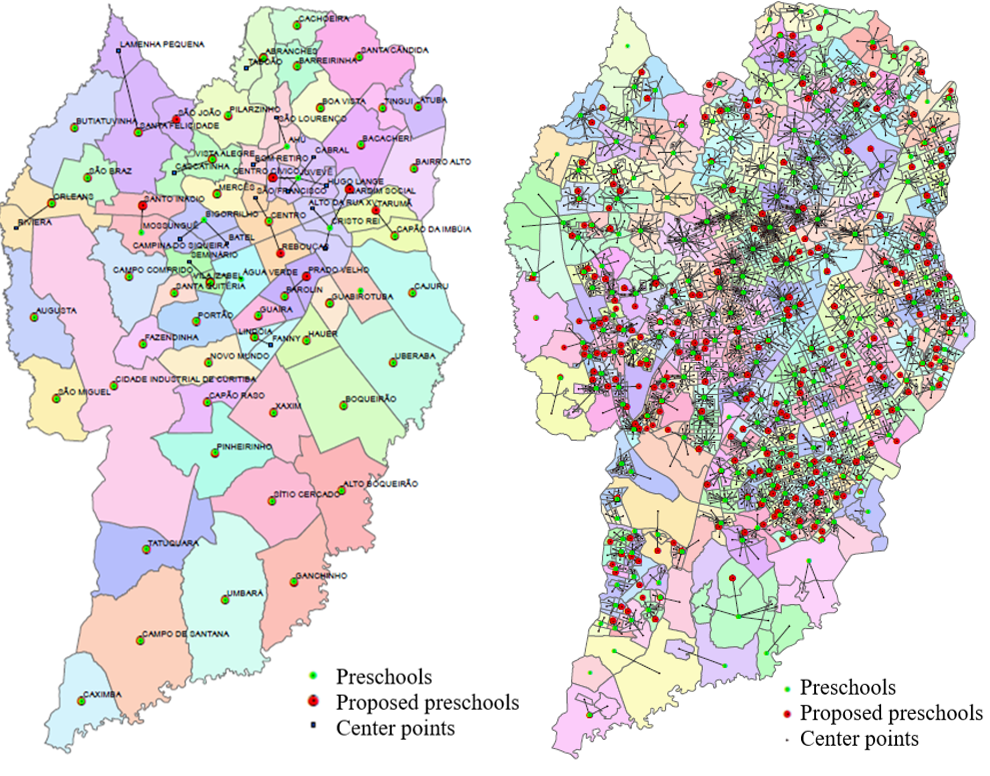
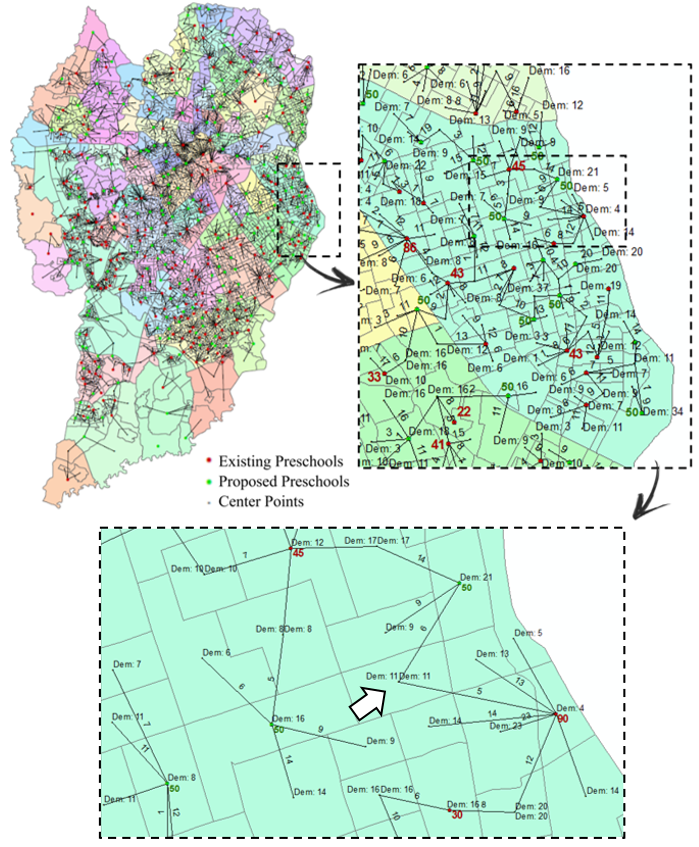
The solution of the uncapacitated p-median problem shows the ideal location for the opening of new units on the map of Curitiba. By this calculation, the number of new units to be built is 204 (pnew=204). Figure 6 shows in detail the demand of each vertex, including vertices that already have facilities and the suggested facilities.
Figure 6. Solution of the adapted uncapacitated model.
Source: The author(s)’ own
4.4.2 Adapted capacitated p-median problem
For this analysis, the model in (20) to (25) shows the significant differences from the classical model in (1) to (5), with (1), (2) and (4) remaining unaltered in (20), (21) and (23).
For this model, a graph G = (N, A) is created, with N = {1,...,n} vertices, so that the indices i and j ϵ N. The decision variables xij, in turn, are not binary variables, as in the model in 4.1. They are continuous, now representing the fraction of children in each census tract i that are assigned to the infant education unit j. xjj=1 if the vertex j is a median and xjj=0, otherwise (see constraint (25)).
The parameters are: dij is the matrix of Euclidean distances between i and j; demi is the demand of the vertex i; p represents the number of existing preschools; pnew is the number of facilities to be opened to meet demand; pde is the number of existing units with below-demand capacity, i.e. demand is greater than supply, and with behavior similar to the other vertices without facilities; cn represents the capacity of a newly opened school; dni represents updated demand; cnj updated demand.
On the opening or not of a new preschool, the demand, capacity and decision variables should be updated to the set of vertices that already have existing preschools. These vertices form a subset N' of the existing N vertices (N' ∈ N):
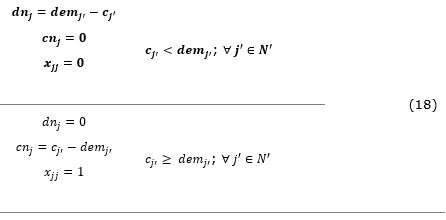
For tracts with existing preschools, that is, with cj>0, the relationship between capacity and demand is verified. Tracts that have capacity greater than or equal to demand are defined as xjj=1. The tracts that have preschools, but with less than the necessary capacity, are necessarily considered surplus demands in the search of new preschool, with xjj=0. Thus, these children should be allocated to the new preschools, which will be defined by the model among vertices that do not have preschools. For vertices that do not have pre-schools (that is, those with cj=0), we assume cnj=cn, where cn represents the capacity of a new open preschool (50 vacancies):
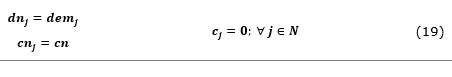
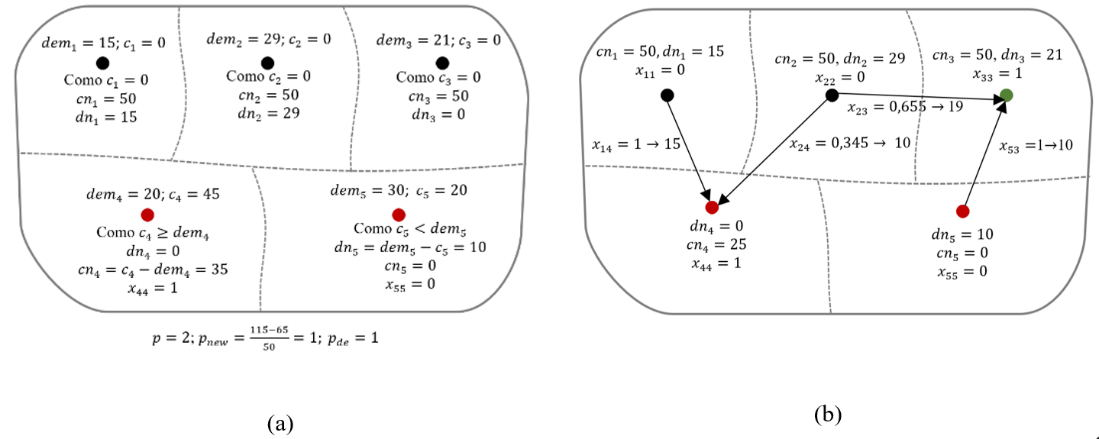
Figure 7 presents a numerical example of calculation for tracts with preschools.
Figure 7. Representation of pre-optimization parameters (a) and example of a post-optimization result (b)
Source: The author(s)’ own
Note: The new units are represented in green and the existing units, in red.
The updated model is presented below:
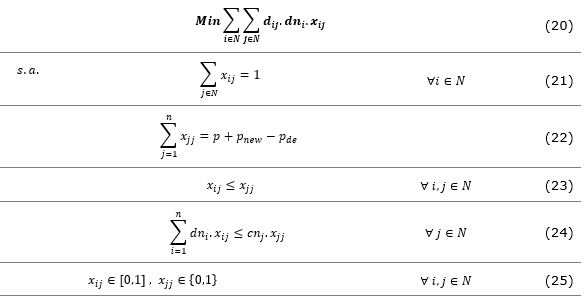
The constraint in (21) refers to the children of vertex i that are destined to only one school j. The constraint in (22) refers to the number of medians or preschools to be opened. The constraints in (23) ensures that vertex i is allocated to a median j only if j is a median. The constraint (24) makes the model capable, so that the total number of children to be assigned to a given vertex is less than or equal to its capacity. The constraints in (25) define the domain of the variables. It is worth mentioning that the vertices j that have preschools, represented by the variable decision variable xjj, are fixed a priori as explained above.
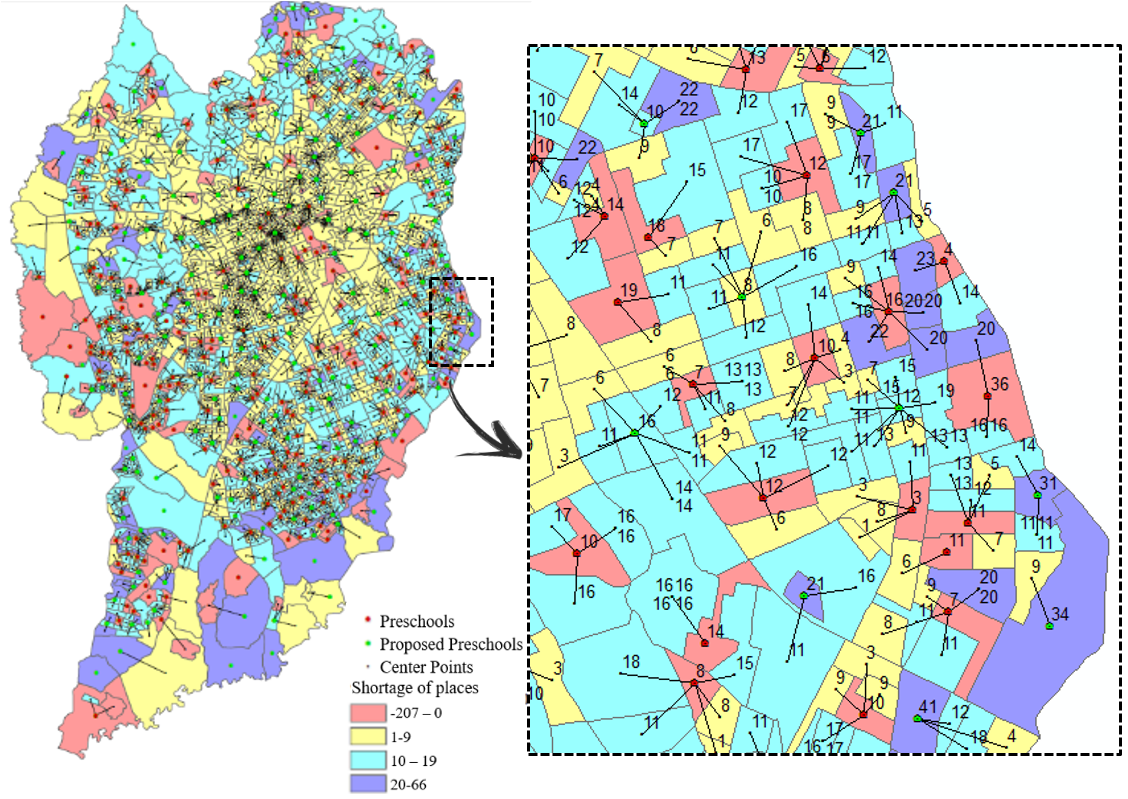
Figure 8 shows in detail the demand of each vertex and the number of children that leave one vertex for another, represented by the labels on the lines. The capacities of the new units are shown in green, while the capacities of the existing units are in red. For example, in the enlarged region, there are three preschools with a capacity of 30, 45 and 90 places, and three new preschools, each with a capacity of 50 places. The arrow points to a tract with 11 children, of whom five are assigned to an existing crèche with 90 places, while six are assigned to a new unit with 50 places.
Figure 8. Solution of capacitated model adapted to the preschools
Source: The author(s)’ own
4.4.3 Analysis of Processing Times
For Step 1, the processing times were short, with the longest computational time being 26.12 seconds. This is because this stage only involves designating the vertices to the nearest schools, without relocating the vertices, as occurs in Step 2. In Step 2, for the tracts, the processing times were as long as 21,053.43 seconds (5 h 51 min), which is considerably longer than that of Step 1.
To evaluate the expansion of existing units (Step 3), the times required for obtaining an optimal solution for the suburbs were negligible, at less than 1 second. For the tracts, the processing time was 88.55 seconds, which is also very short. This is because it is not a BILP problem, and the time required for the solution is naturally shorter. These results are shown in Table 3.
Table 3. Computational time and optimal value obtained for Steps 1, 2 and 3
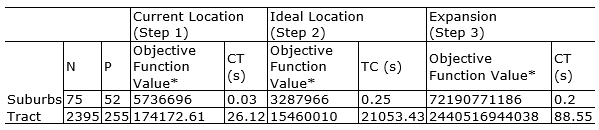
Source: The author(s)’ own. Note: CT = Computational Time
Regarding the analysis of opening new schools in the tracts, for the uncapacitated PMP (Step 4.1), the processing times was 11 h 04 min, considerably longer than the other analyses. In the case of the capacitated problem (Step 4.2), the processing times were 6 h 44 min. However, due to the complexity of the problem, it was not possible to guarantee that the best solution found by the exact method was compatible with the optimal solution of the problem (2.76% gap in relation to the best known lower bound). The results in terms of computational time for evaluating the opening of new units are shown in Table 4.
Table 4. Computational time and result obtained for Steps 4.1 and 4.2
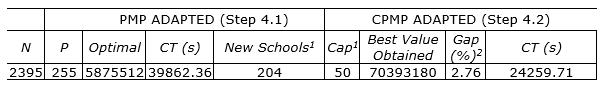
Source: The author(s)’ own
Note: 1For the number and capacity of new schools. 2For the best known lower bound
5. Conclusion
The preschool facility location problem in Brazil is a highly topical issue, as the right to infant education has been a priority goal of public administration, although divergence between discourse and practice is commonplace.
The present study describes a set of methodologies for studying the location of public infant education units and their concomitant application in the municipality of Curitiba, in Paraná State. The methodologies can be applied to any Brazilian municipality, or to any municipality with needs similar to those of Brazil. This work was motivated by the great surge of social pressure nationwide and, specifically, in this field of study, for the expansion or opening of new preschools, as highlighted in the media[1]. The offer of free preschool places often means that the families of these children are free to go out to work and support themselves and contribute to society.
The case study shows that there is a shortage of places in many regions. The number of children who require a place is 43,717, while only 12,251 places are available in public institutions. Thus, there is an estimated global shortage of 31,466 places. This shortage is the result of a simple arithmetical calculation of the difference between the total capacity of each neighborhood and its population, as calculated by the IBGE.
Nevertheless, there are factors that affect this calculation, such as the participation of private schools, which absorb part of the demand or attracting students from neighboring municipalities. This consideration is important given that the Metropolitan Region of Curitiba has 29 municipalities of Paraná State in a relative conurbation process. Many families who reside in neighboring municipalities, for convenience or in search of better quality schooling, prefer to send their children to study in Curitiba. However, this is a two-way process, as the opposite also occurs.
The present study included four analyses that complemented one another, although they were conducted independently. In all the analyses, it was assumed that only 50% of each census tract places were required, resulting in 22,441 places in total that should be provided by the public network. Nevertheless, Curitiba lacks places in infant education. For practical purposes, the analysis of the current location of the facilities is important to show the inequality from one census tract to another. Depending on the numerical values of these inequalities, corrective measures may vary, ranging from managing capacity to building new schools.
The second analysis involved the proposal of reallocating units in the entire network to identify whether the imbalances are important and in which regions they occur most. The proposed locations were conciliated with existing schools to address the imbalances and define the necessary expansions.
The third analysis had to do with expanding the capacity of existing units. Through the model of the classical Transportation Problem, it is possible to conduct a numerical evaluation to determine how many places need to be added at each unit to meet demand. For managerial purposes, some measures can adjust the capacities of schools, such as expanding the buildings, adapting covered spaces to create classrooms, additional classes and more students per classroom (providing these measures comply with the laws and directives of the Brazilian National Education Plan (P)). Reducing capacity is simpler, transferring teachers, school furniture and support from the secretariat to needier areas.
The fourth analysis was based on a strategy of building or opening new facilities. The first model analyzed was an uncapacitated PMP, assessing the best location for new units considering the existing ones.
An alternative solution to this model was found using an adapted CPMP, considering the capacity of the existing units of new schools. The results of this strategy showed that all children without a place should be assigned to the new units as an alternative to expanding existing units. This strategy may weigh more heavily on the public purse. Although the optimal solution was not obtained for this model, its assessment aided the analysis of regions with a need for new units, as the gap is only approximately 3%.
At the managerial level, from the results of the model, it is possible to determine which units should be expanded and which units should be opened. This should be followed by an assessment of the costs and all the suggested strategies. The advantage of using more than one model to solve location problems is that the different results can be compared.
Finally, the use of different models, in parallel with the purposes of this study, proved to be an advantage, enabling the comparison of the solutions obtained. In short, for the case study, the results showed that, in general, there is a need for immediate planning to expand the infant education network in Curitiba, including being in compliance with the goals of the NEP (which states that preschool places should be available to all children by 2016).
As there is an evident need for large investments in this field, the results of this study can also contribute to a better investment strategy for public preschools. In future studies, the information on regions with greater need to open new facilities can be compared with the average income per resident of each census tract.
References
Aboolian R. et al. (2007), “Competitive facility location and design problem”, European Journal of Operational, Vol. 182, No. 1, pp.40-62.
Albareda-Sambola M. et al. (2009), “The multi-period incremental service facility location problem”, Computers & Operations Research, Vol. 36, No. 5, pp.1356-1375.
Ares J. N. et al. (2016), “A column generation approach for locating roadside clinics in Africa based on effectiveness and equity”, European Journal of Operational, Vol. 254, No. 3, pp.1002-1016.
Basar A. et al. (2016), “A Decision Support Methodology for Locating Bank Branches: A Case Study in Turkey”, International Journal of Information Technology & Decision Making, Vol. 1, No. 28.
Berman O., Drezner Z. (2008), “The p-median problem under uncertainty”, European Journal of Operational, Vol. 189, pp. 19–30.
Bruno G. et al. (2016), “Institutions and facility mergers in the Italian education system: Models and case studies”, Socio-Economic Planning Sciences, Vol. 53, pp. 23-32.
Bruno G. et al. (2015), “Capacity management in public service facility networks: a model, computational tests and a case study”, Optimization Letters, Vol. 10, No. 5, pp. 975-995.
Correia I., Melo T. (2015), “Multi-period capacitated facility location under delayed demand satisfaction”, European Journal of Operational Research, Vol. 255, No. 3, pp. 729-746.
Current J. et al. (1990), “Multiobjective analysis of facility location decisions”, European Journal of Operational Research, Vol. 49, No. 3, pp. 295-307.
Current J. et al. (1998), “Dynamic facility location when the total number of facilities is uncertain: A decision analysis approach”, European Journal of Operational Research, Vol. 110, No. 3, pp. 597-609.
Deruyter G. et al. (2013), “Evaluating spatial inequality in pre-schools in Ghent, Belgium by accessibility and service area analysis with GIS”, International Multidisciplinary Scientific GeoConference: SGEM: Surveying Geology & mining. Ecology Management, Vol. 1, pp. 717.
Dias J. et al. (2007), Efficient primal-dual heuristic for a dynamic location problem, Computers & Operations Research, Vol. 34, No. 6, pp. 1800-1823.
Drezner Z., Hamacher H.W. (2002) (Eds), Facility location: applications and theory. (Springer Science & Business Media).
Eiselt H.A., Marianov V. (2011), Foundations of location analysis (Springer Science & Business Media, 155). Eskandarpour M. et al. (2015), “Sustainable supply chain network design: an optimization-oriented review”, Omega, Vol. 54, pp. 11-32.
Figueiredo R. et al. (2014), “A two‐stage hub location method for air transportation in Brazil”, International Transactions in Operational Research, Vol. 21, No. 2, pp. 275-289.
Guerriero F. et al. (2016), “Location and reorganization problems: The Calabrian health care system case”, European Journal of Operational, Vol. 250, No. 3, pp. 939-954.
Hakimi, S. L. (1964), “Optimum locations of switching centers and the absolute centers and medians of a graph”, Operations research, Vol. 12, No. 3, pp. 450-459.
Instituto Brasileiro de Geografia e Estatística – IBGE. Censo Demográfico, 2010. Disponível em: < http://www.ibge.gov.br/home/estatistica/populacao/censo2010/>. Acesso em: 18 ago. 2015.
Jena S.D. et al. (2016), “Solving a dynamic facility location problem with partial closing and reopening”, Computers & Operations Research, Vol. 67, pp. 143-154.
Klibi, W. et al. (2016), “The impact of operations anticipations on the quality of stochastic location-allocation models”, Omega, Vol. 62, pp. 19-33.
Klose A., Drexl A. (2005), “Facility location models for distribution system design”, European Journal of Operational, Vol. 162, No. 1, pp. 4-29.
Lirn T.C. et al. (2003), “Transhipment port selection and decision-making behaviour: analysing the Taiwanese case”, International Journal of Logistics Research and Applications, Vol. 6, No. 4, pp. 229-244.
Mapa S.M.S., Lima R.S. (2014), “Combining Geographic Information Systems for Transportation and Mixed Integer Linear Programming in Facility Location-Allocation Problems”, Journal of Software Engineering and Applications, Vol. 7, No. 10, pp. 844.
Marković N. et al. (2017), “Evasive flow capture: A multi-period stochastic facility location problem with independent demand”, European Journal of Operational, Vol. 257, No. 2, pp. 687-703.
Najafi M. et al. (2015), “Location and distribution management of relief centers: a genetic algorithm approach”, International Journal of Information Technology & Decision Making, Vol. 14, No. 4, pp. 769-803.
Noor-e-Alam M et al. (2012), “Integer linear programming models for grid-based light post location problem”, European Journal of Operational, Vol. 222, No. 1, pp. 17–30.
Owen S.H., Daskin M. (1998), “Strategic facility location: a review”, European Journal of Operational, Vol. 111, No. 3, pp. 423-447.
Paul N.R. et al. (2016), “A multiobjective, maximal conditional covering location problem applied to the relocation of hierarchical emergency response facilities”, Omega, Vol. 66, pp. 147-158.
Pizzolato, N. D., Silva, H. B. F. (1997), “The location of public schools: evaluation of practical experiences”, International Transactions in Operational Research, Vol. 4, No. 1, pp. 13-22.
Pizzolato, N. D. et al. (2004), “School location methodology in urban areas of developing countries”, International Transactions in Operational Research, Vol. 11, No. 6, pp. 667-681.
Randhawa, S. U., West, T. M. (1995), “An integrated approach to facility location problems”, Computers & Industrial Engineering, Vol. 29, No. 1-4, pp. 261-265.
ReVelle C. et al. (2007), “Location models for ceding market share and shrinking services”, Omega, Vol. 35, pp. 533-540.
Revelle C.S., Eiselt H.A. (2005), “Location analysis: A synthesis and survey”, European Journal of Operational, Vol. 165, pp. 1–19.
Sonmez A.D., Lim G.J. (2012), “A decomposition approach for facility location and relocation problem with uncertain number of future facilities”, European Journal of Operational, Vol. 218, No. 2, pp.327-338.
Steiner M.T.A. et al. (2015), “Multi-objective optimization in partitioning the healthcare system of Parana State in Brazil”, Omega, Vol. 52, pp. 53-64.
Weber A. (1929), Uber den Standort der Industrien (Alfred Weber´s Theory of the location of industrieies), University of Chicago.
Weber A. (1909) Ueber den standort der industrien, Рипол Классик, Vol. 2.
Wilhelm W. et al. (2013), “Computational comparison of two formulations for dynamic supply chain reconfiguration with capacity expansion and contraction”, Computers & Operations Research, Vol. 40, pp. 2340-2356.
[1] Recent news coverage is available at: http://g1.globo.com/pr/parana/noticia/2016/03/maes-vao-camara-protestar-contra-falta-de-vagas-em-creches-de-curitiba.html; http://g1.globo.com/fantastico/noticia/2015/08/faltam-mais-de-tres-milhoes-de-vagas-em-creches-e-pre-escolas-publicas.html; http://g1.globo.com/pr/parana/videos/v/falta-de-vagas-nas-creches-ainda-e-um-problema-em-curitiba/4092274/