The creative economy in the State of São Paulo
Cássia Chrispiniano Adduci
cassiaadduci@seade.gov.br
Fundação Sistema Estadual de Análise de Dados – Seade, São Paulo, São Paulo, Brasil
Alda Regina Ferreira de Araújo
aldaregina@seade.gov.br
Fundação Sistema Estadual de Análise de Dados – Seade, São Paulo, São Paulo, Brasil
Luis Fernando Novais
luisnovais@seade.gov.br
Fundação Sistema Estadual de Análise de Dados – Seade, São Paulo, São Paulo, Brasil
ABSTRACT
The text provides a definition of the creative economy chain of São Paulo, seeking to measure its contribution to the economy of the State of São Paulo. For an initial characterization, this article proposes a measurement based upon two perspectives, taking the year 2014 as a reference. The first approach analyzes the chain of the creative economy of São Paulo from the point of view of added value and formal employment and a second one is elaborated with a focus on the flow of international trade.
Keywords: State of São Paulo, creative economy, productive chain.
1 INTRODUCTION
The creative economy is recognized as a source of economic growth in many countries as a result of its important contribution to income and higher income jobs generation and its growing participation in the international trade. In addition, the role played by information technology and design in products and services translates into expanding the insertion of the creative sectors in the international arena. In Brazil, this segment still does not occupy a prominent place; however, an advance is already noticeable in the perception of its economic importance. Based on the 2010 Creative Economy Report, prepared by the United Nations Conference on Trade and Development (UNCTAD) and with reference to other works already carried out around the theme in the country, this article proposes a definition of the creative economy chain in São Paulo.
The concept of creative economy, first used in 2001 by John Howkins, is still evolving and several proposals have been submitted for its definition, characterization and measurement. Thus, one of the first challenges for those who intend to study it is precisely to define the sectors that comprise it, a fundamental procedure to enable its quantification and qualification, aiming at the identification of regional vocations and the design of adequate public policies. In order to face this challenge, the selection of the creative sectors of a given economy must take into account their specificities, with special attention to their potential to stimulate the local and regional economy.
The consensus in the discussion is on the crucial role of creativity "in defining the scope of the creative industries and the creative economy". In this context creativity is understood as "the use of ideas to produce new ideas" (UNCTAD, 2012, p. 3-4). "Upstream activities" (traditional cultural activities, such as performing or visual arts) are differentiated from "downstream activities", which have a greater proximity to the market, such as advertising, publishers or media-related activities, for the definition of creative industries in the approach adopted by UNCTAD. Thus, the concept of creativity is amplified from activities with "a strong artistic component to 'any economic activity that intensely produces symbolic products dependent on intellectual property, aiming at the largest possible market'" (2012, p.7). From this perspective, "Creative industries" include "cultural industries", but go beyond sectors such as advertising, media, fashion and software.
Over the last years, the creative economy has been consolidating its strategic role in the development of many countries and regions, presenting a more intense growth than the one verified in other economic sectors. This dynamism has also played an important role among developing countries, including Brazil.
Based on the challenge of measuring the contribution of creative activities to the economy as a whole, the article proposes a definition of the creative sectors of São Paulo and measures the participation of most of these segments in the economy of the State of São Paulo through added value and formal employment. To complement this assessment, the article also addresses the flow of international trade in creative services.
2. OBJECTIVES AND METHODOLOGY
Facing the challenge of identifying the chain of São Paulo creative economy, this study has set as its initial objectives to define the creative sectors and measure their weight on the economy of the State of São Paulo. The deepening of the study foreseen as a sequence to the analysis presented herein will have among its general objectives:
- To continue the survey and systematization of information and data that allows refining the characterization of the segment.
- To identify potentialities and opportunities for the local and regional development of the São Paulo creative sectors.
- To map and evaluate the results of the public policies implemented in support to the development of the creative economy.
The continuation of the work also foresees the expansion of the analysis of the economic measurement of the creative sectors, with the incorporation of other databases in addition to foreseeing the study of a larger time interval with the purpose to evaluate its behavior throughout recent years.
The methodology proposed to carry out this study involved three phases. The first one referred to a bibliographical revision that made possible the definition of the sectors that would compose the chain of the São Paulo creative economy. From this definition, the second stage selected the pointers that had allowed capturing the economic weight of the creative sectors: added value (AV), formal job and foreign trade.
The added value was measured from a special tabulation for the State of São Paulo from the structural research (Pesquisa Anual de Serviços – PAS [Annual Survey of Services] and Pesquisa Industrial Anual ¬– PIA [Annual Industrial Survey]) carried out by the Instituto Brasileiro de Geografia e Estatística – IBGE (Brazilian Institute of Geography and Statistics) and the formal employment by their information supplied for the Relação Anual de Informações Sociais – Rais (Annual List of Social Information), of the Ministério do Trabalho – MT (Ministry of Labor). Finally, the weight on the flow of the international trade was measured on the basis of the registers of the Sistema Integrado de Comércio Exterior de Serviços, Intangíveis e Outras Operações – Siscoserv (Integrated System of Service Foreign Trade, Intangibles and Other Operations).
In the third phase, the data were collected and systemized, their bases were formatted so that the pointers were calculated and defined in tabular plans. The construction of the pointers took place at the level of class (five digits) of the Classificação Nacional de Atividades Econômicas – CNAE (National Classification of Economic Activities) for the sectors defined as creative (core and the complementary sectors).
The measurement of the importance of the segment in the economy was calculated by the weight of its value added in relation to the Gross Domestic Product of the State of São Paulo [VA (complementary nucleus and sectors) of the creative economy/GDP of São Paulo]. Additionally, this pointer was compared with the participation of important economic sectors in the GDP, such as farming, food and beverages, products, machines and equipment and transport material, which made it possible to size up the position of the creative economy in the production structure of the State of São Paulo.
3. DEFINITION OF THE CREATIVE SECTORS OF SÃO PAULO
Some studies have already pointed out the prominence of the State and the municipality of São Paulo in relation to the creative sectors. In 2015, the Secretaria de Desenvolvimento Econômico, Ciência, Tecnologia e Inovação – SDECTI (São Paulo State Secretariat for Economic Development, Science, Technology and Innovation) elaborated a panorama of the creative economy of São Paulo, whose objective was to help in the "understanding of the more present creative activities in the State", making it possible to identify the regions of São Paulo in which each of the sectors had a more significant presence (2015, p. 13). The work employed the same methodology previously used by the Fundação do Desenvolvimento Administrativo – FUNDAP (Administrative Development Foundation), when in 2011, it analyzed the creative economy in the city of São Paulo (Caiado, 2011).
Two studies used the data from the Rais (Annual Social Information Report), from the MT (Ministry of Labor) to characterize the creative economy based on the number of establishments and formal employment. From the CNAE (National Classification of Economic Activities), 44 categories of creative economic activities were selected, divided into ten categories that served as the basis for the two analyses [1].
At least two other papers came out to characterize the Brazilian creative economy. In 2008, Sistema FIRJAN (FIRJAN System) launched the study A Cadeia da Indústria Criativa no Brasil (The Creative Industry Chain in Brazil), a work that was updated in 2011. In 2014, the Mapeamento da Indústria Criativa no Brasil (Creative Industry Mapping in Brazil) was launched after some methodological changes, and it started to analyze the optics of production and the labor market. The creative segments were aggregated into four major creative areas – consumption, culture, media and technology – and the creative industry, analyzed as a chain formed by three broad categories: creative industry (core), related activities, and support.
The estimated share of the creative economy core in the Brazilian Gross Domestic Product (GDP) reached 2.5% in 2010, corresponding to R$ 92.9 billion, of which R$ 47.9 billion are related to the value produced in São Paulo. When considering activities related to and in support of the creative core, the estimated value of the chain for 2010 as a whole was around R$ 667 billion for Brazil and R$ 235.3 billion for São Paulo. The result of the total chain was around 18.0% of the Brazilian GDP.
In 2013, the Instituto de Pesquisa Econômica Aplicada – IPEA (Institute for Applied Economic Research), published Panorama da Economia Criativa no Brasil (Panorama of the Creative Economy in Brazil), in which the creative industries were organized into four major groups: heritage, arts, media and functional creations, divided into nine subgroups. Considering the measurement of the creative economy in two dimensions – sectorial and occupational – and the high degree of informality of the Brazilian economy, the study adopted two strategies to adapt the creative fields to the existing databases.
In order to "characterize the labor employed in companies in creative sectors – sectorial cut – or workers in creative occupations – occupational cut-off", Rais was adopted and to measure the total universe of workers in creative economy (formal and informal jobs) the PNAD was used. From the creative sectors adapted to the CNAE and based on the PAS (Annual Survey of Services), from IBGE, the work estimated the added value (AV) "of the companies in creative sectors, in order to establish the participation of the creative economy in the AV and in the Brazilian GDP, and thus obtain an international benchmark" (Oliveira et al., 2013, p. 25). The estimated AV for the creative economy reached for Brazil the percentage of 1.7% of GDP in 2009, according to the IPEA´s study.
Internationally, several models have been presented with the aim of "providing a systematic understanding of structural characteristics in the creative industries". The UNCTAD report highlights four of them: the Department of Culture, Media and Sports – DCMS, United Kingdom; the one of the symbolic texts; the one of the concentric circles adopted by the European Commission; and the copyright of the World Intellectual Property Organization – WIPO. From specific logics, each model proposes different bases for the classification of the creative industries and, with the exception of the DCMS model of the UK, "assign a group of 'core' industries, that is, those whose inclusion is central to the definition adopted in each case" (2012, p. 6).
Following the above-mentioned expanded concept of creative industry adopted by UNCTAD and having as reference the mentioned works, the creative sectors of São Paulo presented in this article are structured in five groups: creative IT (software development and portals); media (publishing, printing and audiovisual); functional creations (advertising and marketing, architecture and design, fashion and creative R&D); arts (visual, plastic, written and performing arts) and heritage (museums and libraries). In the perspective of this study, these sectors constitute the core of the creative economy of São Paulo; however, in order to broaden the view on the segment as a whole, the present analysis also includes sectors considered complementary to core activities.
The inclusion of science and R&D in the creative economy is not yet a consensus, but this work follows the approach of UNCTAD which considers that "creativity and knowledge are intrinsic to scientific creations in the same way as they are to artistic creations". Another relevant issue concerns the inclusion of sport in the creative economy and, again following the UNCTAD report, which considers that sport "is more associated with training, rules and competitions than with creativity" (2012, p. 9), this study did not include it in the classification.
4. MEASUREMENT OF THE CREATIVE ECONOMY IN SÃO PAULO
When the core of the creative sectors is defined, the next challenge is to measure its contribution to the economy of São Paulo. This study proposes the definition of a productive chain that is associated with the creative sectors and complementary sectors composed by activities that, in some way, are linked to the first ones in two directions, aimed at elaborating an expanded analysis with the right importance. On the one hand, this is because these are fundamental links for their development and, on the other hand, because the services or products elaborated in the core are essential for carrying out the business of these sectors.
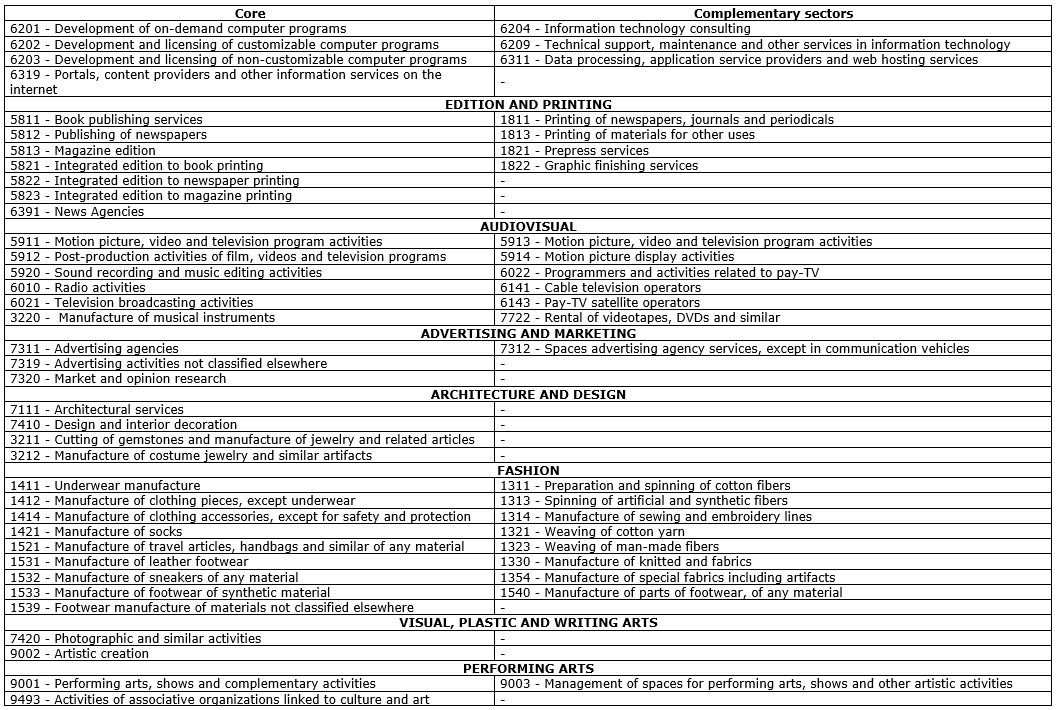
The analysis of the productive chain has the purpose of identifying the consecutive stages through which they pass and through which the creative products and services made available in the market are transformed or created. Table 1 details the creative sectors that make up the core and its complementary sectors from the CNAE 2.0. The productive chain of the creative economy of São Paulo can be analyzed with the distinction of two groups characterized by diverse relations.
One group adds the segments with manufacturing characteristics, with emphasis on fashion, both in the core and complementary sectors, two segments of the architecture and design sector and other two in editing and printing. The other group encompasses the typically creative services and product sectors whose chains are characterized by activities that intensively use these goods and services in their business as is the case with the creative IT group.
In the case of the audiovisual segment, the complementary sectors congregate the activities that are fundamental for the economic accomplishment of the creative material generated in the cinematographicand video production and television programs; and in sound recording and music editing. The chains of the advertising and marketing and performance arts sectors are restricted to the agents that operate in the management of advertising spaces (except media) and for performing arts, shows and other artistic activities.
The architectural, design, visual, plastic, and writing arts sectors are characterized by the provision of creative services that are more independently organized and, in many cases, especially in design activities, these services are often developed within companies of a wide range of economic sectors, whose inclusion would distort the measurement of the creative economy. As for architectural activities, something similar would happen if technical engineering services and technical activities involving a myriad of services that are not directly related to the "creative making" of the architecture were included as complementary sectors.
As the measurement of the creative economy is not a simple task given the specificities of the segment and the limitations of existing statistics for an initial characterization, this article proposes to measure it from two perspectives, taking the year 2014 as a reference. A first approach analyzes the chain of the creative economy of São Paulo from the point of view of added value and formal employment and a second approach is elaborated with a focus on the flow of international trade.
Table 1. Productive chain of the creative economy in São Paulo
4.1 The creative economy of São Paulo from the point of view of added value and formal employment
The economy of São Paulo is marked by the complexity and diversification of its production base, which translates into a 32.2% share of the Brazilian GDP in 2014, according to a calculation made by Fundação Seade (SEADE Foundation) and IBGE. In sectorial terms, there was a greater weight of services, with the State of São Paulo accounting for 33.4% of the product generated in Brazil, followed by the industry with 28.9%. In the national scenario, although the industry of São Paulo has lost its share over the years, the State continues to be the main industrial pole of the country and is responsible for the most modern portion of the Brazilian industry.
4.1.1 Added value
According to the information obtained by the PAS (Annual Survey of Services) and the PIA (Annual Industrial Survey), carried out by IBGE in 2014, the creative economy of São Paulo generated R$ 73.2 billion of added value (AV), 4.85% of the AV produced in the State. Its weight in the state economy can be estimated by the comparison with other economic sectors: the added value produced by the creative economy chain has reached more than a third of the AV of the manufacturing industry of São Paulo that was of R$ 212 billion, regarded as being ahead of important segments of the industry, such as food (2.26%), transport equipment (2.35%), machinery and equipment (1.41%). The performance of the creative economy was still well above that achieved by agriculture (1.67%), production and distribution of electricity, gas, water, sewage and urban cleaning (1.39%) and mineral extraction industry (0.92%). The participation of the chain was close to the results of construction (5.98%) and transportation, storage and mail segments (5.13%) (Table 2).
Table 2. Total added value of the creative economy and selected sectors State of São Paulo – 2014
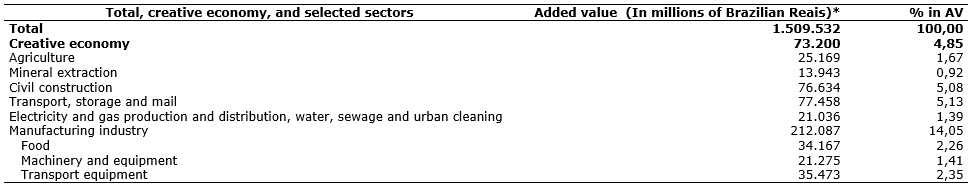
Source: IBGE (Brazilian Institute of Geography and Statistics); Seade Foundation. * In current amounts for 2014.
The most important group in terms of added value production was creative IT, with R$ 33.9 billion, which concentrated 46.4% of the chain's AV, the equivalent of 2.25% of State total (Table 3) within the whole of the creative economy. It is no coincidence that the creative IT group is the main sector of the creative economy of São Paulo in terms of added value generation. The emergence of Information and Communication Technologies (ICTs) at the outset and the advancement of the internet combined with the latest digitization processes are crucial links for understanding the production and consumption of creative services and products.
Visual arts, music, shows, book and magazine publishing, and audiovisual production are examples of products and services that can be scanned, copied and refurbished on business platforms. This fact expands the market and places it in another condition within the creative economy with relevant effects on "traditional cultural expressions". Another segment that has also been suffering transformation with the development of ICTs is advertising and marketing, with the expansion of its capacity to evaluate the market in a fast and focused way through innovative technologies. Interactivity becomes the guiding line between companies and consumers, shaping new shared forms of consumption and investments.
Table 3. Added value of the productive chain of the São Paulo creative economy State of São Paulo – 2014
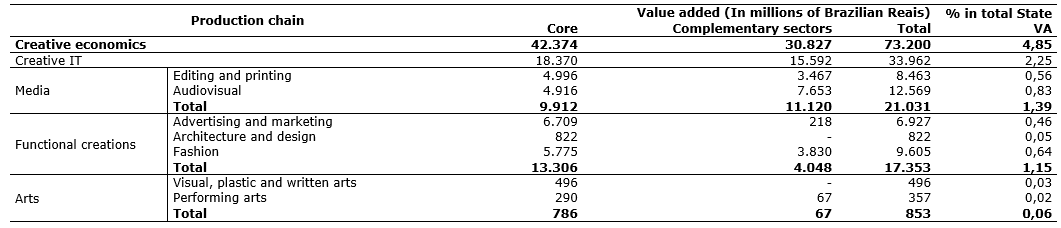
Source: IBGE (Brazilian Institute of Geography and Statistics); Seade Foundation.
In the last 25 years, the economic space of São Paulo has become a reference in the offer of services and in conducting business in the country, attracting the main companies in the ICT sector to the region. The specific importance of software development activities, core of the creative IT group in the State of São Paulo, is clear for its participation in the generation of added value: it was R$ 18.4 billion in 2014, 56.7% of the total Group (Graph 1). The complementary sectors of the productive chain of this group also have an expressive presence in the economic space of São Paulo, with the generation of an AV of R$ 15.6 billion.
Graph 1. Added value of creative IT group Core and complementary sectors State of São Paulo - 2014
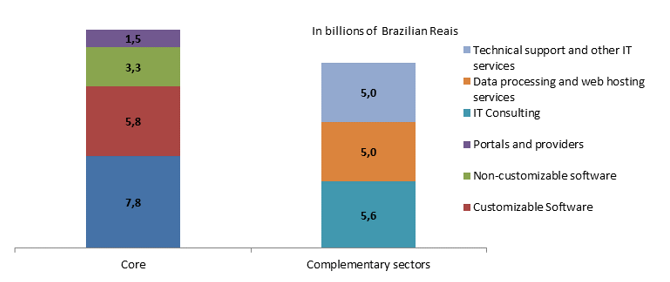
Source: IBGE (Brazilian Institute of Geography and Statistics); Seade Foundation.
The second group in importance in terms of added value was the media that generated an amount of R$ 21.0 billion in 2014, 1.39% of the total State AV. The two core sectors totaled R$ 9.9 billion, R$ 4.9 billion for each of them. Complementary sectors generated an AV of R$ 11.1 billion, higher than that produced by the creative sectors due to the performance of the audiovisual segment, with special emphasis on cable TV operators (Table 3).
The development of the audiovisual segment in recent years was due to the combination of government initiatives with greater interest of the distributors and the television channels by the national production, due to at least three factors: In 2006, the federal government created the Fundo Setorial do Audiovisual – FSA (Audiovisual Sector Fund) and started to invest directly in the productive chain of the sector; in 2011, Law 12,485 entered into force, which established that pay-TV channels must gradually link up to 3½ hours of national programming per day by 2014; and finally, the greater interest of distributors and cable TV channels investing in national productions to get closer to the Brazilian public.
The creative services associated with TV and film activities generated an added value of R$ 12.2 billion in 2014, 97.0% of the AV in the audiovisual sector. The distribution of these services between the core and the complementary sectors showed that the cable TV operators (complementary sector) had a much higher capacity to generate AV compared to the activities of open TV (core): R$ 6.6 billion against R$ 2.7 billion.
In relation to the publishing and printing sector, from the R$ 8.5 billion added value generated in 2014, R$ 4.9 billion (57.7%) focused on the creative sectors of edition and integrated edition to the printing of books, magazines and newspapers, activities characterized by intellectual creation and usually protected by copyright (Table 3). The portion of the complementary sectors added R$ 3.5 billion. This trend of higher AV in the creative part of the publishing and printing sector tends to accentuate from the expansion of the online versions of books, magazines and periodicals.
The functional creations group constitutes the third set in terms of participation in the total added value of the State of São Paulo. These activities produced R$ 17.3 billion AV in 2014 (1.15% of the total State AV), with 55.3% in the fashion sector (R$ 9.6 billion), 39.9% in advertising and marketing (R$ 6.9 billion) and 4.7% in architecture and design (R$ 822 million) (Table 3).
There is an important content difference in the definition of the fashion industry point of view in terms of its insertion in the creative economy. The distinction between the fashion industry and the clothing industry, elaborated by Chilese et Russo (2011), states that, in the first case, the design and production of goods of high cultural and symbolic content is contemplated and in the second, the production focuses on the fabrication of basic clothing material. Thus, the emphasis on the definition of fashion takes place in the design, innovation, symbolic load inscribed in the creation and in the relationship between the creator and the sociocultural context in which it is inserted.
The participation of the Brazilian textile and clothing sector in world production is not negligible. According to information from the Associação Brasileira da Indústria Têxtil e de Confecção – ABIT (Brazilian Textile and Apparel Industry Association), in 2012, Brazil was the 5th country in the world ranking of textile production and the 4th in the manufacture of garments with 2.7% and 2.5% of global production, respectively. Despite this performance, this industry's insertion in international trade is low: 0.5% of total global exports and 23rd place in the ranking of exporters.
The information of the PIA (Annual Industrial Survey) does not allow separating the fashion industry from the one of the clothing; however, the tendency is that these two industries increasingly connect. In this sense, it was opted to analyze the fashion sector as a whole, segmenting its production chain into core and complementary sectors.
From the survey data, fashion is the third sector in importance in terms of the generation of added value in the creative economy of São Paulo, with 0.65% of the total State in 2014, distributed as follows: R$ 5.8 billion in the core and R$ 3.8 billion in the complementary sectors. At the core, the segment of clothing that generated an added value of R$ 3.22 billion stands out; as for the complementary sectors, the weaving of yarns and special fabrics and finishes were the main highlights with R$ 1.4 billion and R$ 1.2 billion of AV, respectively.
Advertising and marketing is an activity in which creativity is the main inducing factor of value generation, permeating the entire creative economy. In relation to creative IT, advertising uses computerized systems of databases and software to carry out market research and opinion surveys. The advertising interface with the media group takes place in two directions; on the one hand, it is a demander of audiovisual and publishing and printing services for the production of commercials and advertising materials and, on the other, it generates financial resources to support open and subscription TVs, through remuneration for the linkage of advertising material (media and print). Resources from advertising investments are a source of programming purchases in pay TV and finance the production of an authorial nature, which allows new experiences and the development of talents in various sectors of the creative economy, including arts, music and alternative TV (ABAP, 2016).
The main segment of the core in terms of added value generation was advertising agencies in 2014, with a volume of R$ 3.3 billion (0.44% of total State AV), followed by other advertising activities, which brings together sales promotion, direct marketing, fairs and exhibitions, and advertising and marketing (except advertising agencies) consulting, which recorded an AV of R$ 2.4 billion.
The architectural and design activities complement the group of functional creations, having produced R$ 822 million of added value (0.05% of the total AV of the State) in 2014. It should be noted that the weight of these activities in the economy of São Paulo is underestimated, a fact explained by the logic of the production of these services, present in companies in other sectors, such as in construction companies, in the case of architecture, or in areas such as automobile, fashion, aeronautics, in the case of design. Thus, an important portion of these services is not captured, underestimating the added value produced by these activities.
The group of arts completes the whole of the creative economy of São Paulo. The total of these creative activities added R$ 853 million of added value, 0.06% of the total AV of the State in 2014. The main sector was visual, plastic and written arts, with R$ 498 million (Table 3). Similarly to the activities of architecture and design, this group presents a relative underestimation in terms of the generation of added value, since there is a high degree of informality in these activities.
4.1.2 Formal employment
Based on the data from the Rais (Annual Social Information Report) of the MT (Ministry of Labor), the labor market analysis of the São Paulo creative economy also faces a limitation insofar as it only provides information on formal employment. Given the aforementioned degree of informality of these activities, especially the arts group, this perspective provides a partial view of the labor market as a whole of the creative economy of São Paulo.
With 67.3% of formal jobs, the creative sectors of the core concentrated just over 451,000 jobs in 2014, 3.2% of the approximately 14.1 million formal jobs in the State of São Paulo. Graph 2 shows the decisive weight of the fashion segment in generating creative jobs (46.8%), followed by creative IT groups (20.7%) and advertising and marketing (10.1%).
Graph 2. Distribution of formal employment in the core of São Paulo's creative economy State of São Paulo - 2014
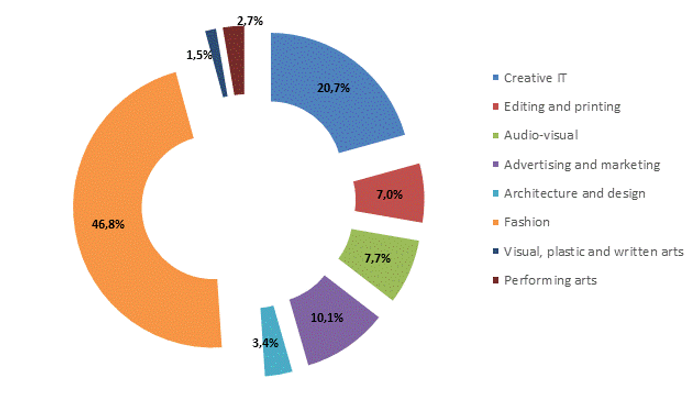
Source: MT (Ministry of Labor). Rais (Annual Report of Social Information).
The creative economy is commonly referred as above average wage payer, but in the São Paulo chain this does not occur due to the weight of fashion. With average income well below the other sectors, the segment exerts decisive influence in the calculation of the amounts paid, especially in the core of the creative economy of São Paulo. In 2014, the average income paid at the core was R$ 2,715.87, close to the amount paid for all formal jobs in the State of São Paulo (R$ 2,740.42) (Table 4). If the fashion sector is excluded from the calculations, the average income reaches R$ 3,839.59, significantly above the payment in the State.
The group that pays the highest values is the creative IT, with much higher average incomes compared to the State in both core and complementary sectors. The segment with the highest value is the consultancy in information technology, in the complementary sector, R$ 6,240.50. At the core, the segments with the highest incomes are the development and licensing of non-customizable computer programs (R$ 5,154.25) and portals, content providers and other information services on the Internet (R$ 5,015.12).
Table 4. Formal employment and average income of the creative economy State of São Paulo – 2014
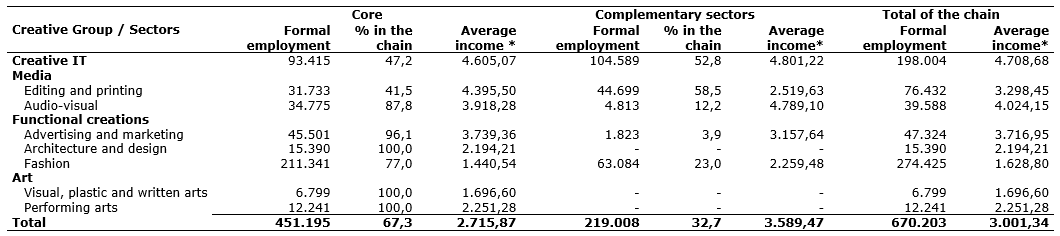
Source: MT (Ministry of Labor). Rais (Annual Report of Social Information). * Nominal amount.
The media group concentrates the two sectors with higher incomes, after the creative IT group. The core of the publishing and printing segment is the second with the highest values, with emphasis on the revenue from editing integrated to the printing of magazines, well above all other activities (R$ 5,929.01). In the audiovisual sector, the situation is reversed, highlighting two segments of the complementary sector: cinematographic, video and television programs (R$ 10,521.82) and programmers and activities related to pay TV (R$ 8,228.10).
The differences are smaller between the core and complementary sectors in the advertising and marketing sector. In the first, the highest income is paid by the advertising agencies segment (R$ 5,825.42) and in the second by market research and public opinion (R$ 4,846.46).
The other sectors – architecture and design, visual arts, plastic and written arts, and performing arts – both at the core and in the complementary segments, pay average incomes lower than what is paid in the State of São Paulo, and it should be emphasized that, especially in the arts group, smaller incomes must be influenced by the high informality of the sector.
3.2 The creative economy of São Paulo from the point of view of the flow of international trade
In order to meet the challenge of assessing the creative economy at the global level, allowing a comparison basis between all UN Member States, UNCTAD has developed a measurement of the flow of international trade. To achieve this objective, a "comparative analysis of current methodologies used for statistics on creative industries was undertaken, taking into account the new UNESCO 2009 structure for cultural statistics, as well as the work of other international institutions and individual countries on this issue" (2012, p. 95). This work of standardization and homogenization of concepts resulted in the proposition of complementary measures to improve the collection of world trade statistics of the creative industries, thus allowing governments and countries to develop tools for comparative analysis capable of supporting their policies of incentives to the sector.
The great challenge faced by UNCTAD in the construction of this parameter ran up against two basic difficulties. On the one hand, international trade statistics were developed on the basis of transfers of physical products and, on the other hand, the guiding principle of the creative economy concept, its immaterial basis, founded on intellectual property law was not suited to these statistics, thus it is necessary to create new metrics to capture these flows [2].
After exhaustive comparisons and compatibleness of the available statistics, and considering their different stages according to the level of economic development of the different economies, UNCTAD defined a set of representative activities of the creative economy common to most Member States of the United Nations. This definition is equivalent to the creative sectors contemplated in the aforementioned five groups [3], making it possible to measure their value in the international trade chain and to verify the enchainment within that chain.
The measuring result of this worldwide trade flow was US$ 592 billion in 2008, compared to US$ 267 billion generated in 2002, corresponding to a growth rate of 14%/year, according to UNCTAD. Developed countries accounted for 56% of this trade flow in 2008, compared to a 62% share in 2002. This loss of share was due to the faster growth of developing countries in this trade flow. The magnitude of these values, as well as their rate of growth, highlight the importance of the creative economy as a dynamic activity and is capable of promoting a more inclusive development among nations. In the statistics presented by UNCTAD, Brazil did not stand out in the Latin American context, or among the developing nations.
The importance assumed by intangible services in international trade and the need to better capture this information in national accounts led the Brazilian government to include, within the scope of the Plano Brasil Maior (Greater Brazil Plan) 2011, the Nomenclatura Brasileira de Serviços Intangíveis e Outras Operações que Produzam Variações no Patrimônio – NBS (Brazilian Nomenclature of Services, Intangibles and Other Operations that Produce Variations in Shareholders' Equity). This classification obeys international technical standards, in particular the United Nations Central Product Classification – CPC, used in international negotiations involving the purchase and sale of these services.
This standard is used to record all operations of sale and purchase of services in the Siscoserv (Integrated System of Statistics on Trade of Foreign Services, Intangibles and Other Operations that produce Variations in Equity). This system, together with NBS, constitutes an important working tool for the Brazilian government regarding the formulation, monitoring and improvement of public policies aimed at stimulating foreign trade in services and intangibles. The information on foreign trade, captured by NBS and systematized by Siscoserv, became available in 2012 and statistics on sales and purchases made by the creative economy of São Paulo are presented on this article, referring to the services classified by NBS for 2014.
According to information from Siscoserv, the Brazilian international flow of services was US$ 20.8 billion in sales and US$ 48.5 billion in acquisitions, especially in sales, for waterborne shipping and cabotage and container handling; and in acquisitions, for leasing services of machinery and equipment and ships.
The economy of São Paulo accounted for 60% of sales and 34% of purchases made by Brazil captured by this system. Considering the set of services classified as belonging to the creative economy, the State of São Paulo stood out in the national scenario, accounting for 65% of sales and 60% of purchases made by the Brazilian economy. According to data from Siscoserv, the creative economy of São Paulo sold US$ 3.1 billion and the first 10 services of this type accounted for 85% of the total value, which represented 5.1% of the Gross Value of Production (VBP) from the whole of the creative economy, calculated on the item over the added value. In addition to IT creative services and advertising and marketing, these two categories accounted for 39% of these sales. The largest share in this area was the item “other professional, technical and managerial services” not classified in the previous subheadings; however, this classification does not allow us to know what is included in this heading (Table 5). When analyzing the agenda from the perspective of the acquisitions, there is a performance similar to that of the sales: among the 10 most important services of the list of acquisitions, the services of creative IT and advertising and marketing stood out.
Table 5. Total sales and purchases of the creative economy, according to their services Brazil and State of São Paulo – 2014
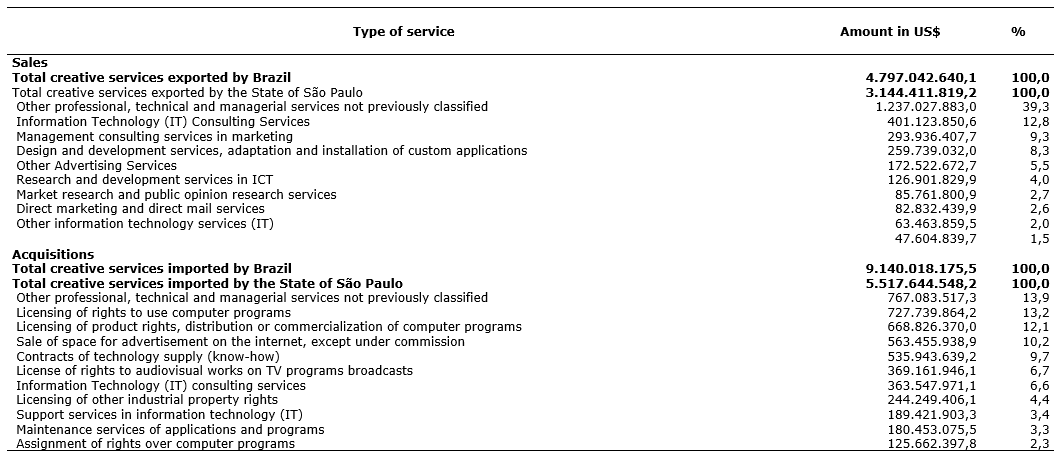
Source: MDIC (Ministry of Development, Industry and Foreign Trade)/Siscoserv.
It is noteworthy that the most important item on the list of creative services exports from both São Paulo and Brazil is classified as "other". One possible explanation is perhaps due to the recent implementation of the NBS, thus accentuating the need for improvement and further clarification in the system for capturing and classifying statistical information concerning the creative economy. Given the importance of this item, an investigation in Siscoserv is necessary to better qualify these activities.
In net terms, the trade flows of the creative economies of São Paulo and Brazil are deficient in US$ 2.4 billion and US$ 4.3 billion, respectively. In this sense, the creative economy presents the same negative pattern of the Brazilian balance of payments, especially in those with greater technological content. Despite this pattern, the performance of creative IT sales and advertising and marketing seems to point to a path to be encouraged in the creative services export agenda.
5. FINAL CONSIDERATIONS
Based on the UNCTAD 2010 Creative Economy Report and country studies on the theme, this study traced the contours of the creative economy chain in São Paulo and sized it up in 2014. In this measurement, the added value of the sectors that integrate the core reached R$ 48.4 billion, which represented 2.8% of the overall AV of the São Paulo economy, a percentage that was lower than the estimates for São Paulo of the core defined by the FIRJAN System for 2010 (3.7% of GDP). It should be noted, however, that the measured sets present significant differences [4]. The results obtained for the chain indicate that its sectors constitute an important set of activities of the economy of São Paulo, generating 4.8% of added value and 3.2% of formal employment in the State, besides having a prominent position in the export agenda with sales of US$ 3.1 billion.
It should be remembered, however, that some segments that are part of the creative economy, such as heritage (museums and libraries) and research and development (creative R&D), were not included in the study tabulations because they were not addressed in the studies and surveys that were used. Thus, new research and analysis that include these sectors should be carried out, as well as other perspectives that can be explored for the study of the informal labor market or of occupations’ characteristics of creative activities, but which are present in several activities, as for example, design and architecture. In relation to the international trade flow, a first step would be to investigate the composition of the item "other technical and managerial services" given its importance in the São Paulo economy. Finally, given its specificities, it would be necessary to develop new metrics to capture these activities.
In a world scenario that challenges the continuous construction of new paths for the conquest and maintenance of markets and thanks to the dynamic character and capacity to generate employment and income, the incentive to the development of the creative economy becomes an option for the recovery of economic growth. The creative economy should thus become a central theme in the concerns of different levels of government when defining public policies aimed at stimulating development.
In view of the aspects reported, the continuity proposal of the investigation agenda contemplates, among others activities:
- The identification of sources that allow the measurement of the segments that were not envisioned in this study (heritage and R&D).
- The deepening of the study of the work market, investigating new possibilities for the incorporation of its informal character, in addition to specific work on occupation characteristic of the creative activities.
From this contribution effort so that the advance of the creative sectors gains space in a resumption context of the State development, the final objective that guides this work is one of structuring, at the Seade Foundation, of an Observatory of the São Paulo Creative Economy. This observatory would contribute to the production and dissemination of research, methodologies, data, and information on the creative economy capable of providing support to the formularization, implementation and monitoring of public policies turned to the stimulation of their different sectors. Moreover, the observatory would fulfill the function of being a space aimed to facilitate the communication of the different actors related to the São Paulo creative economy.
REFERENCES
Associação Brasileira da Indústria Têxtil e de Confecção (2012), O poder da moda: cenários, desafios, perspectivas, ABIT, São Paulo, SP.
Associação Brasileira da Produção de Obras Audiovisuais (2016), Mapeamento e impacto econômico do setor audiovisual no Brasil, APRO/SEBRAE, São Paulo, SP.
Associação Brasileira das Agências de Publicidade (s/d), O impacto da publicidade na economia do Brasil, ABAP, São Paulo, SP.
Caiado, A. S. C. (Coord.) (2011), Economia criativa, FUNDAP, São Paulo, SP.
Centro de Estudos Internacionais sobre Governo (s/d), Produto I: Revisão de modelos existentes e contribuições teóricas para a conta satélite de cultura, fundamentando opções metodológicas, UFRGS, Porto Alegre, RS.
Chilese, E. et Russo, A (2011), “Urban Fashion Policies: Lessons From The Barcelona Catwalk”, citado in Ministério da Cultura, Pesquisa Economia e cultura da moda: perspectivas para o setor, Ministério da Cultura, Brasília, DF.
Goldenstein, L. et Goldenstein, S. (2015), São Paulo, estado e capital: fundamentos para um novo paradigma de desenvolvimento, Mimeo.
Instituto Brasileiro de Geografia e Estatística (2013), Sistema de Informações e Indicadores Culturais 2007-2010, IBGE, Rio de Janeiro, RJ.
Ministério da Cultura (2011), Plano da Secretaria da Economia Criativa: políticas, diretrizes e ações, 2011-2014, Ministério da Cultura, Brasília, DF.
Oliveira, J., Araújo, B., Silva, L. (2013), Panorama da economia criativa no Brasil, IPEA, Rio de Janeiro, RJ.
Secretaria de Desenvolvimento Econômico, Ciência, Tecnologia e Inovação (2015), Primeiro Diagnóstico para Elaboração do Plano Estratégico de Economia Criativa do Estado de São Paulo, SDECTI, São Paulo, SP.
Sistema FIRJAN (2014), Mapeamento da indústria criativa no Brasil, Sistema FIRJAN, Rio de Janeiro, RJ.
UNCTAD (2012), Relatório de economia criativa 2010: economia criativa uma opção de desenvolvimento, Secretaria da Economia Criativa/Minc, Brasília, DF, Itaú Cultural, São Paulo, SP.
[1] The work also provided information and estimates on informal employment in the creative economy, based on data from the PNAD (National Household Sample Survey), of the IBGE (Brazilian Institute of Geography and Statistics), which will not be carried out in this analysis.
[2] For an understanding and detail of this discussion, see UNCTAD (2012), chapters 4 and 5 especially.
[3] The item royalties and license fees, which was initially included, was withdrawn from the final classification due to operational difficulties, since it was practically impossible to separate those payments that, in fact, referred to the creative economy.
[4] Different from the chain measured in this article, the study of the FIRJAN System includes activities of biotechnology, R & D, museology, historical heritage, handicrafts, folklore and gastronomy in the core of the creative industry.
Received: 27 Jul 2017
Approved: 11 Jun 2018
DOI: 10.14488/BJOPM.2018.v15.n3.a1
How to cite: Adduci, C. C.; Araújo, A. R. F.; Novais, L. F. (2018), “The creative economy in the State of São Paulo”, Brazilian Journal of Operations & Production Management, Vol. 15, No. 3, pp. 343-354, available from: https://bjopm.emnuvens.com.br/bjopm/article/view/368 (access year month day).