Applying the smart city philosophy in Brazil for improving urban traffic condition by agent-based simulation
Wilson Inacio Pereira1, Leonardo Chwif1
1 Industrial Engineering, Mauá Institute of Technology
Abstract
Urban mobility improvement as part of smart city philosophy is an extreme importance issue in large urban centers, mainly for its influence over economic and social development. The main objective of this work is to develop a mobility study of automotive vehicles in Goiás Avenue, the main avenue of São Caetano do Sul, Brazilian city with the highest Human Development Index (HDI). Three alternative scenarios for traffic improvement were studied using an agent-based simulation model: Speed Reduction, Green Wave Implementation and a mixed scenario that combines these two approaches. The main results evaluated were average vehicle crossing time, average time spent in queues and total number of vehicles that leave the system during rush hours. It was concluded that, among the proposed scenarios, a mixed one should be implemented as it has favorable results in all of the studied performance indicators and maximizes the benefits generated by the other two scenarios. It is expected that the results of this study will serve to encourage further research in this area and give continuity to the idea of a digital city.
Keywords: Agent-Based Simulation; Vehicular Traffic; Urban Mobility; Smart City.
1 Introduction
Urban mobility, according to Kneib (2012) is the displacement capacity of people and goods in cities, whose intervening variables, however, are as complex as the variables that make up the city itself. For Vaccari et Fanini (2011), urban mobility is an attribute associated to people and economic actors in urban environment that, in different ways, seek to meet their shifting needs for performing daily activities such as work, education, health, leisure, culture, etc.
Costa (2013) states that the sustainability of urban mobility is given by the ability to make the necessary trips with the lowest possible energy expenditure and the lowest impact on the environment, as the realization of citizens' rights.
2 Problem statement
A survey conducted in 2014 by the Brazilian Institute of Geography and Statistics (IBGE - I_nstituto Brasileiro de Geografia e Estatística_, 2014) pointed out that the metropolitan region of São Paulo, where São Caetano do Sul is located, is the leader in terms of urban flow and its population is constantly on the move. According to this survey, based on the 2010 Census, the reason for this intense migration is the big distances traveled by citizens to get to their job locations and educational institutions.
São Caetano do Sul currently has the highest Human Development Index (HDI) among all of Brazilian counties. A high HDI could have an effect in terms of the smart city philosophy, since the aim of this philosophy is "to deliver more effective and efficient public services that improve living and working conditions and create more sustainable urban environment” (Ballon et. al. 2011). As a consequence of this fact, a large number of people migrated to São Caetano do Sul. The 2014 Brazilian's Vehicle Fleet Report (IBGE, 2014), developed in partnership with the National Traffic Department (DENATRAN - Departamento Nacional de Trânsito) points out that São Caetano do Sul is the Brazilian city with the highest rate of motor vehicles per inhabitant: 99,000 passenger vehicles for a population of 156,000 inhabitants - an average of two vehicles for every three inhabitants.
São Caetano do Sul's inhabitants are affected by urban mobility and also by the lack of synchronization between the traffic lights of neighbor cities, as the city serves as passage for vehicles from surroundings cities towards São Paulo (bigger city in this area) and has a land area of just 15 square kilometers. It was determined that the study focus of this work would be the Goiás Avenue, one of the main thoroughfares of the city and considered its major financial center (Figure 1). The avenue is four kilometers long with six traffic lanes, three in each direction: São Paulo-Santo André and Santo André-São Paulo, besides connections with secondary routes.
Figure 1. Goiás Avenue
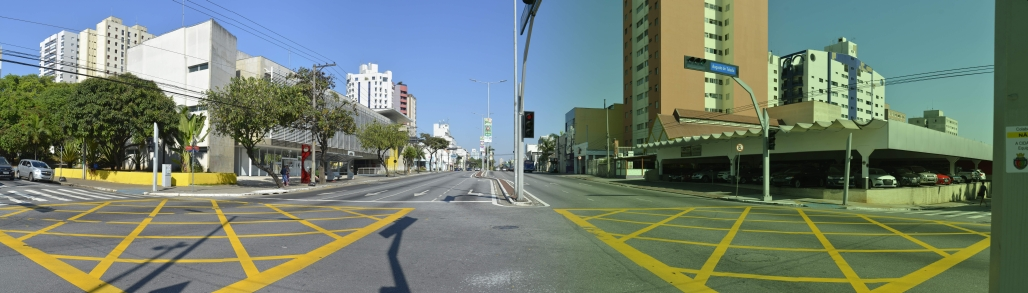
It was decided that the time period to be studied in this project would be the days of increased use of the route (Monday to Friday), from 4:00 pm to 8:00 pm (rush hour).
The simulation model would only consider the traffic of cars, not trucks, buses, motorcycles, bicycles, and pedestrian flow or their interactions with the avenue. Along the simulation, vehicles presented the following behaviors: move forward, turn right, turn left or stop, maintaining a safe distance to vehicles ahead.
To establish the simulation model detail level, meetings were held between São Caetano do Sul's Urban Mobility Secretary (SEMOB - Secretaria Municipal de Mobilidade Urbana) and the project team to answer questions and obtain relevant data.
3 Literature review
Vehicular Traffic
According to Sampedro et Campos (2006), the traffic itself is made up of the constant interaction between people, drivers and vehicles on urban roads.
According to Ghali et Smith (1995), a simple control of urban traffic is not enough to reduce congestion, since the number of cars purchased increases every day and vehicular traffic control is a very complex activity, because in addition to its dependency on road infrastructure, it requires a strategy well defined by the responsible departments and comprises various elements in its system, such as vehicles and pedestrians. One method that can be used as a tool for decision making regarding traffic and its alternatives is simulation.
Simulation and Urban Mobility
Simulation is an increasingly used tool for vehicular traffic study and it can be considered a tool towards Smart City Philosophy. That is because, particularly in Brazil, traffic simulation studies are relatively rare and a smart city concept is related to a commitment to innovation in technology (Nam et Pardo, 2011).
In a general way, simulation makes it possible to analyze a large amount of dynamic problems, often associated to a complex process that can be described analytically (Lieberman et Rathi 1997).
According to Wu et Florian (1994), vehicular traffic modeling is a research area where the theoretical results and empirical studies are relatively scarce. The authors treated the Assignment Problem for Transit Balance (Transit Equilibrium Assignment Problem - TEAP), where the choice of passengers in a transit network is subject to congestion. The road user behavior is modeled using the concept of strategy in a defined network.
Agent-Based Simulation
According to Samuelson (2005), agent-based simulation can be defined as a kind of simulation that involves operations research principles, artificial intelligence, network theory and cognitive sciences. The central idea is to expand the traditional simulation theory to include entities whose behavior varies with time or environmental conditions.
Agent-based simulation has its theoretical basis in Discrete Event Simulation and System Dynamics. Sakurada et Miyake (2009) states that the Santa Fe Institute developed the first computational package designed for simulating agents, called SWARM.
Macal et North (2005) explains that the agent-based simulation can be considered a new modeling paradigm for next-generation system designs, since it allows entering a high degree of individualization, autonomy and agents interactivity.
According to Swain (2007), agent-based simulation is suitable to be used in vehicle traffic simulations where driving behavior is affected by local conditions and by drivers’ knowledge of alternative routes, influencing the decision of route changes due to congestion. The author also claims that air traffic simulations, as crowd and pedestrian flows are potential applications to agent-based simulation.
Simulation agents, when applied to automobile traffic, can be classified as: (i) microscopic, when vehicles are treated individually and move in accordance to the car-following behavior (Astarita, 2001), (ii) macroscopic, when the traffic stream is analyzed as a whole and (iii) a mixed approach, containing microscopic and macroscopic characteristics (Boxill et Yu 2000). This study used microsimulation approach, wherein the agents’ (vehicles) behavior was based on predetermined rules.
4 Model Building
Input and Output Data
The main input data to simulation model regarding speeds and physical dimensions, gathered with SEMOB, are summarized in Table 1.
Table 1. Input Data
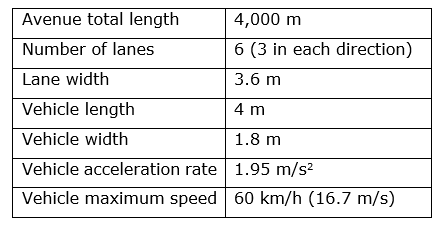
To define vehicle input and output rate at Goiás Avenue, as well as its distribution over time, video cameras were placed at the beginning and at the end the avenue. Shooting in peak hours, from 4:00 pm to 7:00 pm, three days in a row, 9 hours of recording was obtained. Then, the total count of passing vehicles in 15 minute time slots was considered as input data. Since there was no adherence to common discrete distributions, it was defined that the Poisson distribution would be the best choice to represent traffic behavior (total vehicle count). It is known that this distribution is highly applied to represent vehicle arrival rate in a traffic stream, because of arrivals independence. Thus, two average values were obtained: 26.7 vehicles per hour in Santo André-São Paulo direction and 18 vehicles per hour in the opposite direction (São Paulo-Santo André).
To model input and output flow between Goiás Avenue and cross streets (10 in each direction), historical data (in terms of percentage) provided by SEMOB were used.
Output data of interest are: average vehicle crossing time, average waiting time in traffic lights and total count of vehicles leaving the system (avenue) after the simulation period (4 hours).
Model Development
The simulation model was developed with the academic version of Anylogic® software. The model building process was divided in five stages.
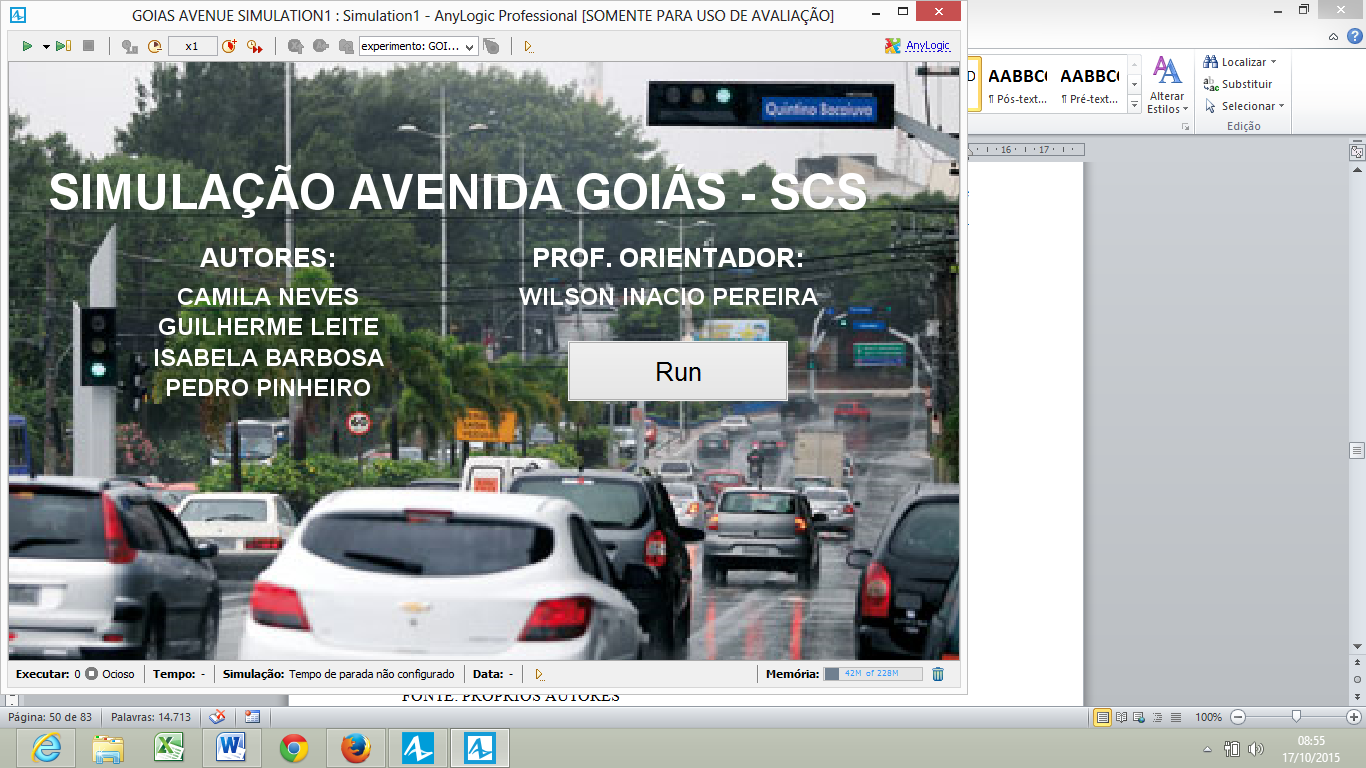
Stage 1: Simulation presentation screen development. This stage aims to create an interface with the user, which is always shown when simulation starts. Besides being a welcome screen to the user, with information about the project’s developers, the presentation screen also acts as a simulation control panel, allowing the user to define the preferred visualization mode: 2D model, 3D model or logical. Figure 2 shows the project's presentation screen.
Figure 2. Presentation Screen
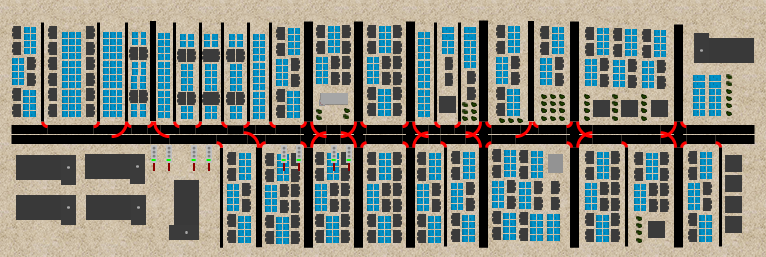
Stage 2: Simulation model building. It is known that, in some specific points along its length, Goiás Avenue has curves. For the simulation model development, these curves were not considered due to the high implementation difficulty. Thus, the whole length of the avenue was adapted to be represented as a straight line. In terms of Anylogic® objects, the three traffic lanes in each direction are represented by a line, which is connected to other lines by arc objects. An arc is necessary in every crossroad, to allow right or left turns and to represent a traffic light, where vehicles may stop. Figure 3 depicts a view of these objects in the 2D model visualization mode.
Figure 3. 2D Model Visualization
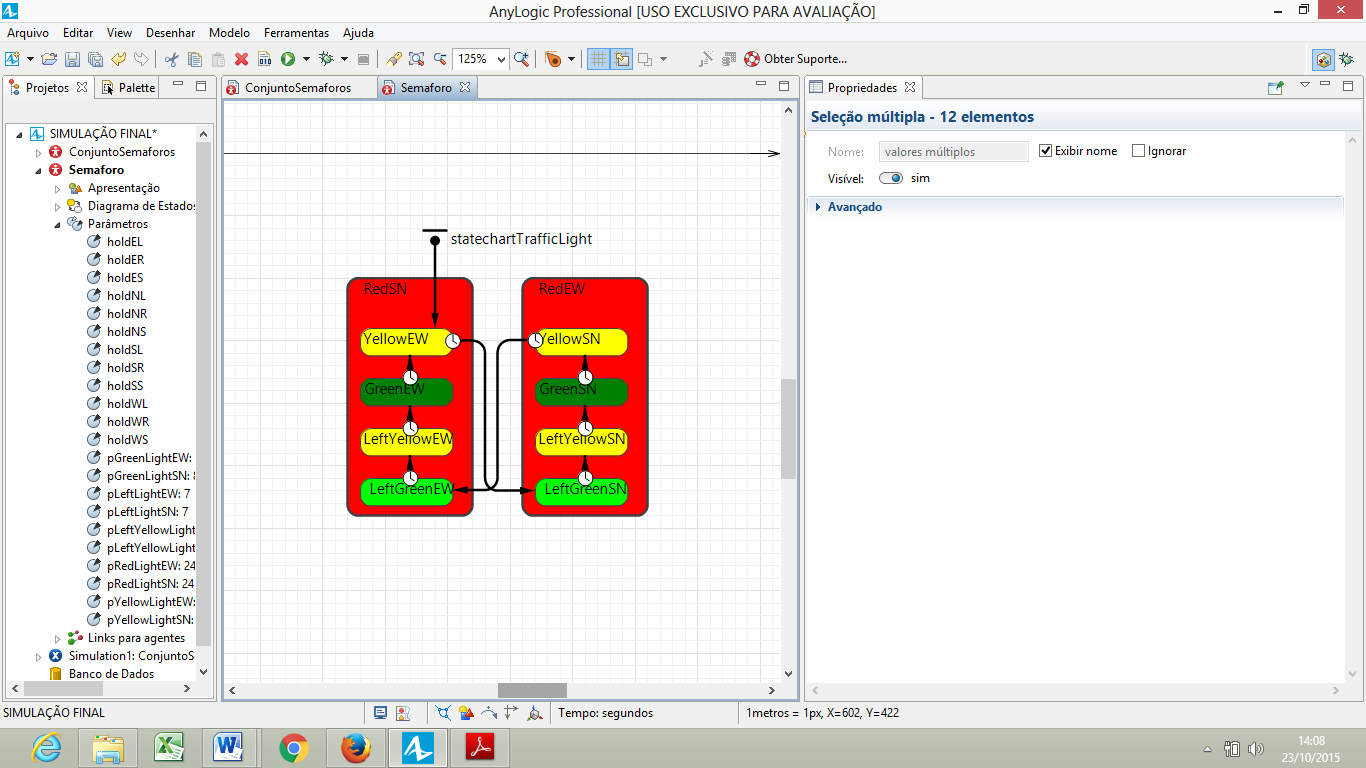
Stage 3: Integration of traffic lights in the model. Each one of the 11 traffic lights in the simulation model was represented by a statechart object, which defines the behavior of any incoming vehicle. An example of one of the statechart objects used in the model is shown in Figure 4.
Figure 4. Statechart Object
Stage 4: Insertion of agents in the simulation model. According to the project scope, this simulation model considers only one type of agent (vehicles), comprised by six elements (CarSource, CarMoveTo, Split, Queue, Hold and CarDispose), as can be seen in Figure 5.
Figure 5. Example of an Agent Logical Behavior
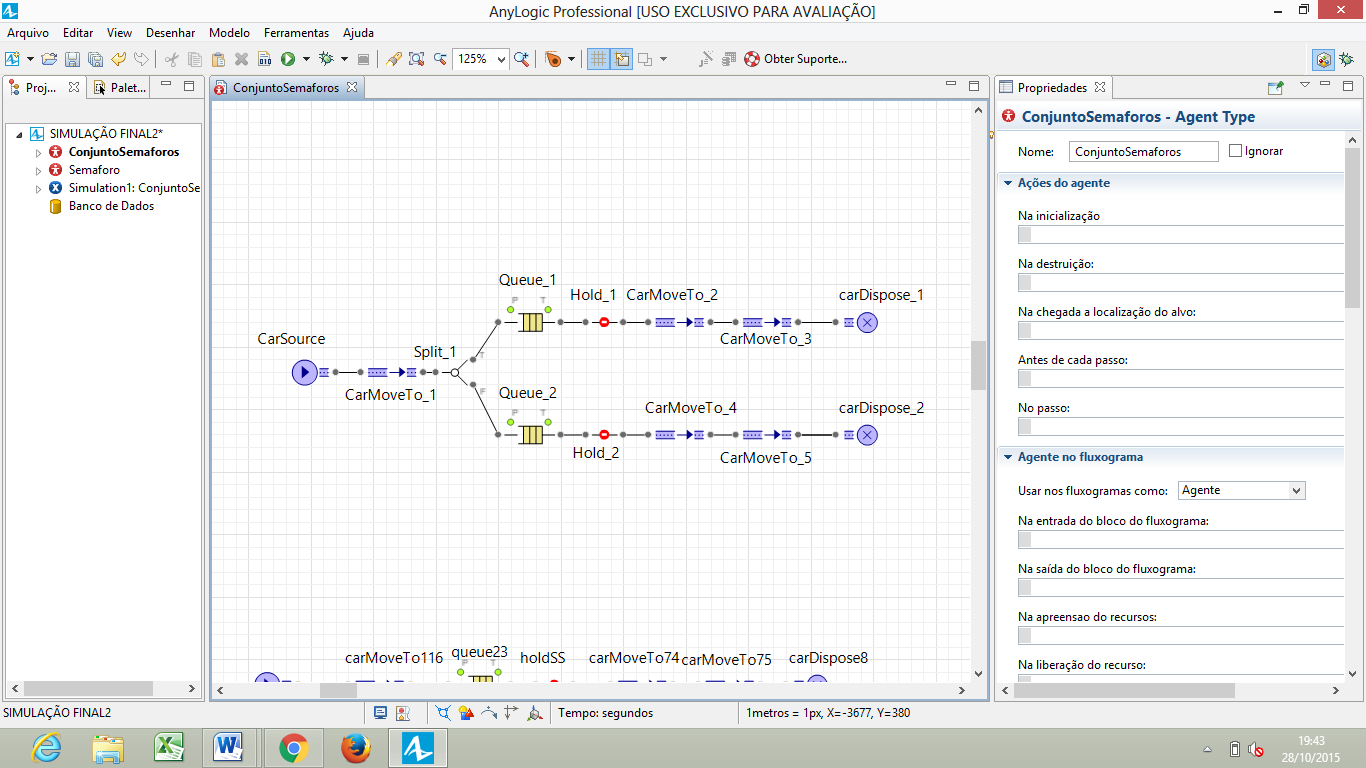
The CarSource object represents the entrance of vehicles in the avenue (line). The average arrival rate, the entrance lane (among three available), vehicle length and width, maximum speed, acceleration and slowdown rate as well as the minimum safe distance to the vehicle ahead are defined in this object (linearly calculated as a function of the maximum speed). As the vehicle enters a line, the MoveTo object makes it move to the next line. The Split object decides whether the vehicle will move forward or make a turn in a crossroad. The Queue object ensures that the vehicles will slow down before a turn and wait in line if stated by the traffic light, associated to the Hold object. Finally, the CarDispose object ends the logical sequence defined for each agent. Specific details about all objects’ configuration will not be discussed in detail here.
Stage 5: Consolidation about the information of simulation through a RoadNetwork configuration. This last stage of simulation model development consists in a consolidation of lines, arcs, agents and traffic lights, allowing total management of model's properties.
Computational Model Verification
Three techniques were used during the verification stage of the computational model. Firstly, we used the modular programming technique, building and simulating only small blocks at a time before building the other.
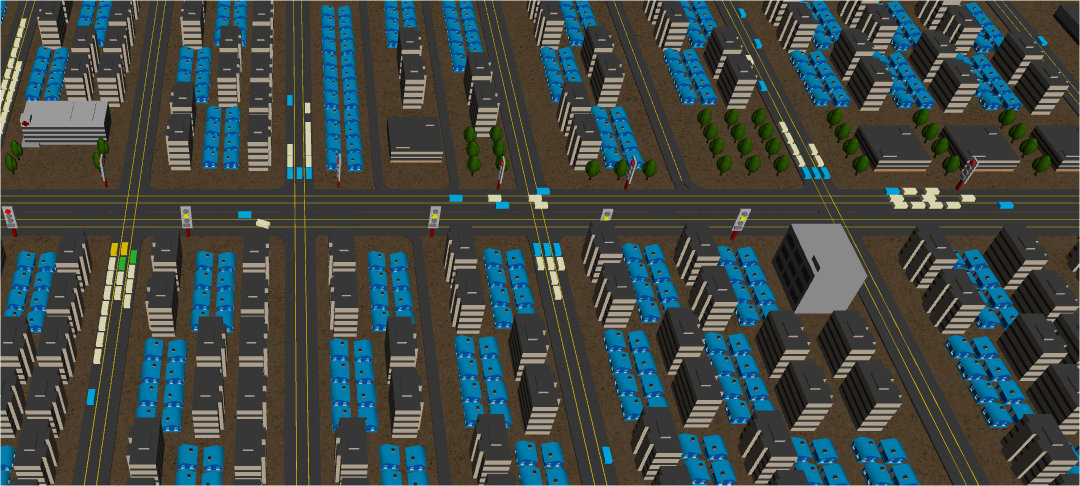
Another technique used was graphic animation. Anylogic® software, as most of agent-based simulation software allows the visualization of moving objects during simulation, which makes it easier to analyze model's behavior. In this project, the preferred visualization form was in 3D way, as shown in Figure 6.
Figure 6. 3D Model Visualization
Finally, the group revision technique was also applied in this project. According to Chwif et Medina (2015), it is more difficult to find our own mistakes than a third person to find it. The authors suggest that the model's implementation team share it with other people so that they can verify whether it is functioning properly. In this project, the simulation model was shown to the SEMOB staff members and no apparent errors were found.
Operational Validation
After the simulation model development, a quantitative validation of their output results becomes necessary. This step is called operational validation. According to Sargent (2013), one way to validate a computational model is through the validation of historical data. The author states that, if historical data exists, some of these data can be used in the building of the model and the remainder can be used to determine whether the model behaves or not according to the studied system. A comparison of the crossing time (10 samples in both directions of the avenue) between the data collected by the project team and the simulation model was made with a statistical t-test. As the p-value found for the direction São Paulo-Santo André is 0.212 and the p-value for the direction Santo André-São Paulo is 0.386, it can be concluded that there is no evidence to reject the null hypothesis that the samples (real data and simulation results) show equivalent values for the two directions.
In addition, data concerning the number of vehicles that leave the system during the simulation period (4 hours) were compared. In this case, since the historical data refers to 2013, a slightly difference was expect. In fact, results of theoretical data in the São Paulo-Santo André direction showed a 19% increase, while in the opposite direction there was a 22% variation. This variation was expected also due to the fact the model considers some modeling simplification hypotheses that generate a significant impact on the development of the simulation. Nevertheless, the simulation model could be considered valid.
5 Scenarios and results
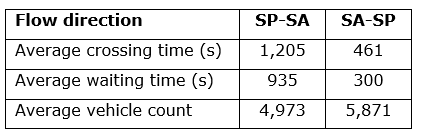
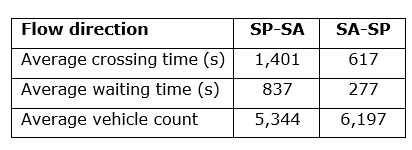
The alternative scenarios developed in partnership with the SEMOB will be described next. The current situation will be called base scenario and its main results are: average vehicle crossing time (in seconds), average waiting time in queue (in seconds) and total count of vehicles leaving the avenue after 4 hours. The results of this scenario, obtained after 30 simulation model replications are indicated in Table 2, from both flow directions: São Paulo-Santo André (SP-SA) and Santo André-São Paulo (SA-SP).
Table 2. Base Scenario Results
Scenario I: Maximum Speed Reduction
The maximum speed reduction in big cities' main roads has become a global trend. In this scenario, it is important to highlight the significant benefits provided by this change, both for drivers and pedestrians, mainly the drastic decrease in fatal accidents and the possibility of improvement in traffic flow.
Considering the overall scenario of the adjustment programs of maximum speed and the national deployment panorama, São Caetano do Sul city has shown interest in studying the feasibility for changing the maximum vehicular speed on Goiás Avenue, currently set at 60 km/h to 50 km/h.
To analyze this scenario, two input data would be changed in the simulation model, namely, the maximum speed allowed (from 16.7 m/s to 13.9 m/s) and the safety distance between vehicles (automatically updated by CarSource objects).
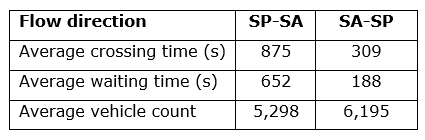
It can be noticed that the average crossing time showed a considerable increase compared to the base scenario: 16% for the São Paulo-Santo André direction and 34% in the opposite direction. Regarding the average time in queue, it was concluded that a decrease of 11% occurred in this indicator for the São Paulo-Santo André direction and 8% in the opposite direction. Absolute results, obtained from 30 replications, are indicated in Table 3.
Table 3. Scenario I Results
Positive highlights of this scenario: increase in the number of vehicles that leave the system, decrease in the permanence of vehicles in queue and a potential decrease in number of accidents. On the other hand, it can be cited the vehicle's lead-time increased along the avenue.
Scenario II: Green Wave
One of the great aims of SEMOB is the ongoing search for alternatives to improve urban traffic in São Caetano do Sul, especially in its main avenue, Goiás Avenue. In order to exploit this desire of SEMOB by improving the vehicular traffic flow, a study on the feasibility of implementing a green wave at the lights of the avenue was suggested.
According to Bosse (2011), the green wave is the result of technology combined with a good traffic engineering to properly adjust traffic lights timing. The main objective of the green wave is to facilitate traffic, allowing drivers to perform the fastest routes, avoiding the traffic caused by the accelerated increase of the fleet at peak hours. In short, a predefined number of traffic lights should be synchronized to allow vehicles to pass through all the traffic lights before they have to stop. In this project, two traffic light groups were created for the whole avenue by changing all traffic signal schedules in the simulation model.
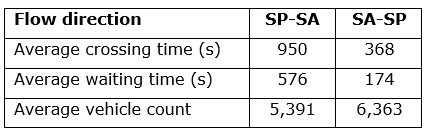
As a result of this methodology, average vehicle's crossing time values showed a considerable decrease compared to the base scenario: 27% for the direction São Paulo-Santo André and 32% in the opposite direction. Average waiting time in queue presented a 30% decrease for the São Paulo-Santo André direction and 37% for the opposite direction. This decrease is due to the fact that vehicles will perform fewer stops at traffic lights. The absolute results, obtained from 30 replications, are indicated in Table 4.
Table 4. Scenario II Results
Therefore, it can be concluded that the green wave implementation has benefits for road users, but before its implementation, SEMOB should perform an analysis of the consequences of this scenario at the cross-ways traffic flow.
Scenario III: Mixed Scenario
After a careful analysis of the aforementioned scenarios it was concluded that a possible unification of the proposed scenarios could optimize previous results.
In fact, after 30 replications of the simulation model, the average crossing times presented a considerable decrease compared to the ones obtained in a base scenario: 21% for the São Paulo-Santo André direction and 20% for the opposite direction. A decrease was also observed in average waiting time: 39% for the São Paulo-Santo André direction and 42% for the opposite direction. Finally, an increase in the number of vehicles that leave the system was also obtained, as shown in Table 5.
Table 5. Scenario III Results
It can be concluded that this scenario presents favorable results in all indicators of interest.
6 Conclusions and further work
This study was focused on Goiás Avenue, one of the main roads in São Caetano do Sul, the city with the highest HDI in Brazil. Goiás Avenue acts as a route of passage for vehicles moving between Santo André and São Paulo cities, presenting a high traffic index during rush hours.
Modeling and simulation techniques were used in conjunction with Anylogic® simulation software in order to assess road conditions, considering its current demand for vehicles. The study also aimed at the creation and evaluation of improvement scenarios for overall system improvement.
It can be concluded that the simulation model developed enables SEMOB to better understand the system (Goiás Avenue) behavior and propose, if necessary, new alternative scenarios, in addition to the ones proposed in this project.
Specifically for this project, other factors could be examined and operated using the same methodology, as for example, the study of the behavior of all the agents present in the system, including buses. Another proposal to supplement this work would be to conduct a more detailed study of the interactions of Goiás Avenue with its crossroads.
Finally, a study in terms of the feasibility of the deployment of an exclusive track for buses in Goiás Avenue is proposed for future work. It is expected that the results of this study will serve to encourage further research in this area, providing more contributions towards a Smart City Philosophy.
Acknowledgements
The authors would like to thank Instituto Mauá de Tecnologia for their invaluable support to this project. The authors also would like to thank the undergraduate students Camila Raquel Casarin das Neves, Guilherme Castilhano Leite, Isabela Pereira Barbosa and Pedro Henrique Pinheiro de França for the data gathering and model building work.
References
Astarita, V. (2001) Comparison of three methods for dynamic network loading. Transportation Research Record. Paper No. 01-0199, pp. 179-190.
Ballon, P., Glidden, J., Kranas, P et al. (2011). Is there a need for a Cloud Platform for European Smart Cities?, in: eChallenges E-2011 Conf. Proceedings, IIMC Int. Inf. Manag. Corp., 2011.
Bosse, R. (2011) “Onda Verde” pode melhorar o trânsito nas grandes avenidas. Opinião e Notícia. Available at: http://opiniaoenoticia.com.br/brasil/politica/onda-verde-pode-melhorar-o-transito-das-grandes-avenidas/. Accessed 11 October 2015.
Boxill, S. et Yu, L. (2000) An Evaluation of Traffic Simulation Models for Supporting ITS Development. South West University Transportation Center. (2000). Available at: http://swutc.tamu.edu/2000/10/03/167602-1-report-abstract/. Accessed 6 June 2015
Chwif, L. et Medina, A. C. (2015). Modelagem e simulação de eventos discretos: teoria e aplicações. 4. ed. São Paulo: Bravarte.
Costa, A. D. (2013). Mobilidade urbana sustentável: estudo de ciclo eixo sudeste de João Pessoa, Paraíba. in: VII ELECS - Encontro Latinoam. Edif. e Comunidades Sustentáveis. Curitiba, October 21th-24th, pp 1-11.
Ghali, M. O. et Smith, M. J. (1995) Managing Traffic Congestion by using Traffic Control. IEE Coloquium on Urban Congestion Management. pp. 1-8.
Instituto Brasileiro de Geografia e Estatística – IBGE (2014). Frota de veículos (2014). Available at: http://cidades.ibge.gov.br/xtras/temas.php?lang=&codmun=354880&idtema=139&search=sao-paulo|sao-caetano-do-sul|frota-2014. Accessed 6 June 2015.
Kneib, E. C. (2012). Mobilidade Urbana e qualidade de vida: do panorama geral ao Caso de Goiânia. Revista UFG, Ano XIII, n. 12. Pp. 71-78.
Lieberman, E. et Rathi, A. K. (1997). The revised monograph on traffic flow theory. Federal Highway Administration.
Nam, T. et Pardo, T.A. Smart city as urban innovation: Focusing on management, policy, and context, in: Proc. 5th Int. Conf. Theory Pract. Electron. Gov., 2011, pp. 185–194.
Macal, C. M. et North, M. J. (2005). Tutorial on agent-based modeling and simulation. Winter Simulation Conference Proceedings. M. E. Kuhl, N. M. Steiger, F. B. Armstrong, and J. A. Joines, eds. Orlando, FL. p. 2-15.
Sakurada, N. et Miyake, D. (2009). Simulação baseada em agentes (sba) para modelagem de sistemas de operações. SIMPOI. São Paulo, SP. p. 1-16.
Sampedro, A. et Campos, V. B. G. (2006). Avaliação e tratamento das características da infra-estrutura viária urbana que influenciam a segurança do tráfego. Instituto Militar de Engenharia, Rio de Janeiro.
Samuelson, D. A. (2005) Agents of Change: How agent-based modeling may transformation social science. ORMS. Available at: http://www.lionhrtpub.com/orms/orms-2-05/fragents.html. Accessed in: 1 June 2015.
Sargent, R. G. (2013). Verification and Validation of simulation models. Journal of Simulation. Vol. 7, No. 12, pp. 12-24.
Swain, J. (2007) New Frontiers in Simulation: Bienal survey of discrete-event simulation software tools. ORMS. Available at: http://www.lionhrtpub.com/orms/orms-10-07/frsurvey.html. Acessed 6 June 2015.
Vaccari, L. S. et Fanini, V. (2011) Mobilidade Urbana. Paraná: série de cadernos técnicos da agenda parlamentar.
Wu, J. H. et Florian, M. (1994). Transit equilibrium assignment: A model and solution algorithms. Transportation Science. Vol. 28, No. 3, pp. 193-203.