Sustainability improvement opportunities in Brazilian sectors: analysis of DEA slacks
Flávia de Castro Camioto1, Enzo Barberio Mariano2, Daisy Aparecida do Nascimento Rebelatto3
1 Department of Production Engineering, Federal University of Triângulo Mineiro, Brazil; 2 Department of Production Engineering, University State of São Paulo, Brazil; 3 Department of Production Engineering, University of São Paulo, Brazil
Abstract
The concept of sustainable production used in Camioto et al. (2014) evaluates the efficiency of Brazil’s industrial sectors from 1996 to 2009, taking into account energy consumption and respective contributions to the country’s economic and social aspects. In this article, a replication of the performance of these sectors is conducted (Textile, Foods and Beverages, Chemical, Mining, Paper and Pulp, Nonmetallic and Metallurgical), from 1996 to 2010, with an in-depth analysis regarding the slacks between the current and the target performance in each variable relating to the sustainability analyzed. To determine these slacks, the SBM model of the Data Envelopment Analysis (DEA) method was used with the window analysis. The variables analyzed were energy consumption and fossil-fuel carbon emissions (inputs) and the Gross Domestic Product (GDP) per sectors, the persons employed and personnel expenses (outputs). The results showed that the variables which need the most changes to improve performance in all the sectors are the variables ‘persons employed’, followed by ‘fossil-fuel carbon emissions’, ‘Personnel expenses’, ‘Energy consumption’ and ‘GDP by sector’. It is expected that this study may provide a basis for future research and strategies to be implemented in other countries in order to guide the implementation of a more sustainable industrial policy.
Keywords: Industrial Sectors; Data Envelopment Analysis; Slacks; Sustainable Development.
1 Introduction
The sustainable development concept has gained strength since the United Nations (UN) World Commission on Environment published its “Our Common Future” report in 1987, known as the Brundtland Report, inspired in the 1st UN Conference on the Environment in 1972 in Stockholm, Sweden. The report criticizes the overuse of natural resources without considering the capacity limits of supporting ecosystems, pointing out the incompatibility between sustainable development, production patterns and consumption regulations.
The term sustainable development is defined by the World Commission on Environment and Development (1987) as development that seeks to meet the needs of the present without compromising the ability of future generations to meet their own needs. Thus, a sustainable business based on Elkington’s classification (1994), is one that contributes to sustainable development by simultaneously generating economic, social and environmental benefits, known as the triple bottom line. With this definition, the author indicates that corporations must take an integrated approach that includes social and environmental dimensions in economic strategies (Elkington, 2001).
With regard to production systems, Glavic et Lukman (2007) define the concept of “sustainable production” as the creation of goods using processes and systems that are non-polluting, that conserve energy and natural resources in economically viable, safe and healthy ways for employees, communities, and consumers and which are socially and creatively rewarding for all stakeholders for the short and long-term future.
According to Hart et Milstein (2003), this concept is based on the idea that environmental and social performance adds value to the organization, therefore it must be addressed with equal importance as economic performance. According to Henriques et Sardosky (1996), many factors, such as consumer pressure, shareholder pressure, government regulation and pressure from society itself, are relevant in the attitude of an environmentally responsible business. Within this scenario, it can be concluded that environmental concerns, aside from being a requirement that, if violated, it is punished with fines and penalties, also falls into a framework of threats and opportunities, in which the outcome of environmental issues may yield competitive advantages in terms of remaining in the marketplace. In line with this context, one can conclude that companies can no longer regard economic development without simultaneously considering environmental preservation and society’s mutual benefit.
Since there is much discussion on how to define a multidimensional index of sustainability, combining economic, social and environmental aspects (Cracolici et al., 2010), and based on the definition by Glavic et Lukman (2007) of the sustainable production concept, Camioto et al. (2014) analyzed the performance of the main industrial sectors in Brazil, from 1996 to 2009, considering energy consumption and its contribution toward the economic and social aspects of the country. In this work, an aggregate assessment of each sector was performed in terms of sustainability, but an analysis of the performance of each variable was not performed through the gaps.
Notwithstanding the study by Simões et La Rovere (2008), which analyzed the availability of renewable energy sources in Brazil, to conclude that the Brazilian energy matrix is relatively clean, Brazil’s internal use of renewable energy is of 43.7% (BEN, 2011); however, many of the activities of the industrial sector are still dependent on fossil fuels. The outcome is that the industry impacts the environment by emitting extremely high concentrations of greenhouse gases (GHG), increasing global warming, in addition to adding to the extensive mining in the form of fuel oil and coal. According to Freitas et Kaneko (2011), economic activities, together with demographic pressure, represent the leading forces that explain Brazil’s emission increase. On the other hand, the main factors to mitigate emission are carbon intensity reductions and diversification of the energy mix toward cleaner sources.
Thus, the present article replicated the method of Camioto et al. (2014) in order to explore other aspects of the results. From 1996 to 2010 (a further year), the performance of the main industrial sectors of Brazil (Textiles, Food and Beverage, Chemistry, Mining, Pulp and Paper, Non Metallic and Metallurgical) was carried out, with an in-depth analysis of the gaps between the target performance in each sustainability-related variable analyzed. Thus, the main contribution of this article is to analyze the difference between the current performance and the target (slack) of the main industrial sectors in Brazil, considering each sustainability variable analyzed in the previous study, from 1996 to 2010.
2 Method
The data used in this work were practically the same as that used in Camioto et al. (2014), so that the biggest difference between the data used in this work and in Camioto et al. (2014) corresponds to the year 2010, which was included. Therefore, the time interval analyzed in this study includes a period of thirteen years (1996-2010). Accordingly, these data include the industrial sectors: (a) Nonmetallic, (b) Mining, (c) Metallurgical, (d) Chemical, (e) Foods and Beverages, (f) Textiles, and (g) Paper and Pulp.
Similarly, the same variables used in Camioto et al. (2014) were used in our analysis, which were: (a) GDP by sector, as a variable of economic growth; (b) personnel expenses in the form of salaries, withdrawals and other remunerations, as a variable related to social development; (c) persons employed in each sector, as a variable related to social development; (e) energy consumption as a variable related to environmental impact; and (d) fossil-fuel carbon emissions, as a variable related to environmental impact.
The data related to the variables "personnel expenses" and "persons employed" were collected from the website of the Brazilian Institute of Geography and Statistics (Instituto Brasileiro de Geografia e Estatística - IBGE, 2011). The variables "GDP by sector" and "energy consumption" were collected in the report of the National Energy Balance (BEN, 2011), available on the website of the Ministry of Mines and Energy. The variable "fossil-fuel carbon emissions" was calculated using the top-down method proposed by IPCC (1996).
To perform the analysis, the mathematical programming method called Data Envelopment Analysis (DEA) was used. This method, based on the SBM variant model enabled analyzing the performance of the industrial sectors of Brazil to reduce energy consumption and fossil-fuel carbon emissions (inputs), while increasing the GDP by sectors, the persons employed and personnel expenses (outputs).
A way to include the time factor within the DEA technique is the window analysis (Cooper et al., 2000). This analysis covers the separation of the years that are being analyzed in different groups (windows). Thus, in this work 8 windows were built, which grouped eight years in each window, organized as follows: (a) 1996 to 2003 (b) 1997 to 2004, (c) 1998 to 2005, (d) 1999 to 2006, (e) 2000 to 2007, (f) 2001 to 2008, (g) 2002 to 2009, (h) 2003 to 2010.
After running DEA with the window analysis, the slacks between the current performance and the performance target of each sector were compared to each variable analyzed. This analysis is the main contribution of this work, thus complementing the work of Camioto et al. (2014).
The slack expresses to what degree the current performance of the DMU is distant in each variable, its ideal performance, which can be symbolized by a virtual DMU that is at the efficient frontier (also called a benchmark). This ideal performance can be considered a goal for the inefficient DMUs, which can be calculated according to expressions 1 and 2:
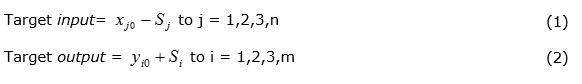
The relative slack can be determined with the current performance and performance target, which expresses the percentage level of improvement needed for each variable in each sector. The relative slack can be determined using expression 3:

It should be mentioned that the idea of the percentage goal in terms of reality was introduced by Hu et Wang (2006) to measure energy efficiency. Since then, a growing number of studies have been developed in economies such as the USA (Mukherjee, 2008), Japan (Honma et Hu, 2008), China (Wang et al., 2013; Wang et al., 2012; Wu et al., 2012; Watanabe et Tanaka, 2007), India (Mukherjee, 2010), among others, which have contributed to measuring energy efficiency, in which multiple Power inputs and other materials and resources are used to produce multiple outputs.
In this study, besides considering the slack of the variable “energy consumption”, the slacks of all other variables considered in the study were analyzed.
3 Results and Discussion
In order to reach the goal of this work, which is to analyze the slacks between the current and the target performance of the main industrial sectors in Brazil to reduce energy consumption and fossil-fuel carbon emissions (inputs), as well as to increase the Gross Domestic Product (GDP) by sectors, and the persons employed and personnel expenses (outputs), Table 1 was assembled with the results obtained by means of the SBM model of DEA, including the year 2010 in the analysis carried out in Camioto et al. (2014). It shows the average performance (of the windows) for each sector analyzed and the average of the relative slacks for the economic, social and environmental variables of each sector.
Table 1. Efficiency and Relative Slacks of Industrial Sectors
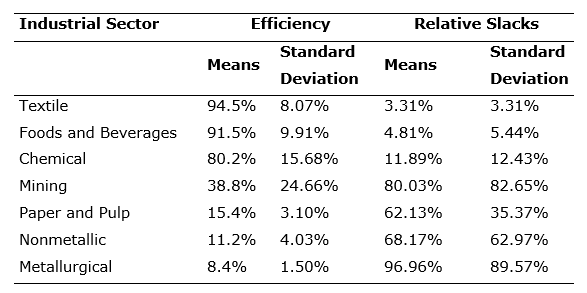
As observed, the results indicate that the Textile sector was the one with the highest average performance with respect to the variables considered, followed by the sectors, according to Table 1: Foods and Beverages, Chemical, Mining, Paper and Pulp, Nonmetallic, and Metallurgical. These results are consistent with those of Camioto et al. (2014), although an additional year was added in the analysis, the year of 2010.
As for the average of the relative slacks, the only inconsistency with previous results was for the mining sector that needs, in relation to its current standards, to improve its variables more extensively than the pulp and paper and non-metallic sectors, which were less efficient. However, similar to that of the metallurgical sector, it showed a high standard deviation in its relative slacks, which indicates that not all of the variables of these sectors need to be changed at the same rate. The disaggregated analysis of the slacks will be discussed in greater detail below.
To better understand these results, as a complementation of Camioto et al. (2014), the relative performance of each variable in the sectors was analyzed. Thus, the slacks were analyzed using the DEA method. However, specifically for the analysis conducted in this article, the slack cannot be interpreted as a fixed goal, since the DMUs are not homogeneous.
Given these considerations, Table 2 shows the ranking of sectors for each variable considering the relative slacks, where ranking 1 indicates the sector with the highest percentage for the relative slack, and number 7 the lowest percentage.
Table 2. Ranking of sectors according to the slack relative to each variable.
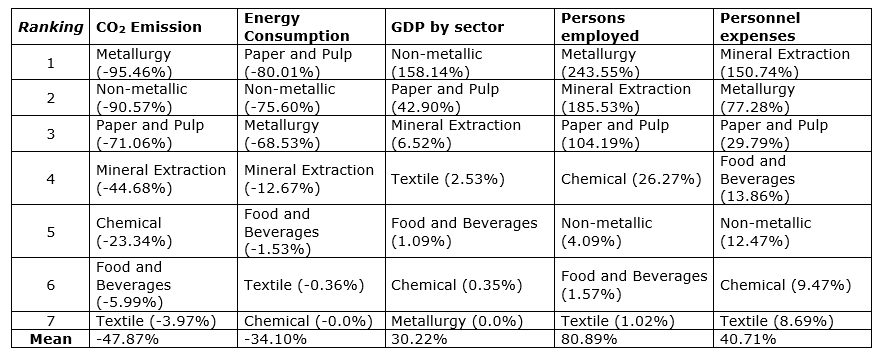
Table 2 shows the variable that needs the highest number of changes for all sectors, and the number of persons employed followed by: fossil-fuel carbon emissions, Personnel expenses, Energy consumption and GDP by sector.
Regarding the metallurgical sector, the results indicate that in all sectors analyzed this is the one that shows the greatest need to reduce CO2 emissions due to the use of fossil fuel, and also due to the increase in personnel expenses, in order to improve its performance in comparison to other sectors.
However, this sector, ranking last in performance, was a benchmark for the variable “GDP by sector”, that is, with an average relative slack of 0.0%. Therefore, considering that the other variables could be changed as indicated, the “GDP by sector” variable does not need to be changed, as it already presents the best numbers, compared to the other sectors, taking into account the scenarios presented. Table 5 shows the windows analysis results for the slacks of the Metallurgical Sector.
Table 3. Ranking of slacks for the Metallurgical sector.
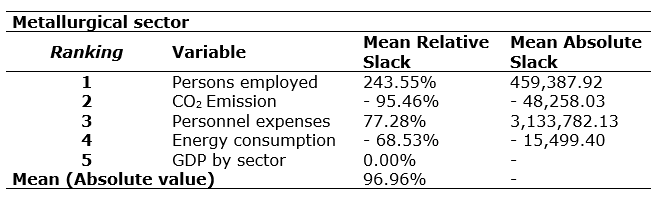
The results shown by the metallurgical sector allow stating that this sector is economically important to the country, given its contribution to GDP. On the other hand, this is an industry with low employment and also a highly polluting sector, and could benefit greatly by transferring cleaner technologies from other sectors. It is also a sector that should be more challenged regarding their social actions, since, compared to other sectors wages and jobs, (variables that are difficult to change) are low.
Table 4 shows the non-metallic sector, in the penultimate ranking of sustainable performance, and GDP by sector was the variable with the highest slack.
Table 4. Ranking of slacks for the Non-Metallic sector
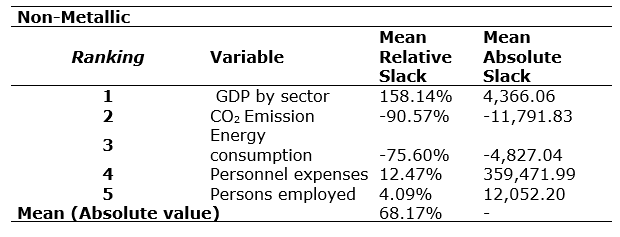
Again, the variable “fossil-fuel carbon emissions” exhibits the second highest relative slack in the ranking. These results indicate that to increase the relative performance of this sector, considering these variables, it would need initiatives that primarily reflected GDP by sector increase, and a carbon dioxide emissions decrease. Similarly, although the nonmetallic sector exhibits low slacks for the variables “personnel expenses” and “persons employed” when compared with the other sectors analyzed, according to Table 3, this sector exhibited the highest slack for the “GDP by sector” and the second highest slack for the “energy consumption” and “CO2 emissions”. It should be mentioned that in 2010 this sector was the second sector that most emitted CO2, after only the metallurgical sector, and the one that had the lowest GDP by sector.
Thus, it can be concluded that like the metallurgical sector, the non-metallic sector could be greatly benefited by adopting a less polluting production system. However, the biggest problem of this sector regards its low sector GDP, which indicates the need for technology innovations that can result in increased productivity and value-added products. A positive aspect of this sector is the fact that it has a good social return in terms of jobs and wages.
Table 6 shows “fossil-fuel carbon emissions” for the pulp and paper sector as the third variable whose performance undermines the sustainable performance ranking of this sector.
Table 5. Ranking of slacks for Paper and Pulp sector
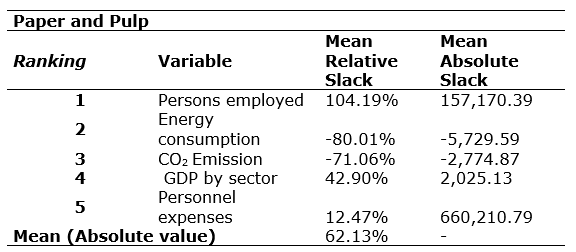
According to Table 5, the second highest relative slack variable in this sector was energy consumption. Table 3 shows that the pulp and paper industry stands out for this variable, which has the highest slack in all sectors analyzed, showing the need for energy efficiency measures in the industrial sector, which in 2010 was the third highest sector that most consumed energy. This fact could indicate that energy efficiency measures may be necessary for the sector, which would eventually also have effects on the CO2 emission levels.
The variable that needs most attention is “Persons employed”, that is, compared to higher performance sectors, which in other words means that the pulp and paper sector is not employing enough. An interesting aspect is that, while the employment levels of the paper and pulp sector are low, it does not need major changes in terms of personnel expenses, which indicates that high wages are paid; thus, in social terms these two variables are balanced.
Similarly, the mineral extraction sector has the highest relative slack for the variable “Persons employed”, followed by the variable “Personnel expenses”. Thus, according to this analysis, the mineral extraction sector needs to focus on the social variables to increase their relative performance in terms of sustainability. The variable “fossil-fuel carbon emissions” is the third highest slack of this sector. Table 6 shows the relative slacks of the variables in this sector.
Table 6. Ranking of slacks for the Mineral Extraction sector
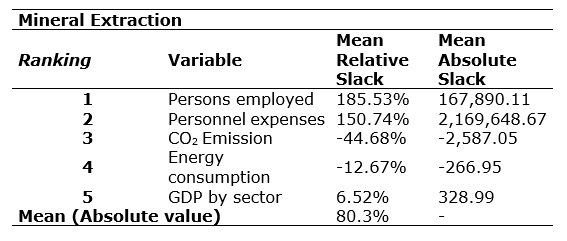
In this sector, the variable with the lowest relative slack is GDP. This result corroborates the information found, which justifies the performance increase of this sector since 2006, through the GDP increase. However, despite reports claiming that wages in this sector valorized more than the average wage in the manufacturing industry between 1996 and 2009, the analysis results indicate that, considering the inputs minimization and outputs maximization, this sector should increase more with personnel expenses to be equal to relative performance, in terms of sustainability. Note that, according to Table 2, this sector had the highest relative slack among all sectors analyzed for this variable.
Table 8 shows the relative slacks of the variables in the chemical. This sector had the highest slack for the variable “persons employed”, followed by the variable “fossil-fuel carbon emissions”, highlighting the non-intensive manual-work production feature.
Table 7. Ranking of slacks for the Chemical sector.
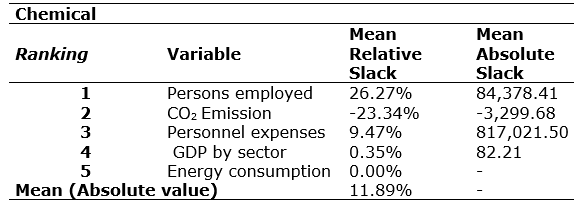
According to the results, measures to mitigate emissions could occur mainly through replacements with cleaner fuels or CO2 capture, rather than energy efficiency measures, since this sector was viewed as benchmarking for the variable “energy consumption”, with an average relative slack equal to 0.0%, according to Table 7.
Thus, similar to the metallurgical sector for the variable “GDP by sector”, if the other variables in the Chemical sector could be changed, as indicated, the variable “energy consumption” would not need to be changed, as it already presents the best numbers, compared to other sectors and considering all years and windows. However, less polluting technologies would increase this sector’s efficiency.
It is also important to note that the average percentage of relative slacks for the chemical sector is well below the average of the slacks for the sectors presented so far, with the highest slack of only 26.27%. This is justified by the high performance of the sector, the third in the sustainable performance ranking, thus requiring smaller interventions in the process to increase its performance.
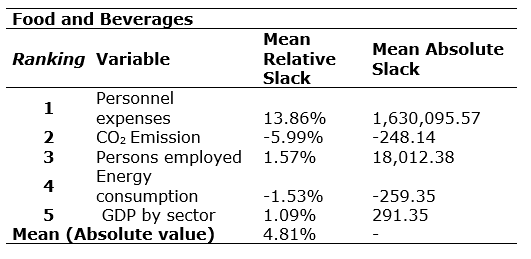
Similarly, the food and beverage sector, ranking second in the sustainable performance of the sectors, also shows low percentages for the relative slacks, in which the highest is the variable “Personnel expenses”, followed by the slack for “fossil-fuel carbon emissions”, according to Table 8.
Table 8. Ranking of slacks for the Food and Beverage sector.
Finally, the textile sector, the first in the performance ranking, did not appear as benchmarking for any variable; however, according to Table 9, it also exhibits low percentages in terms of slacks. The highest slack value is for the variable “Personnel expenses”, followed by the variable “fossil-fuel carbon emissions”, similar to the food and beverage sector.
Table 9. Ranking of slacks for the Textile sector.
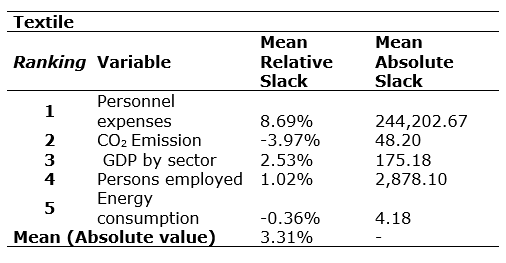
It should also be noted that this sector, of the five variables considered in the performance analysis according to Table 2, when compared with other sectors, exhibited the lowest slacks for three variables. Additionally, it did not exhibit very high slacks for the other variables: “Energy consumption” (sixth place) and “GDP by sector” (fourth place). These low slacks justify the sector’s high performance.
5 Final Discussion
Adopting the concept of sustainability requires not only the viability of the economic approach, but also the social and environmental variables, in order to achieve a better spread of the gains acquired by the use of natural resources with minimum damages to the planet and to mankind. An equitable development process requires the interaction of sustainability dimensions to harmonize different interests involving economic growth and a social and ecological perspective.
Therefore, this article analyzed through the efficiency concept, the contribution of seven Brazilian industrial sectors to sustainable development, which addressed the three basic pillars of the triple bottom line, namely economic, social and environmental impact, complementing the study of Camioto et al. (2014).
Thus, the efficiency of the Brazilian industrial sectors was analyzed from 1996 to 2010, to reduce the inputs "energy consumption" and "fossil-fuel carbon emissions" and to simultaneously increase the outputs "GDP by sector", "persons employed" and "personnel expenses".
The outcome of this study, similarly to Camioto et al. (2014), showed that the Textile sector is the most efficient in terms of contribution to the sustainable development in Brazil, followed by the sectors: Foods and Beverages, Chemical, Mining, Paper and Pulp, Nonmetallic, and Metallurgical.
Regarding the slacks, it was noted that overall the variable “People employed” is the one that should receive more attention so that measures are taken to modify it in order to increase sector performance, from a sustainable point of view, followed by: fossil-fuel carbon emissions, personnel expenses, Energy consumption and GDP by sector. However, to study the efficient number of jobs in each sector, complementary analyses are needed for the unemployment rates in society, the production level of each sector and the technologies available.
Similarly, it is emphasized that the slack cannot be interpreted as a fixed goal, which is an indication of the most detrimental performance variable of this sector in relation to the others, from a sustainable point of view. This consideration is important because the sectors have production processes that differ from each other. Thus, it could be that there are no possibilities to increase or decrease the variables as indicated by the slacks, for example, considering the current structure of the sector, and the economic scenario of the country.
On the other hand, there is, for example, albeit limited, the possibility for technology transfer between industrial sectors, and these transfers essentially relate to the generation and use of energy from cleaner and more efficient energy sources. Thus, according to the results presented herein, while the textile sector can be a reference of good sustainable practices that should be further examined in terms of improvements, the metallurgical sector should receive more attention. The aggregated index presented in this work, the slacks analysis and the ranking of industrial sectors also help to allocate government resources and to provide attention to incentive or protection policies against foreign competition, focusing on strategic sectors such as Brazil’s textile sector.
These results, besides the caution needed to interpret the trends due to limited data, should also take into account the variables analyzed in this study, which addressed the three pillars of sustainability. And for future works, one could consider that adopting the sustainability concept is one of the main goals to achieve more equitable income distribution, which would imply the inclusion of new variables in the study. Also emphasized is the possibility of including other variables related to environmental, social and/or economic impacts, in addition to those considered in this analysis. As an example, there is the possibility of analyzing the entire lifecycle of products from the industries of each sector, in order to better measure their environmental impacts. Such an approach could also consider the emission of other pollutants and other forms of environmental degradation (water pollution, deforesting, etc.) throughout the product lifecycle. However, it is emphasized that in this study the focus was only on Energy consumption and consequent CO2 emissions due to energy use in the production process of the Brazilian industrial sectors nationwide.
According to the results of this work, it should be noted that all industrial sectors, especially the Metallurgical and Nonmetallic sectors, can still contribute significantly to the complex challenge of promoting economic development with social improvement and environmental respect. For this, the current and future developments must be closely associated to the sustainable, efficient and secure use of energy that is based on environmentally and economically viable approaches for the future of society in the short and long term.
Within this context, the intention of this work was to contribute with quantitative information for both the private sector and the government, in order to establish appropriate strategies to reduce the environmental impacts of the industrial sector in the quest for sustainable development. In addition, it is expected that this work will serve as a reference for other countries in order to guide the implementation of a more sustainable industrial policy.
References
BEN -. Balanço Energético Nacional (2011) (Ano-Base 2010). Divulga informações relativas ao binômio oferta Consumption de fontes de energia. Available at: https://ben.epe.gov.br/BENRelatorioFinal2011.aspx. (Accessed 25.10.11).
Camioto, F.C., Mariano, E.B. and Rebelatto, D.A.N. (2014). Efficiency in Brazil’s industrial sectors in terms of energy and sustainable development. Environmental Science & Policy, Vol. 37, pp. 50-60.
Cooper, W. W, Seiford, L. M. and Tone, K. (2000). Date Envelopment Analysis: a comprehensive Text with models, applications, reference and DEA–Solver software. 1 ed. Norwell: Kluwer Academic Publishers.
Cracolici, M.F., Cuffaro, M. and Nijkamp, P. (2010). The Measurement of Economic, Social and Environmental Performance of Countries: A Novel Approach. Social Indicators Research, Vol. 95, No. 2, pp. 339-356.
Elkington, J. (1994). Towards the sustainable corporation: win-win-win business strategies for sustainable development. California Management Review, Vol. 36, No. 3, pp. 90-100.
Elkington, J. (2001). Canibais com garfo e faca. São Paulo: Makron Books, 2001.
Freitas, L.C. and Kaneko, S., 2011. Decomposition of CO2 emissions change from energy consumption in Brazil: challenges and policy implications. Energy Policy, Vol. 39, pp. 1495-1504.
Glavic, P and Lukman, R. (2007). Review of sustainability terms and their definitions. Journal of Cleaner Production, Vol. 15, pp. 1875-1885.
Hart, S. L. and Milstein, M. B. (2003). Creating sustainable value. Academy of Management Executive, Vol. 17, No. 2.
Henriques, I. and Sadorsky, P. (1996). The determinants of an environmentally responsive firm: An empirical approach. Journal of Environmental Economics and Management, Vol. 30, pp. 381-395.
Honma S and Hu J. L. (2008). Total-factor energy efficiency of regions in Japan. Energy Policy, Vol. 36, pp. 821-833.
Hu, J. L. and Wang, S. C. (2006). Total-factor energy efficiency of regions in China. Energy Policy, Vol 34, pp. 3206-3217.
IBGE – Instituto Brasileiro de Geografia e Estatística (2011). Pesquisa Industrial Anual – Empresa. Available at: http://www.sidra.ibge.gov.br. (Accessed 04.05.11).
IPCC – Intergovernmental Panel on Climate Change (1996). Greenhouse gas inventory reporting instructions – Revised IPCC Guidelines for national greenhouse gas inventories. In: United Nations Environment Program, the Organization for Economic Co-operation and Development and the International Energy Agency, London.
Mukherjee, K. (2008). Energy use efficiency in US manufacturing: a nonparametric analysis. Energy Economics, Vol. 30, pp. 76-96.
Mukherjee, K. (2010). Measuring energy efficiency in the context of an emerging economy: The case of Indian manufacturing. European Journal of Operational Research, Vol. 201, pp. 933-941.
Simões, A. and La Rovere, E. L. (2008). Energy sources and global climate change: the Brazilian case. Energy Sources A: Recovery Util. Environ. Eff., Vol. 30, pp. 1327-1344.
Wang, K., Wei, Y. M. and Zhang, X. (2012). A comparative analysis of China’s regional energy and emission performance. Which is the better way to deal with undesirable outputs? Energy Policy, Vol. 46, pp. 574-584.
Wang, K., Wei, Y. M. and Zhang, X. (2013). Energy and emissions efficiency patterns of Chinese regions: A multi-directional efficiency analysis. Applied Energy, Vol. 104, pp. 105-116.
Watanabe, M. and Tanaka, K. (2007). Efficiency analysis of Chinese industry: a directional distance function approach. Energy Policy, Vol. 35, pp. 6323-6331.
World Commission on Environment and Development (1987). Our common future. Oxford: WCED, Oxford University Press, 1987.
Wu, F., Fan, L. W., Zhou, P. et al. (2012). Industrial energy efficiency with CO2 emissions in China: a nonparametric analysis. Energy Policy, Vol. 49, pp. 164-172.