SERVQUAL model applied to higher education public administrative services
Mauri Cesar Soares1, Olívio Novaski2, Rosley Anholon2
1 Faculty of Technology of Tatuí; 2 University of Campinas
Abstract
Objective: This article aims to report the application of the SERVQUAL model in a public higher education institution from the student body's perspective, in order to assess the Quality of administrative services. Methods: The SERVQUAL Model, which was developed by Parasuraman, Zeithaml and Berry, was applied and the "expectation" and the "perception" of respondents were evaluated, resulting in Perceived Quality. Results: The results show that, between five proposed and evaluated dimensions in the Model, the "tangibility" was the only one with positive results. Limitations: The study took place in a Brazilian public higher education unit, whose results cannot be considered to all units. Data were collected by the student body, since these services are exclusively provided to them. Originality/value: The use of the SERVQUAL method to evaluate services provided by education institutions is not trivial, thus their analysis can collaborate with managers in preparing the unit strategic planning as well as demonstrating that the method can be used by other institutions wishing to evaluate the quality of services offered to their students.
Keywords: Service quality, quality management, SERVQUAL model.
1 Introduction
Lovelock (2011, p.5) reports that:
"The percentage share of the service sector is growing in almost all economies in the world. [...] Even in emerging economies, the production of services has been growing rapidly and often can represent up to half of the Gross Domestic Product (GDP). [...] The increase of wealth generated by value of knowledge allows its owners to possess income to pay for the provision of other services – which increases demand in the services market."
Considering the importance of the Service sector in the economy, Barros Neto (2014, p. 76) states that "the differential has to be found". It can be reached by force, economic power, and political power, better adapting to the environment or using intelligent ways."
Service sector is composed of an endless number of different types of services that can be offered to the market, thus there is a tendency that the service sector will occupy an increasingly significant portion of the wealth of countries.
This requires companies in this sector to be more and more prepared, identifying market demands, preferably offering quality services as they face the levels of the customer's requirements, searching and applying strategies that contribute to their improvement and, above all, identifying different ways to assess the services provided.
Barros Neto (2014, p. 75), in turn, considers that "a higher Education Institution is an organization. Therefore, it must have structures and strategies so it can keep up, meeting the increasingly competitive demands, choosing a differential that guarantees a unique advantage".
Considered a service and sought by multiple consumers, education also requires a very careful and strict management regarding its control in order to obtain good results and quality.
Cristina et al., (2013, p. 600), also states that:
"The requirements of the knowledge society, which has affected higher education institutions in most of the world, [...] and through a greater emphasis on research and innovation, and extended access that has been given to education and learning opportunities throughout life. [...], quality measurement is becoming increasingly important in higher education."
It seems that there is convergence of thinking between the referenced citations in relation to service quality, since the term Services started to be interpreted as a strategic differentiator for organizations, starting in the end of the last century.
And its interpretation and its execution are a major challenge, at the beginning of the XXI century, considering that the great difficulty for an organization is to set out the customers' individual needs through the combination between "perception" versus "expectation" relation.
Faced with the Brazilian reality where the provision of Services is in general still incipient compared to the quality offered to the market, it is important to identify models that can be applied in organizations, and that generate performance indicators, and may also serve as a comparative baseline for future services.
In this context, this study aims to report the application of the SERVQUAL model obtained in administrative services in a public higher education institution from the student body's perspective. The results originated from analyzes made in five different courses, which are part of the Higher education institution (HEI).
The article is divided into sections, where the reader will first have contact with the literature review, which highlights some concepts related to service quality, and then the methodology used in the research. After, the overall results obtained from the tabulation of the survey data are presented, as well as the relative importance of the dimensions and the matrix of prioritization. Finally, final remarks, the limitation of research and suggestions for future studies are presented.
2 Literature Review
2.1 The concept of Service Quality
The first references to quality appear in the Aristotelian Greek philosophy with the empiricist Bacon presenting two forms of quality, objective and subjective, the first being more evident than the second.
Hobbes, in turn, broadens the concept of subjective quality presented by Bacon, as the set of assessments of the subjects on things and people. The two concepts persist, always with an association that objective quality is directly related to a product, and subjective quality is associated to services, and the idea has increased significantly from the 80s, in parallel with the explosive development of the service sector in the world economy.
In turn, the quality is not only the combination of ownership of a good or service and the requirements of a client, but a subjective and relative concept as evidenced by Gronröos (1982), which was one of the Service Quality theme precursors in the last century, and later followed by Zeithaml et al., (1988).
Alves (2005, p. 62) highlights in the PhD thesis that "more than a short trend, speaking about quality is a concept with application attempts in all business fields, both in tangible assets businesses and services, including also those non-profit businesses".
According to Zeithaml et al., (1988), "quality of service is a construction of a complex nature, diffuse and abstract, the result of the sum of the unique features that apply to services, whether intrinsic or extrinsic to the service in such a way that they are perceived by individuals so they can give value."
Parasuraman et al. (1986, p. 15), authors of the SERVQUAL Model, consider quality as a multidimensional concept, and state that it is a consumer's global judgment, resulting from the comparison between "expectations" about the service they will receive with the "perceptions" about the company's performance.
Quality "perception" goes through a process of seeking information about the unique characteristics of the service, allowing the user of the service to enjoy and issue some sort of judgment and, when asked about it, establishes a value in either ascending or descending scale.
These judgments are formed from the moment the user takes as reference a similar service previously received, and which was used to meet a particular need.
Thus, an education service may consist of basic services such as classes, assessments, punctuality of teachers in the classroom, available multimedia equipment, air-conditioned environment with lighting that meet the needs of students. And an increasing number of complementary services such as student ID, library, computer room, sports clubs, convenience areas such as cafeterias and food courts, souvenir shops, access to ATMs, and monitored parking.
Environments provided with Internet access are part of this set of services, on account of the electronic equipment regularly used by university students, who argue that such access collaborates and boosts learning, due to the range of opportunities that these means provide for their academic research, as well as service rooms for students, for guidance of research groups, university extension courses, and cultural exchanges between colleges and universities of different countries.
According to Las Casas (2012, p. 89), he notes that "Service quality is linked to satisfaction. A customer satisfied with the service provider realizes a service as quality. It happens in any situation where there may be the satisfaction, as a problem solution, the assistance for a need, or any expectation."
2.2 The "expectation" of Service Quality
Alves (2005, p. 79) reports that "the concept of "expectation" has been widely used in studies on consumer behavior as people make certain demands on services based on their own standards, values, wishes and needs, making this process very individualistic".
It can also be considered that the "expectations" can be determined not in isolation, but by Reference groups (primary, secondary, formal and informal), which influence on consumer behavior of products and/or services, groups that, according to Basta (2011, p. 59), presents as "primary group" represented by family, friends, coworkers and neighbors; the "secondary group", in turn, is represented by religious organizations, classes and sports clubs. The "formal groups" are formed by political parties, and the "informal groups" are those occurring in sporadic meetings between people.
The "expectations" of an individual can also undergo changes over time, since they can suffer pressure by economic, political, technological, social, legal and natural factors that occur both internally and externally to their natural environment, ethical values and service providers.
The "expectations" of an element can also be formed from the search for information made to meet a particular need, because once a problem is recognized, clients seek information on how to solve it, and to do that, they may use the three most common types of "sources", that is, "personal sources" (family, friends, acquaintances), "commercial sources" (advertising, sellers, and agents), and "experimental sources" (examination or use of the product/service)[1].
Basta (2011, p. 76) also emphasizes that:
"The ‘personal sources’ play a legitimizing or evaluator role, while ‘commercial sources’ perform an informative function. In the case of searching for information through ‘experimental sources’, the higher the previous experience, the lesser information is sought."
As previously mentioned, being one of the precursors to deal with the Service Quality theme, Gronröos has developed the Model of Four Factors that influences the "expectations" of a customer. The first factor refers to the communication the customer receives; the second factor is related to their needs and preferences; the third, to past experience in contact with the service; and fourthly, the traditional word of mouth.
It is also important to note that, when the same services are developed by public and private sectors, each of which has its own standards for quality, and can also affect the customer "expectations", because in many countries people prefer to seek solutions for their own needs, using private companies due to the slowness and excessive bureaucracy of public services.
2.3 “Perception” of Service Quality
The process of quality "perception" is fairly complex and is not only limited to experiments of the quality dimensions. "Perception" is individual and influences the way people behave, also in their environment.
A good perceived quality is obtained when the quality experienced suits the customer "expectation", that is, the desired quality. If the "expectations" are not realistic, perceived quality is low, even if the experienced quality is good when measured objectively.
Alves (2005, p. 81) states that "the image plays a central role in the customer "perception" on the service quality, and is very important for a service business as well as for any other organization," that is, what an organization has on its day by day can contribute to its consolidation before its sector.
According to Robbins (2010), in his work "Organizational Behavior", he argues that "perception" can be defined as the process by which individuals organize and interpret their sensory impressions, so that their environment can make sense. However, what a person perceives can be substantially different from objective reality.
It is also understood that "perception" is a dynamic process, therefore addressing and measuring it in those who seek service quality becomes challenging and thought-provoking, since individuals may feel it differently.
This process may suffer various influences at the same time, whether cultural, social, technological, economic, and political, as well as the competitiveness surrounding these individuals, complemented by their experiences and needs.
Barros Neto (2014, p. 143) in his book "Management of Higher Education Institutions", he points out that: "the great challenge that the Brazilian HEIs have faced is to conciliate the legal criteria related to education and higher education, with corporate responsibilities and obligations, which are not always plausible due to the high cost to the country – an example is the creation, development, and offer of quality educational services. This quality, although within properly monitored technical criteria, may not have the same "perception" for the market."
"The level of perceived quality is not determined by the level of technical and functional dimensions, but by the difference between the expected quality and experienced quality." (Gronröos, 1984).
A year later, Bateson introduced a new concept related to the perceived quality of a service, the perceived control, which explains the consumer behavior in purchase and consumption situations, which can be exemplified by forming a cluster of people, or a queue, either in a bank or a supermarket, because the customer wants to be in control when in direct contact with the employee of the company that provides the service; when customers lose this control they feel hurt, and consequently their satisfaction will be reduced.
In the same line of discoveries and searches of knowledge in his studies on perceived quality of services, Lindqvist (1988) also included the communication and price dimensions, where the first dimension is related to how much a service provider invests in advertising campaigns, as a way to consolidate the company’s image in the market, and the second dimension is related to the level and price offers.
Alves (2005, p. 82) considers that "The price of a service can be considered in relation to customers "expectations" to quality, or their early "perception" regarding service quality. Especially when the service is very intangible, higher price could mean better quality for customers "perception."
2.4 The Conceptual SERVQUAL Model
Services consumers will make their considerations of the overall quality of a service in accordance to the interpretation they make by considering discrepancies between "expectations" and "perceptions", in relation to the current performance of the organization that offered them a particular service.
These discrepancies were described by Parasuraman et al., (1985) considering that there are four primary GAPs, and the fifth as a result of the first four. The individual explanation of each follows them, and was later synthesized in Figure 1[2]:
Figure 1. Conceptual Model of Quality - Servqual: analysis of the discrepancies.
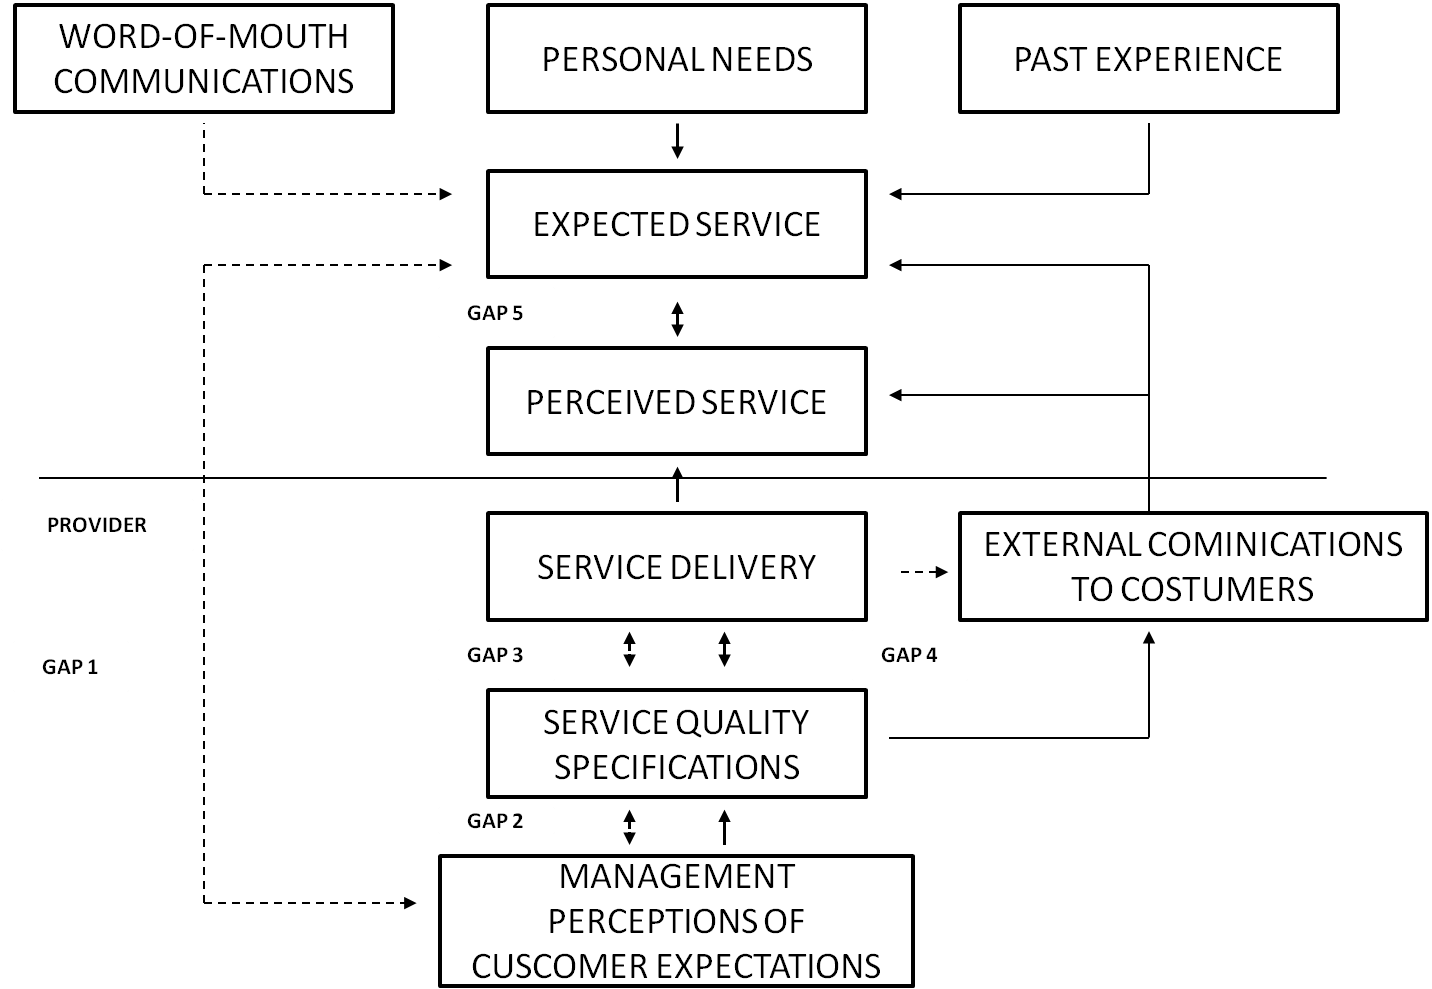
Source: Zeithaml et al. (1990)
-
Gap 1 (Unfamiliarity regarding customer’s "expectation"): it is the difference between the "expectation" of consumer service quality and the "perception" of the supplier of the consumer "expectations". For elimination of Gap 1, communication is one of the most efficient means.
-
Gap 2 (Translation of "perceptions" into specifications for the service quality): it is the difference between the supplier’s understanding of the consumer "expectations" and the service quality specifications. To eliminate this Gap it is recommended that the tasks become increasingly standard deviation.
-
Gap 3 (Delivery of services): it is the difference between the service quality specifications and effective service provided. In this case it is recommended to show that teamwork, technology, and negotiation skills are essential to eliminate discrepancies.
-
Gap 4 (Broken promises): it is the difference between the actual performance of the service and the service promises made to consumers; it can be eliminated since there is a commitment to joint actions between people and the departments of the organization.
-
Gap 5 (Quality perceived by the customer): it is the difference between the expected service and the perceived service.
Alves (2005, p. 85) in his work "Marketing services in education: quality perception models", states that "A. Parasuraman, Leonard L. Berry and Valarie Zeithaml propose that organizations with issues in areas such as those described in gaps 1, 2, 3, and 4, try to identify their actual quality problems, which make customers to receive a service poorer than initially expected”.
The SERVQUAL Model, in turn, also highlights that, in order to measure Service quality, all the Quality Dimensions that are summarized in Table 1 should be evaluated, and are used to support the analysis of the research results.
Table 1. The dimensions of Quality – SERVQUAL Model

Source: Adapted from Gondim, 2005, p.26.
The customer measures service quality by comparing the differences between the results of perception (performance of service) and their expectations (confirmation/disconfirmation), so that the negative difference indicates perceived quality below expectations, and vice versa when the difference is positive. “(...) Although there is not unanimity yet, the disconfirmation paradigm that results from service expectation, minus what is perceived, is the most commonly used paradigm in research” (Castro Junior et al., 2013, p. 50).
2.5 Models used to measure Service Quality
Table 2 summarizes other quality models in Service Quality, presented in chronological order of creation, with their authors, the main characteristics, the main remarks, and areas of application.
Table 2. Types of Models of Service Quality

Source: Revista Produção (in portuguese – Produção Magazine) v.14 n.1 p.29 – 2004
In order to portray the state of the art, this model was used in different environments, and this study briefly listed the three most recent studies among others surveyed, their results and conclusions.
1- Muhammed et al. (2014), in the study "Using SERVQUAL to evaluate the service quality provided by the Jordanian telecommunications sector", researched the effect of the service quality Dimensions on customer loyalty in Jordanian telecommunications companies. It was envisaged that the Dimensions "tangibility", "response", "reliability", "empathy" and "guarantee" would positively affect customer loyalty. The results were in accordance with the predictions.
The results in relation to the dimension "tangibility" positively affect loyalty, as customers evaluate the appearance of physical facilities, equipment, personnel and communication materials as important in the execution of the service. This loyalty was also confirmed on account of the Response capacity that the service provider has to quickly offer what the customer needs.
The Dimension "reliability" was also positive, as customers were confident regarding the services promised by telecommunications companies, and the result was in line with what was paid to them.
As for "empathy", positive results have also confirmed that this dimension can positively contribute to the customers to become increasingly loyal to the service, since they valorize the understanding, caring and individualized attention. Finally, "guarantee" is a factor that positively contributes to customer loyalty, since they feel safe when employees of the service provider show knowledge, courtesy and safety when executing the service.
2- It is also noteworthy the research study by CRISTINA Calvo-Porral et al., (2013: 601-619), entitled "Higher education quality perception: an empirical study," where differences of quality perceived by students are analyzed, comparing public and private higher education institutions, and at the same time which are the Dimensions considered essential to service quality from the students perspective, using the SERVQUAL Model.
In short, the results presented regarding "tangibility" (facilities, comfort, space, functionality) present significant differences between the two institutions. In this particular case, the public institution clearly has better appreciation for all the items analyzed.
The dimension "reliability" (responsibility, academic services, training, and evaluation methods) in general, has a better assessment in the private institution. As for "receptivity" (professionalism, and capacity), the private institution was best evaluated with a small variation of 0.05 percent.
The dimension "guarantee" (efficiency, quality, agility) has significant differences among the institutions, because when one examines the practical knowledge of teachers, the private institution has an advantage over the public, but at the same time, when evaluating the relations of Directors with the academic community, the public has an advantage over the private.
Finally, the conclusion regarding the dimension "empathy" (the ability to understand the students' needs and report to them) is that the private institution has significant advantages over the public.
3- As a last example, in the research study developed by Ahmadreza et al., (2011), with the title "SERVQUAL in Malaysian universities: perspectives of international students", aimed to evaluate the "perceptions" of service quality and the "expectations" of selected students for international postgraduate studies in Malaysian universities.
The five Dimensions studied in the universities, "professionalism", "reliability", "hospitality", "tangibility" and "commitment", indiscriminately showed lower "perception" when compared to "expectation", characterizing dissatisfaction with service quality offered by the Malaysian universities to university students.
3 Research methodology
A public HEI was used as reference and case study. The method used in this research is characterized as deductive, since its final remarks were drawn from the results obtained in that higher education unit. The research is applied, since it intends to contribute to HEI strategic planning.
As for the typology, it is an exploratory study, since it investigates how the two variables "expectation" and "perception" behave within the Dimensions (Tangibility, Reliability, Readiness, Safety and Empathy), which are implicit in the SERVQUAL Model and will be evaluated globally and in isolation through the courses that are part of the HEI.
Regarding the research strategy, two procedures were used. The first step was the survey of sources that would contribute to the implementation of the literature review. In the material, it was possible to extract the key concepts underlying this research; and the second procedure was planning and executing field research. As to its nature, it is considered quantitative, since statistic was used as an evaluation resource.
As its temporality, the survey happened in the first half of May/2014 and was limited to investigating public HEI, whose universe of research focused on the total 1655 students, distributed and part of technological courses.
Simple, random, stratified sampling was chosen per course, which can be seen in Table 3, and, according to Gil (2002, p. 122) the "stratified sampling is characterized by the selection of a sample of each subgroup of the population. [...]. Stratified sampling can be proportional or non-proportional."
A percentage and proportional sample to its universe was chosen, which was initially estimated at 20% of all students, and subsequently adjusted to 22%, considering as criteria students regularly enrolled in each course, and distributing them in terms, that is, morning, afternoon and evening/night.
Table 3. Sample distribution foreseen for the population studied
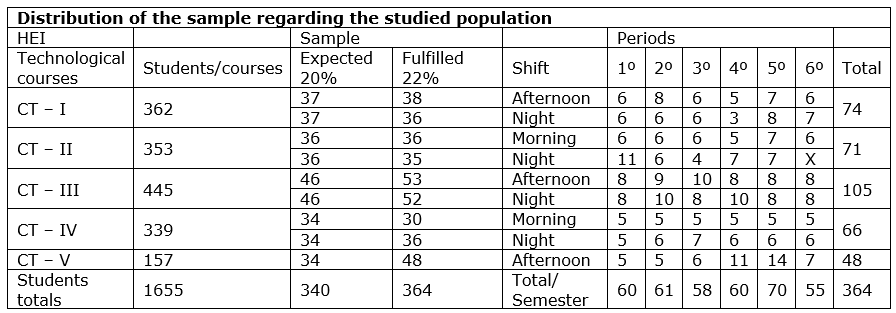
Source: Prepared by the author – Field research conducted at HEI – SP – 2014
As for the data collection instrument, adapted and suggested forms were used in the SERVQUAL Model, since they were originally designed to be applied in banking, credit cards, security, maintenance and product repair companies, and can be seen in Khodayar (2012, p. 206) when he states that:
"the instrument used in the study is an adaptation of the SERVQUAL questionnaire. The original SERVQUAL instrument was designed specifically to evaluate organizations and companies in the service field. Some changes were made to adapt this survey so it could be used in an academic environment [...]."
In order to obtain legal protection for this study, and because it is a public HEI, the goals of the research were presented to the HEI Academic Board, which approved and submitted it to the unity Congregation approval – the highest body of the Institution – which is represented and formed proportionally by teachers, students, employees and chaired by the Director of the Unit. The Congregation, in turn, also approved the research.
In the next phase, the questionnaires were drawn up under the SERVQUAL model authors’ guidance, with twenty-two questions related to "expectation" and twenty-two questions to assess students’ "perception".
There were also eight supplementary questions to measure the relative importance of the dimensions. Shortly after the research was applied respecting the stratification of the sample previously defined.
After the application of the research, the data was tabulated using the Statistical Package for Social Sciences – Version 10.0, which has features and ability to provide descriptive analysis, generate tables, graphs, percentage analysis, average, median, standard deviation, percent coefficient of variation and the Cronbach's Alpha.
Cronbach's Alpha was presented by Lee J. Cronbach in 1951 as a way to estimate the reliability of a questionnaire used in a study [...] It is calculated from the variance of individual items and the variance of the sum of items of each evaluator (Hora, 2010).
4 Results from research
4.1 Perceived Quality
The results obtained as Perceived Quality (Q), are obtained by subtracting P (average "perceptions"), minus E (average "expectations"), as shown on a consolidated basis in Table 4, and each variable Q(n) had its meaning given in Table 1.
Table 4. Quality (Q) in Administrative Services and Dimensions – Global Results
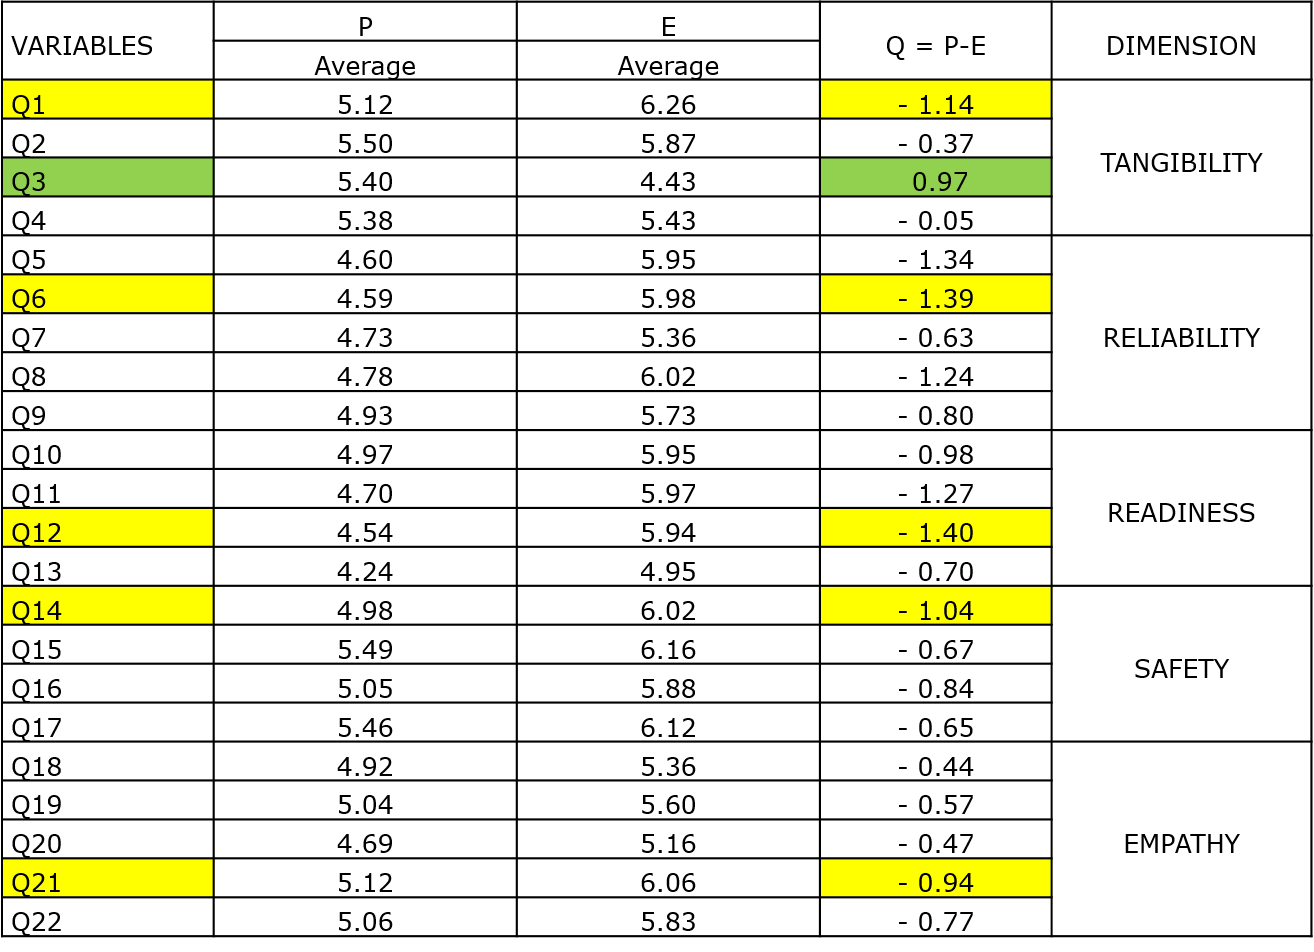
Source: Field research - conducted at HEI – SP – 2014 with n = 364 students
The analysis of the values presented in the Table confirms that, when the result is negative, it indicates that the Perceived Quality (Q) was lower than expected, and when positive it indicates that the Perceived Quality (Q) was higher than expected.
In overall Q results (Perceived Quality) it is observed that the Q3 variable belonging to the dimension "tangibility" stands out among the others, since it is the only one with positive value; thus, this variable exceeded respondents "expectations".
The same overall Q results (Perceived Quality), correlated to the dimensions, showed that the main negative results occurred in descending order in the following variables: Q12 = -1.40 (readiness), Q6 = -1.39 (reliability), Q1 = -1.14 (tangibility), Q14 = -1.04 (safety) and Q21 = -0.94 (empathy), portraying dissatisfaction with the surveyed Administrative Services.
4.2 The relative importance of the dimensions
As quoted in the methodology, eight additional questions were made, whose purpose was to measure the relative importance of the dimensions. Table 5 shows the results, classified as follows: C1 (Tangibility), C2 (Reliability), C3 (Readiness), C4 (Safety) and C5 (Empathy).
Table 5. Relative importance of the dimensions - Global Results at HEI
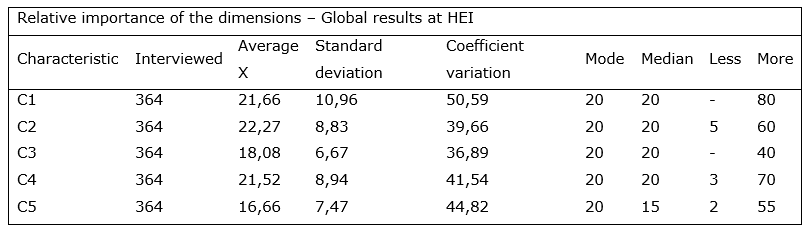
Source: Field research - conducted at HEI – SP – 2014 with n = 364 students
In the previous Table the relative importance of the dimensions in descending order had the following results: C2 = 22.27 (reliability), C1 = 21.66 (tangibility), C4 = 21.52 (safety), C3 = 18.08 (readiness) and C5 = 16.66 (empathy).
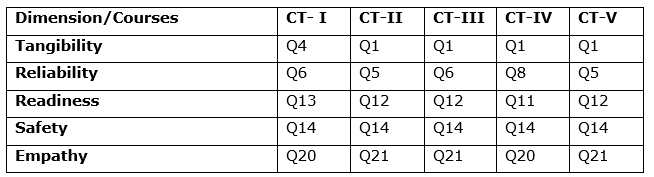
4.3 Prioritization matrix
Generating a prioritization matrix contributes to identify the Dimensions and their corresponding variable, requiring greater attention on the actions to be taken in the HEI Strategic Planning.
When constructing it, the incidence of times that the variables generally repeated among the five courses analyzed (CT–I, CT–II, CT-III, CT-IV, CT-V) was taken into account as well as their results.
Once the variables are distributed, grouping them in such a way that they serve as parameters is possible, so that managers could decide on action strategies to improve the quality of administrative services.
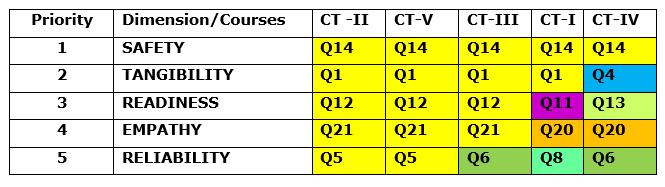
Table 6 shows the unordered prioritization Matrix, and subsequently Table 7 shows the ordered prioritization matrix, with corresponding Table 7.1 showing the variable description.
For better understanding and matrix visualization, different colors were used, which can also be used as a scale, due to their relevance so that policy actions are implemented over a certain period of time, either in the short, medium or long term, and respecting the HEI resource constraints.
Table 6. Matrix of unordered prioritization
Source: prepared by the author
Table 7. Matrix of ordered prioritization
Source: prepared by the author
Table 7.1. Variable description
Source: prepared by the author
5 Final remarks
The proposal is to analyze whether the main goal is confirmed or refuted. The main objective is confirmed, since the results of the research were presented using the SERVQUAL Model as an assessment instrument of administrative services of Quality in a public HEI.
The SERVQUAL model has 22 variables, and a single variable confirmed a positive value, concluding that it showed 4.5% (1/22) of positivity shown through the E3 variable in the dimension "tangibility".
The overall results reflecting the students "perceived quality" as a whole showed a positive variable, denoting a HEI potential related to tangible aspects; however, it showed dissatisfaction with all the other variables.
This research study showed similar results to that developed at the University of Malaysia, where the Quality perceived by the students, in all dimensions, was indiscriminately negative, using the same model.
Regarding giving priority to actions aimed at improving quality in administrative services, identifying the negative variables through the construction of orderly prioritization matrix is necessary, shown in Table 6.
In relation to the implementation of strategic actions it would be important to give priority first to the Q14 variable (safety) and after to the Q1 variable (tangibility), thirdly to the Q12 variable (readiness) and Q (21) simultaneously, and finally, solving the variables Q20 (empathy), Q5 and Q6 (reliability) that appear in the same number of times in the matrix; the others are considered punctual.
In order to solve the variables identified, it is also important to consider their degree of difficulty for their implementation and the limitations of existing HEI resources.
Service quality used as a competitive advantage for organizations from the 80s needed to get through the Models, instruments and metrics to also identify gaps that may exist between what is offered to customers and their expectations.
Associating concepts so subjective such as "expectation" and "perception" as a way to continually seek to improve service quality will always be exciting and challenging, since clients must be respected in relation to their environment, the stimuli they receive, their experiences, influences from their social environment, and above all that these customers can strongly experience dynamic and transforming situations.
The SERVQUAL Model has been contributing and being the most referenced in this sense to the date, even considering it was designed for optimal organization.
Organizations that seek to anticipate and accompany the changes in their day-to-day should not rely on the use of a single assessment instrument, but those that may have their results faced, as permanent reflection.
6 Limitations of the study
This work was limited to examine Service quality in terms of administrative services of a public HEI. In the field research a certain period of the HEI was merely observed, that is, the first half of 2014, and may be used as a comparative basis for further investigation if it indeed occur in that teaching unit.
6.1 Suggestions for future works
When a research is unique it can be used as a baseline for future investigations; however, if their results are not monitored, they may lose value or become invalid over time. Such research should be done annually, considering that students change every six months, with the enrollment of new students and the departure of those who completed their degrees.
Another suggestion for future study that would lead to an even greater deepening is to apply the SERVQUAL Model in freshmen classes, identifying the sample and accompany it over three years, average time students remain in the education unit, with the aim of identify the "perception" and "expectation" from beginning to end of their graduation.
References
Ahmadreza, S. et al. (2011), "SERVQUAL em universidades da Malásia: perspectivas de estudantes internacionais", Business Process Management Journal, Vol. 17, pp. 67-81.
Alves, G.N.C (2005), Marketing de serviços na educação: modelos de percepção da qualidade, Tipografia Guerra – Viseu, Porto.
Barros Neto, J.P et al. (2014), Administração de Instituições de Ensino Superior, Alínea, Campinas.
Basta, D, (2011), Fundamentos de Marketing, Editora FGV, Rio de Janeiro.
Castro Junior, D.F.L. et al. (2013), Qualidade de Serviço: um estudo bibliométrico nas bases de dados internacionais, Revista de Ciências da Administração, Vol.15, pp. 49-68.
Cristina, C-P. et al, (2013), Perceived quality in higher education: an empirical study, Marketing Intelligence & Planning, Vol. 31, pp. 601-619.
Gil, A. C. (2002) Como elaborar projetos de pesquisa. 4. ed. São Paulo: Atlas.
Gondim, C.N (2005), Análise da Expectativa e Percepção da Qualidade de Serviços Administrativos em uma Instituição de Ensino Superior – Master's Thesis, Unicamp, Campinas.
Grönroos, C. (1982) "An Applied Service Marketing Theory", European Journal of Marketing, Vol. 16, No. 7, pp.30-41.
Grönroos, C. (1984) "A Service Quality Model and its Marketing Implications", European Journal of Marketing, Vol. 18, No. 4, pp.36-44.
Hora, H.R.M (2010), Confiabilidade em questionário para Qualidade: um estudo com o Coeficiente Alfa de Cronbach, Produto & Produção, Vol.11, pp. 85-103.
Khodayar, A.F.N.T.M.A, (2012) "Measuring university service quality by means of SERVQUAL method", Asian Journal on Quality, Vol. 13, pp. 204-211.
Las Casas, A.L (2012) Marketing de serviços, Atlas, São Paulo.
Lindqvist, L.J. (1988), Kundernas kvalitetsupplevelse i konsumtionsfasen, (The quality perception of customers in the consumption phase), Swedish School of Economics and Business Administration, Helsingfors, Finland.
Lovelock, C (2011) Marketing de Serviços: pessoas, tecnologia e estratégia, Pearson Prentice Hall, São Paulo.
Muhammed, S. A et al. (2014), "Usando Servqual para avaliar a qualidade do serviço prestado pelo setor de telecomunicações jordaniano", Jornal de Comércio Internacional e Gestão, Vol. 24, pp. 209-218.
Parasuraman, A. et al. (1986) SERVQUAL: A Multiple-Item Scale for Measuring Customer Perceptions of Service Quality, Marketing Science Institute, Report, pp. 86-108.
Robbins, S.P (2011) Comportamento Organizacional – Teoria e prática no contexto brasileiro, Pearson Prentice Hall, São Paulo.
Zeithaml V.A. et al. (1988), "Communication and Control Processes in the Delivery of Service Quality", Journal of Marketing, pp. 35-48.
Zeithaml V.A. et al. (1990) Delivering quality service: balancing customer perceptions and expectations, The Free Press, New York.
[1] Sources: personal sources, commercial sources, experimental sources.
[2] GAP is an interval, or a discrepancy, or a hiatus between two variables, which, in this study, focuses on "expectation" and "perception".