Competitive dysfunction in pharmacies compounding: a Brazilian experience
Rubens Cukier1, Orlando Roque da Silva2, Délvio Venanzi3, Haroldo Lhou Hasegawa4
1 Campo Limpo College – FACCAMP; 2 Paulista University – UNIP; 3 Sorocaba University - UNISO; São Paulo State College of Technology - FATEC; 4 Federal University of Itajuba – UNIFEI
Abstract
This research aims to investigate the level of gaps in services offered by compounding pharmacies in Brazil. The research was conducted with a sample of 306 respondents comprised of owners, pharmacists and customers. We sought to assess the extent of gaps regarding competitive, strategic and operational dysfunctions, checking which are significant and the results of the service provided in relation to competitive factors valued by customers. The data collection instrument was a questionnaire validated model as SERVQUAL, published by Parasuraman et al. (1988). The statistical analysis used the software BioEstat v.05. The results demonstrate that there is a strong adhesion of the samples obtained and the quality dimension that stood out was reliability. In relation to the dysfunctions researched, the results pointed to a perfect interaction between agents which led us to accept that, as part of the pharmacies researched, there is no significant competitive dysfunction.
Keywords: Competitive Dysfunction, Service Quality, SERVQUAL, Compounding Pharmacy
1 Introduction
Pharmacies are included in the main channel of distribution of medicines to the Brazilian population. Compounding Pharmacies have a strong component of services and a part related to products, which are the medicines prescribed by doctors. For a single compounding pharmacy to offer a unique service of other compounding pharmacies, it creates differentiation and adds value and competitive advantage, especially in works for customers.
In this niche market of fierce competition Compounding Pharmacies come, seeking to meet their customers so that their expectations are fully met and the pursuit of excellence in service has been highlighted as an important strategy in the process of customer relationship. Faced with the need to know the level of customer satisfaction in Compounding Pharmacies is an evident need to measure their satisfaction. Thus, the present study constitutes a contribution to the management of the service strategy of compounding pharmacies.
The purpose of this study was to analyze the distortions (gaps) in the quality of services, what is expected to be received and what is perceived from the point of view of owners, pharmacists and customers. This research aims to examine the level of dysfunction (operational and strategic dysfunction) in manipulation pharmacies as a subsidy to improve the quality of the service provided. The evaluation of the expectation and perception of customers, as well as owners and pharmacists responsible, appears to be somewhat subjective; it is necessary to adopt effective tools for this. Thus, the SERVQUAL arises as an important assessment tool, as it helps in differentiating criteria analysis.
For a company to provide quality services, it should observe a minimum level of competitive dysfunction, that is, you must have a reduced level of gaps between the various expectations and the level actually offered. Zeithaml et al. (1990) claim that the key to ensuring a good quality of service is achieved when customer perceptions exceed their expectations and that the 5 gaps model of service quality translate them, and the optimal value of these gaps should tend to or be equal to zero.
The dysfunction can be evaluated by competitive conceptual model of failure analysis of quality in services, called SERVQUAL, which, according to Babackus and Boller (1992), has been widely accepted as a method for measuring consumer perceptions of service quality.
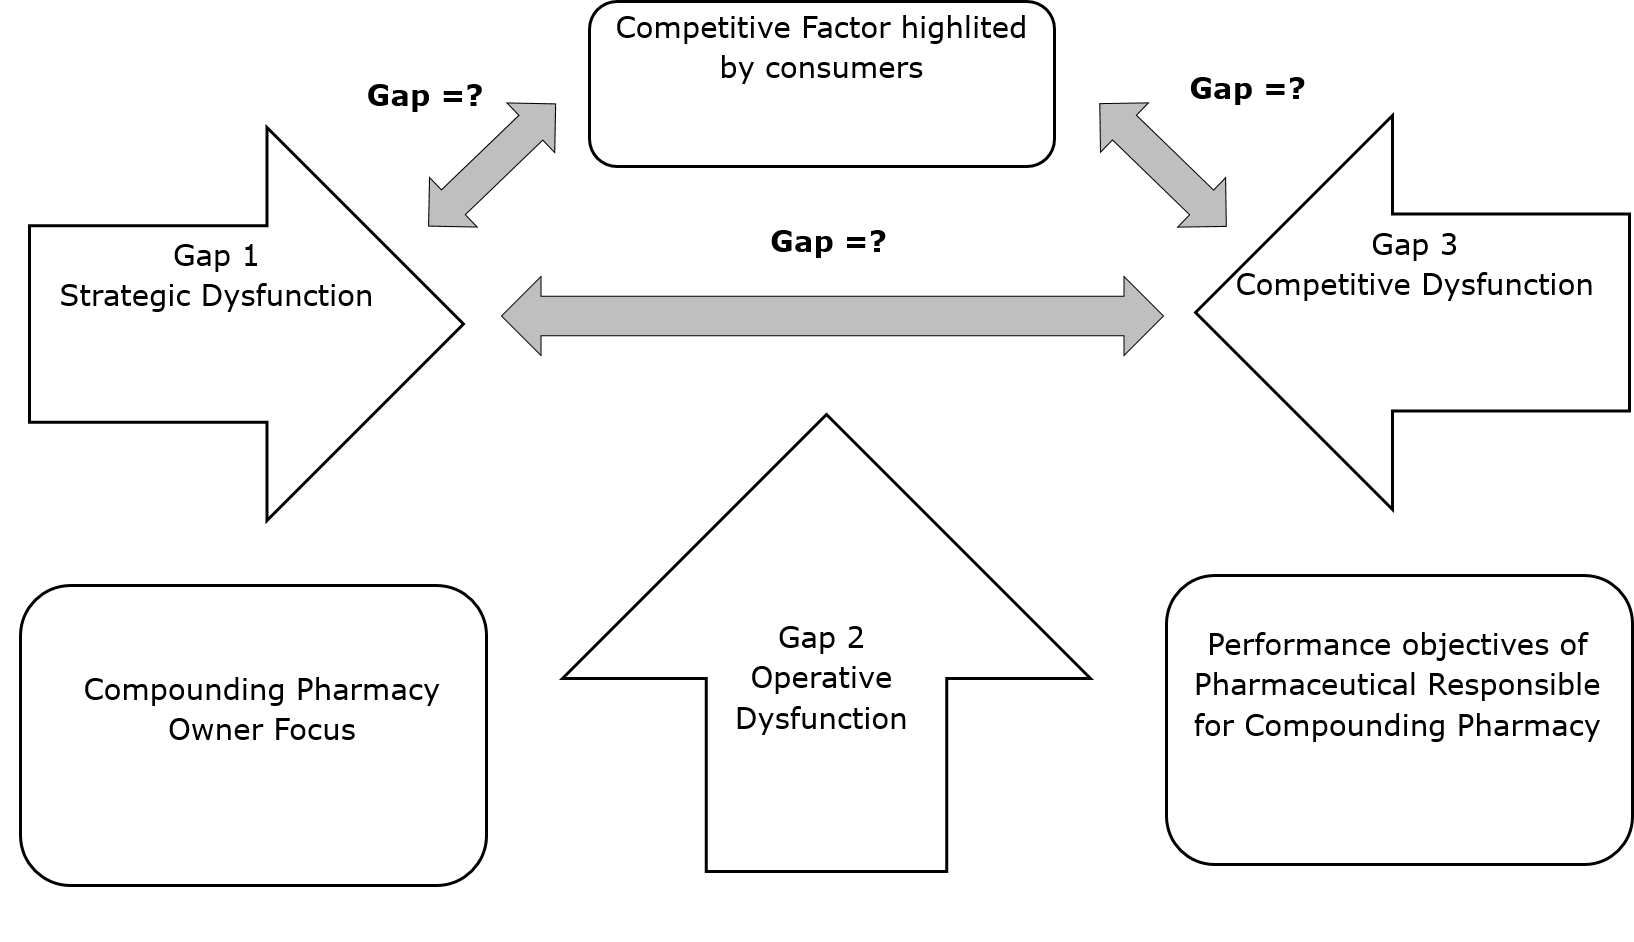
Thus, one can say that there is a strong tendency for the periodic assessment being made of the analysis of gaps of competitive dysfunction in business. This fact enables the action of a new strategic decision making, important and necessary for its sustainability. From this, this research also evaluates the size of the gaps related to Strategic, Competitive and Operating dysfunctions in a range of pharmacies and demonstrates whether these disorders are significant, as confirmed in Figure 1 below:
Figure 1. Dysfunction research object.

Source: Adaptation of Yamamoto (2005)
For ease of interpretation of the dysfunctions this article tried to set them as:
▪ Strategic Dysfunction, as the gap between the competitive factors valued by customer expectations and competitive factors valued by the owner. (gP & Cexp);
▪ Operating Dysfunction, as the gap between the performance objectives prioritized by the pharmacist responsible and competitive factors valued by the owner. (gP & F).
▪ Competitive Dysfunction, as the gap between the competitive factors valued by customers' perception and competitive factors valued by the responsible pharmacist. (gF & Cper)
As a result of the definitions, Competitive Dysfunction appears to result primarily from both the strategic and operational malfunctions, outlined above (Figure 1). It is noted that an evaluation of the client's perception seems to be something subjective, and there is no effective tool for this evaluation. Thus, the SERVQUAL arises as an important assessment tool, as it helps in differentiating criteria analysis.
Based on this, a question arises: what is the degree of competitive dysfunction in the pharmacies evaluated by the conceptual model, of quality of service failure analysis, called SERVQUAL? As it is a research on quality of service applied to compounding pharmacies it is necessary to identify how the dysfunction occurs and how we can measure it.
When the compounding pharmacies, whose services can be valued by customers, were taken as an object of study, the specific objective of this research was: to assess the SERVQUAL model, the competitive level of dysfunction (gaps), identifying the extent to which the strategic and operational dysfunctions contribute to. With respect to the Compounding Pharmacies Campo Limpo Paulista, Jundiai, Valinhos and Vinhedo, cities of São Paulo State, this paper seeks to answer the following assumptions:
Ha: Gap 1, failed perception of consumer expectations in relation to the perception of the owner of this fact. Hb: Gap 2, conversion failed perception owner about the expectations of customers in quality specifications for the operational area is low.
Hc: Gap 3, failure in providing service in relation to the quality of service is low, so that there is a small gap between service quality specifications and service delivery.
2 Scientific methodology
This research deals with qualitative and quantitative data. The data collection instrument was a questionnaire validated model dubbed SERVQUAL published by Parasuraman et al. (1994, 1988, 1985). The population universe was composed of fifteen pharmacies in the cities of Campo Limpo Paulista, Jundiai, Valinhos and Vinhedo, in the State of São Paulo. The survey was based on random listing of the Retail Pharmacists Syndicate in the State of São Paulo (SINCOFARMA – Sindicato do Comércio Varejista de Produtos Farmacêuticos no Estado de São Paulo) and the research period was of five months. Three samples were made with a view to operations research:
Sample 1 - for the experimental group of Pharmacist Owners (P), with 15 owners;
Sample 2 - referring to the group of Responsible Pharmacists (F), with 15 pharmacists;
Sample 3 - for the random group of customers surveyed, divided into:
a) Customer expectation (Cexp): referring to the group of customers at the time before purchasing the drug, with 140 respondents.
b) Customer perception (Cper) for the group of customers at the time of purchase of the product, with 136 respondents.
All data was tabulated in Excel, including the 22 questionnaire responses given by the respondents; and the median for each set of responses was calculated. The same process was made for the five items of the dimension of the quality of Parasuraman et al. (1994, 1988, 1985); thus, the same shape was assumed and the median of the the tabulation of responders was calculated for each dimension.
As Vergara (2000) states, there are two ways to process the data: the first one is quantitatively, i.e., using statistical procedures that can be parametric (analysis of variance, correlation, Student’s t-test, chi-square, regression and proportion) or nonparametric (Mann-Whitney, Kruskal-Wallis and Wilcoxon), and the second way is qualitatively, coding them and presenting them in a more structured way and finally analyzing them. The data can also be analyzed by using the two forms in the same study, which occurs when doing descriptive statistics to support a subjective interpretation or to trigger it.
Appropriate analytical tools were used to test the hypotheses and to answer the questions raised by this research. Nonparametric techniques were used due to the type of data. Data were analyzed by BioEstat v.05. To check the level of adherence the chi-square test and G-test were used as a nonparametric test for comparison of related samples of the Wilcoxon test.
3 Literature review
3.1 Competitive Advantage
The competitiveness according to Porter (1998) defines the ability of companies to develop and implement competitive strategies that will allow the expansion or maintenance of sustainable positions in the markets. In fact, as pointed out by Lall (2001), firms compete for markets and resources, measure competitiveness through relative shares in the markets and profitability, and use competitive strategies to improve their performance. This is the basis of claim Ferraz et al. (1995), for which the competitiveness makes a company more profitable than others. On the other hand, Barbosa (2001) draws attention to other aspects of competitiveness.
The organizational competition is carried out through economic factors, as well as technical and institutional order and the pressures of compliance requirements for technical standards. Other organizations and society, as a whole, need to fit the socially accepted standards of conduct. Based on this requirement, the reputation of efficiency, prestige and socially legitimized conduct should be shown.
Zaccarelli (1996) expressed competitive advantage as any characteristic of the product or service of the company that customers recognize as a positive differentiator over other companies and, therefore, are attracted to the company. For Robbins (2011), competitive advantage is conferred by the ability or circumstance in which a company has relative advantage over their competitors. The company will be more competitive if it offers higher quality services for a given level of service cost or if costs are lower than its competitors’. It can be concluded that a company should be considered competitive if it excels before its competitors and their customers as offering better quality than others (Krugman, 1994).
3.2 Service Quality
Services are defined primarily as an activity of more or less intangible nature that occurs through the intent between customers and employees or assets and physical resources or systems of the service provider (Grönroos, 2007). Services include a combination of results and experiences provided to customers and received by them. The transformation process, in terms of information and services, encompasses uncontrolled variables, including customer participation in the process and how the service is consumed throughout the process. This combination makes quality control more difficult to do (Johnston et Clark, 2002).
The quality of services is mostly of abstract nature and difficult to leverage on the quality of products, which can be objectively measured through varied indicators. (Lovelock et Wright, 2001). According to Parasuraman et al. (1994, 1985, and 1985), the differences between services and products can be summarized in four categories: intangibility, inseparability, heterogeneity and permissibility. As for Cronin et Taylor (1992), the performance should be the most appropriate measurement parameter.
The development of quality in services is different from the development of the quality of manufactured products and this is demonstrated by the list of number of differences between industrial products and services. This characterization of the service becomes important so that there is an understanding in terms of the challenges inherent to the development of quality services. The features identified are: 1) Generally, the service is intangible; 2) generally, ownership cannot be transferred, 3) service cannot be resold, 4) normally, the service cannot be shown effectively because it does not exist before purchase; 5) service cannot be stored; 6) production and consumption usually coincide; 7) production, consumption, and often the sale is made in the same place; 8) service cannot be transported (although the products may frequently); 9) directly participation of customer or purchaser of production; 10) in most cases, direct contact should be necessary (Normann, 2001).
The services are well recognized as the industry is characterized by providing an intangible benefit, and therefore difficult to quantify for effective performance measures (Salazar, 2000). The quality of service provided must be measured by the consumer on the basis of the comparison, or compare what the consumer wants to receive with what he effectively receives, which relates to the gaps model proposed by Parasuraman et al. (1985, 1988). Thus, the quality of service depends not only on the provision of the service itself, but also on the very nature of expectations about service delivery.
3.3 SERVQUAL
The model of the gaps proposed by Parasuraman et al. (1985, 1988), suggests that customers perceive quality as a gap between the original expectations and the service that was actually received. These authors point to three basic qualities of service: customers have more difficulty assessing the quality of services than they would have to evaluate a product; perceptions of service quality result from comparing the expectations of consumers and the final performance, quality assessments not only depend on the outcome of the service, but also depend on the process of service delivery.
The first statement explains the characteristics of services. The third statement reflects the conceptual basis for the model of Parasuraman et al. (1988) which identified a number of discrepancies (gaps) between the perception of service quality and the tasks associated with its provision. Still, the key factors that influence expectations include personal communication, personal needs, past experience and external communications. The SERVQUAL model is used to measure the service quality by comparing expectations before the service and perceptions in post services of the company. (Parasuraman et al., 1988).
Parasuraman et al. (1985), from a number of quantitative and qualitative studies, have identified ten overall dimensions, determining the quality of service after having been consolidated into only five Parasuraman et al. (1988), which represent the evaluation criteria used by consumers. Five gaps are appointed as the causes of failures in service delivery and are used in its revised five dimensions of quality (reliability, responsiveness, assurance, empathy and tangibles) for evaluation. Each of these dimensions were split into four or five item qualifiers, generating 22 item qualifiers a questionnaire that, when initially applied prior to the service, collects information about the client's expectations in relation to the service ideal.
In a second step, performed after the service, the client receives the questionnaire again, but this time, collecting information on the perceived quality of the service already performed. Parasuraman et al. (1988, 1994) claim that, when it announces certain good or service, it creates expectations in the audience and that its satisfaction depends on the relationship between these expectations and service performance, thus implying a fill full of desires, needs and consumer expectations. Taking this into account, it can be concluded that one should always try to meet customer expectations and even exceed them, by selling services that have added value in order to be higher than expected. Thus, the customer is satisfied when the supply exceeds expectations and dissatisfied when the product or service does not match the expected quality.
The SERVQUAL scale only serves for measuring the quality of service and not customer satisfaction (ibid.). Thus, the SERVQUAL defines a range of several items constructed to measure the expectations (E) and perception (P) in relation to customer service. The quality (Q) represents the difference between (P) and (E), or (Q = P - E). In the case in which expectations (E) exceed perception (P), the perceived quality being below the satisfactory level, will lead to unacceptable quality, resulting from an increase in the discrepancy between (P) and (E).
As indicated by research conducted by Ladhari (2008 and 2009) and Yu et al. (2008), the last two decades, the use of SERVQUAL as a generic tool to assess the quality of services in a diverse range of sectors has been widely reported in the literature. According to Ladhari (2008), numerous studies have been conducted, questioning the universality of the model in relation primarily to the adequacy of the five dimensions for evaluating any type of service and the use of the scale proposed by Parasuraman et al. (1988). Qualitative aspects such as the hierarchical structure of service quality and cultural characteristics that affect customer perceptions have also been the object of study, but Ladhari (2008) states that, there are few, yet, efforts made to obtain empirical evidence that the fact corroborates to the alternative proposals reported. The SERVQUAL has been widely accepted as a method for measuring consumer perceptions of service quality. (Babakus et Boller, 1992). According Bayraktaroglu et Atek (2010), the SERVQUAL model has been used as a working tool to measure service quality in virtually all fields of industry services.
In the latest version of the SERVQUAL instrument of Parasuraman et al. (1994), for each attribute defined with the highest expectations, as the level of service desired (for that attribute), the lowest level is defined as the level of service (or at least tolerable). The interval bounded by these two levels is called the tolerance range of the attribute that represents a range of performance of service that the customer considers satisfactory.
3.4 Compounding Pharmacies
Compounding Pharmacies are masterful trade establishments for formulas of drugs, medicines, pharmaceutical and related inputs. Formula of pharmaceutical products that is prepared in the pharmacy of a prescription from a qualified professional, intended for an individual patient, and to establish the composition, dosage form, dosage and use method in detail (Brasil, 2007). In these properties, allopathic and homeopathic medicines can be produced. In the production of allopathic medicines, the production is concentrated in capsules, creams, ointments, shampoos, syrups, gels, oral solutions, creamy lotions, suppositories, and ovules while the homeopathic production consists of tinctures, globules, tablets, ointments and liquid formulas.
According to Cròsta (2000), the difference between the pharmacy and drugstore is that medicines are not allowed to be manipulated in drugstores. They are permitted only to resell manufactured drugs. However, it is mandatory that both of them have the presence of a pharmacist during all hours of operation.
The great advantage of the medicines produced in a compounding pharmacy in relation to the manufactured drugs is the appropriate dose of the drug for each patient. The compounded drug has significant importance for pediatric and elderly patients, as the compounded drugs are hardly available in the appropriate dosage for those patients. Doctors may also prescribe various associations amongst the drugs in the same formulation. (Cròsta, 2000)
The pharmacies in recent years have undergone profound changes, adapting to the new parameters and new laws increasingly stringent. Its tremendous growth, with more than five thousand pharmacies throughout Brazil, brings new challenges ranging from greater demand for these medicines to more demanding consumers as the intensification of commercial competition. Its main challenge is related to gaining credibility, which can only be achieved through the implementation of quality management systems and excellence in service. (Godeiro, 2008).
Amaral et Vilela (2008) and Schneider et White (2003), agree that it should offer subsidies to Compounding Pharmacies to deploy both program quality control of products and excellence in service, as well, in which it is a prerequisite for achieving productivity levels both in handling formulas as in customer satisfaction which they will reflect the competitive advantage, resulting in sales increase.
On the other hand, there is a greater risk associated with the loss of profitability that is to see quality just as a legal obligation, not as a competitive strategy in a market where it is considered as an attribute inherent to the product and valued by competitors who hold the largest market share. (Rossi, 2001). The association of quality management and service excellence to strategic planning and its implication to the profitability and market share, as Garvin (1988) states, can be an important competitive advantage for companies in the sector of pharmacies that compete for the pharmaceutical market in Brazil.
4 Results and discussion
4.1 Hypothesis Ha
The hypothesis Ha (Gap1) is: there is a small discrepancy between the perception of what the customer expects and the owner's perception of this fact. The test regarding the adhesion of sample 1 in the gap in which the items are analyzed owner versus customer expectations (Strategic Dysfunction), the CHI-SQUARE test results using the data obtained showed that the median level of significance 0.05 presents strong adhesion samples (p = 1.0000), which can be seen in Table 1, below.
Table 1. Chi-Square Test between the variables owner and customer expectation
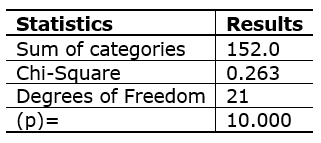
Source: Survey data.
Then to test the Ha applied descriptive statistics of the gap 1, based on the data already obtained, which can be seen in Table 2, below, shows the test of the hypothesis Ha variables between owner and customer expectations.
Then, to test the Ha applied Descriptive Statistics of the gap 1, according to data already obtained, which can be seen in Table 3 below, it presents the sample mean of the variable gap between variables 1 owner and customer expectations.
The results cannot reject the hypothesis Hb, whose failed perception of consumer expectation is low, i.e., there is a small discrepancy between what the customer expects and the perception of the owner of this fact.
Table 2. Descriptive data of the samples Gap 1
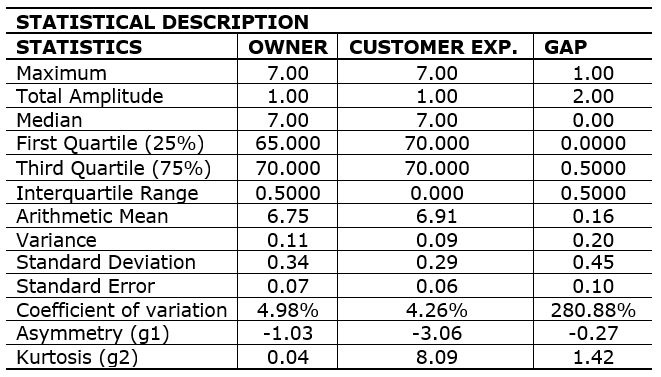
Source: Survey data.
Table 3. T-Test: a sample of the gap 1
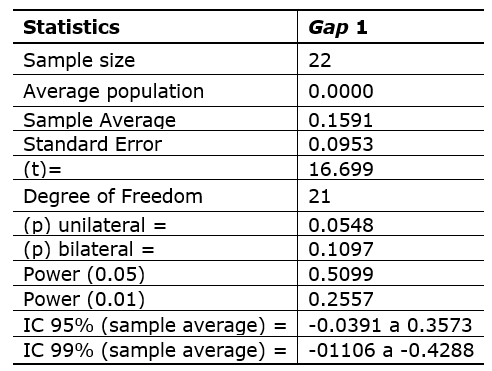
Source: Survey data
4.1.1 Quality attributes of Gap 1
The expectations between the owner and customers (Strategic Dysfunction) are analyzed as follows: we asked the owner and every customer of the pharmacies surveyed to indicate their preference regarding the different characteristics considered by the model: Tangibility, Reliability, Promptness, and empathy guarantee.
In Table 4, we observe that the columns P and Cexp Posts express the median preferences of owners and customers' expectations. Columns P Stations and Posts Cexp express preferences placed in the order of posts Rank 1 indicates higher preference. The Gap column expresses the difference between the positions of the owners and puts customers' expectations.
From the results obtained it is assumed that the size of the assessed quality that mostly stands out is reliability. The tangibility was the trait with the largest gap. The owners understand that customers value most the item reliability, which was confirmed by the results obtained.
Table 4. Preference for posts in the Gap 1
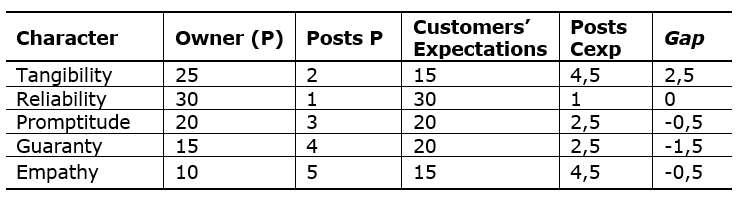
Source: Survey data
In the above table, the columns P and Cexp express the median preferences of owners and customers' expectations. Columns P-Stations and Posts Cexp express preferences placed in order of posts. Rank 1 indicates higher preference. The Gap column expresses the difference between the positions of the owners and customers' expectations.
4.2 Hypothesis Hb
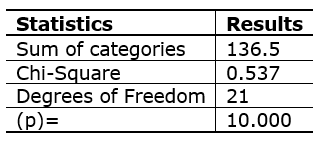
The hypothesis Hb (Gap2) consists of the failure to convert the owner's perception of customer expectations into quality specifications for the operational area. A test regarding the adhesion of sample gap 2, which analyzes items versus owner responsible pharmacist (Operational Dysfunction), the CHI-SQUARE test results using the data obtained showed that the median level of significance is 0.05 strong adhesion of the samples (p = 1.0000), which can be seen in Table 5.
Table 5. Chi-Square Test between the variables owner and pharmacist
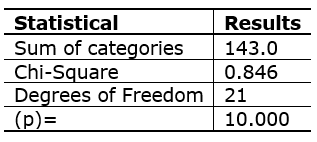
Source: Survey data
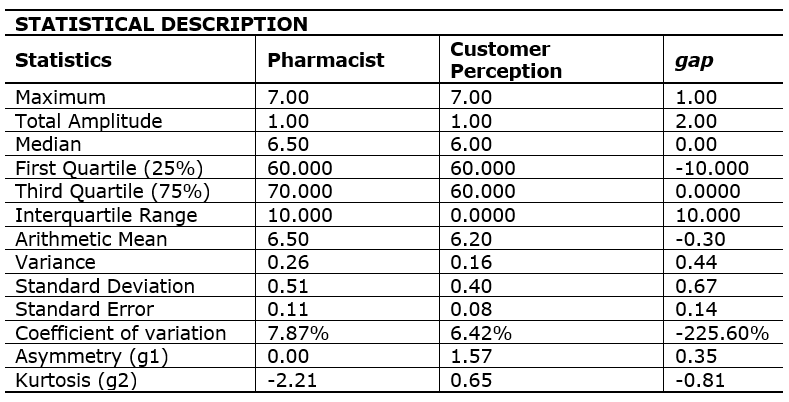
The results from the Chi-Square test show the adhesion between the variables owner and pharmacist. Then, to test the Hc it was applied to the gap Descriptive Statistics of the gap 2, as data were already obtained, which can be seen in Table 6 below.
Table 6. Descriptive data of the samples Gap 2
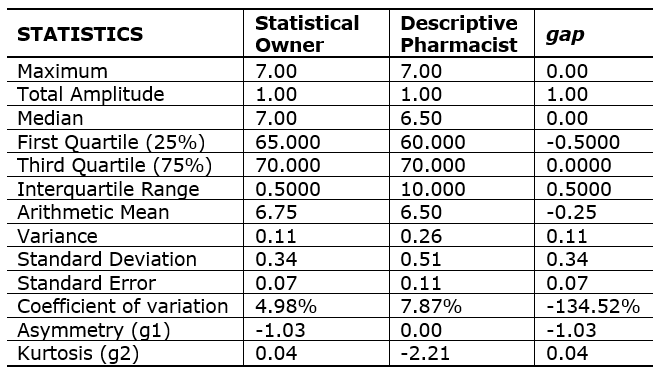
Source: Survey data
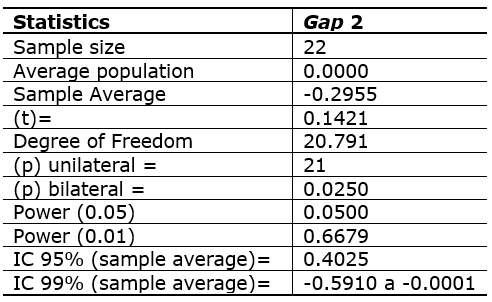
The data in the table shows the test of the hypothesis under application of Hb Descriptive Statistics of gap 2 between the variables owner and pharmaceuticals. The t-test, shown in Table 7, shows that the mean sample of the variable GAP is not significantly different at the significance level 0:05, population mean zero. Table 7 shows the mean sample of the variable gap between the two variables owner and pharmacist. The results cannot reject the Hb hypothesis: Gap 2 conversion of failed perception of the owner regarding customer expectations in quality specifications for the operational area is low.
Table 7. T-Test: a sample of Gap 2
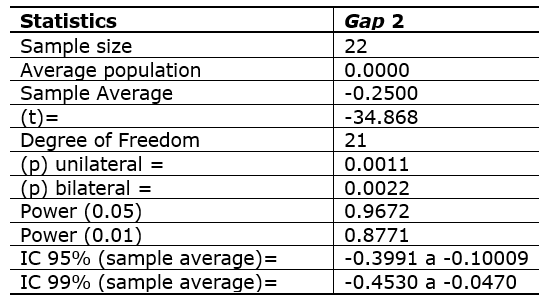
Source: Survey data
4.2.1 Quality attributes of Gap 2
The difference between the owner and the responsible pharmacist (Operational Dysfunction) is analyzed as follows: we asked the owner and the pharmacist in charge of each compounding pharmacy researched to indicate their preferences regarding the different characteristics considered by the model: Tangibility, Reliability, Promptness, Guaranty and Empathy for understanding purposes:
• Tangibility - The appearance of the physical facilities. Employees have good looks. The devices seem well preserved;
• Reliability - The ability of the pharmacy to perform the promised service reliably and accurately;
• Readiness - The willingness of employees to help customers and provide prompt service;
• Assurance - Knowledge and courtesy of employees and their ability to convey trust and confidence;
• Empathy - Worry and individualized attention that employees offer to customers;
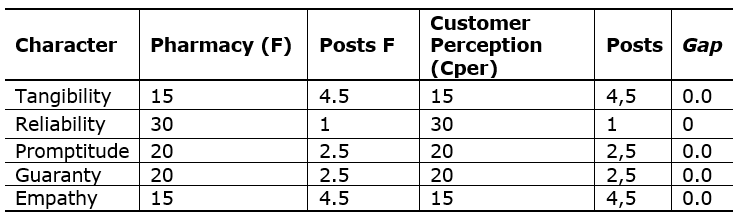
In Table 8 below, it is observed that the columns P and F express the preferences of the median owner and pharmacist in charge. The columns stations P and F express the Posts preferences placed in order of posts. Rank 1 indicates higher preference. The Gap column expresses the difference between the positions of the stations owners and responsible pharmacists.
Table 8. Preference for posts in Gap 2
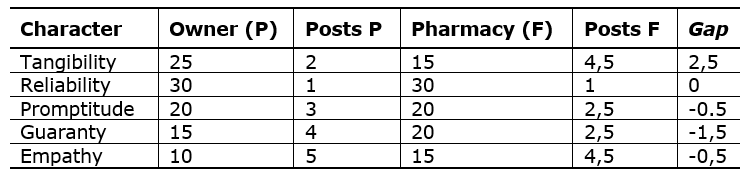
Source: Survey data
The data in Table 8, which express, in the columns P and F, the preferences of the median owner and pharmacist in charge, the columns stations P and F express the Posts preferences placed in order of posts. Rank 1 indicates higher preference. The Gap column expresses the difference between the positions of the owners and the posts of pharmacists. From the results obtained it is assumed that the size of the assessed quality that stands out most is reliability. The tangibility was the trait with greater gap. The owners and responsible pharmacists agree that the most valued item is reliability.
4.3 Hypothesis Hc
The hypothesis Hc (Gap 3) consists in the failure to provide services regarding the low quality of service, i.e., there is a small discrepancy between the specifications of service quality and service delivery.
Test regarding the adhesion of sample in hypothesis Hc, which analyzes pharmacists responsible versus customers perception (Competitive dysfunction). The results of the chi-square test using the data obtained showed that the median level of significance is 0.05 strong adhesion of the samples (p = 1.0000), which can be seen in Table 9 below.
Table 9. T-Test: a sample of gap 2
Source: Survey data
The results from the Chi-Square test show the adhesion between the variables pharmacist and customer perception. Then, to test the Hd, it was applied to the gap Descriptive Statistics 3; data were already obtained, which can be seen in Table 10.
Table 10. Descriptive data of the samples in Gap 3
Source: Survey data
The data demonstrate hypothesis testing Hc under the application of descriptive statistics of the gap 3 between the variables pharmacist and customer perception. The t-test, shown in Table 11 below, shows that the sample mean of the variable GAP is not significantly different at the significance level 0:05, population mean zero.
The data table shows the sample mean of the variable gap between the 3 variables pharmacist and customer perception. The results cannot reject the hypothesis Hc: The expectation of the pharmacist in charge does not differ significantly from the perception of customers, i.e., there is a small discrepancy between the specifications of service quality and service delivery.
Table 11. T-Test: a sample of gap 3
Source: Survey data
4.3.1 Quality attributes of Gap 3
The differences between the responsible pharmacist and customer perception (Competitive Dysfunction) are analyzed as follows: it was requested to the responsible pharmacist and every customer of the pharmacies surveyed to indicate their preference regarding the different characteristics considered by the model: tangibility, reliability, promptness, Guaranty and Empathy.
In Table 12, we observe that the columns F and Cper express the median preferences responsible pharmacist and customer perceptions. Columns F and Stations Cper express preferences placed in order of posts. Rank 1 indicates higher preference. The column Gap expresses the difference between the ranks of pharmacists responsible and posts of customer perceptions.
Table 12. Preference for posts in Gap 3
In the table, columns F and Cper express the preferences of the median responsible pharmacist and customer perceptions. Columns F and Customer Perception Cper express preferences placed in order of posts. Rank 1 indicates higher preference. The Gap column expresses the difference between the positions of pharmaceutical and posts of customer perceptions.
From the results obtained it is assumed that the size of the assessed quality that stands out most is reliability. Pharmacists a preferable agreement responsible and customers agree that the Question is the most valued reliability.
5 Conclusions
Considering the legal framework that regulates pharmacies in Brazil, it is important to clarify that they have specific conditions and procedures, organized and accurate. However, there is a debatable aspect such as the relationship between owner and pharmacist responsible in building the competitive strategy.
Moreover, we should also consider that, in recent years, the Brazilian society is advancing socially and economically and as a result the consumer compounded medications have increased their level of demand and perceptions regarding the quality of both drugs as the quality of service; it is imperative to provide tools which allow the measurement of this quality of service. These instruments, such as the SERVQUAL model, contribute in developing competitive strategies, implementation and evaluation of possible gaps that may lead to competitive, strategic and operational dysfunctions.
Notably, the quality of service provided by pharmacies surveyed to be assessed by the owners, pharmacists responsible and customers in order to receive what they want and what they actually received was adequate, confirming that it is acclaimed by Parasuraman et al., that the quality of service depends not only on the provision of the service itself, but also the very nature of expectations about service delivery.
This research aimed to investigate the application of the SERVQUAL model to evaluate the dysfunctions between the expectations and perceptions of owners, pharmacists and clients. This allowed to evaluate the level of gaps in the services offered by pharmacies, assessing the size of the gaps related to strategic and operational competitive dysfunctions in the pharmacies surveyed. With respect to the hypotheses, as shown, they were all confirmed. The survey did not observe significant dysfunctions pointing to strong adhesion between agents, such that the median of all gaps was nil. From the results obtained, it can be concluded that the gap Competitive is equally influenced by the operational and strategic gaps, that is, zero being no gaps between the gaps searched dysfunctions, as shown in Figure 2.
Figure 2. Gaps dysfunctions of Strategic, Operational, Competitive.
Source: Authors
According to Grönroos (2007), it is necessary to add value to the customer by offering quality services, which effectively may have occurred in the establishments surveyed. Parasuraman et al. (1994), considering all factors, the most critical dimension in terms of quality is reliability. From the point of view of quality attributes in the first place it should be noted that, in this sample, the most important dimension was the reliability, confirming what Parasuraman et al. (1988) said.
With respect to other attributes obtained, the second was promptness, the third was guarantee. the fourth was empathy and tangibility was considered the least preferred attribute. This result reflects the profile of the competition pharmacies focused on differentiation by providing individual treatment and allows physicians to adjust medication dosages according to the needs of patients.
The results of this study provided insight to the pharmacies surveyed. The SERVQUAL model, used in this study, proved to be an important tool for the collection and interpretation of data and, despite the criticism of some authors, such as Cronin et Taylor (1992) and Ladhari (2009), SERVQUAL is still regarded as the most suitable for measuring service quality as stated by Babakus et Boller (1992) and Yu at al. (2008). It can be observed in the literature, such as in Yamamoto (2005) and Ladari (2008), which in recent years there have been variations of the original questionnaire derivation and use of trade-off, but none was considered superior to the model of Parasuraman et al. (1988). Thus, this study chose to present the perceptions and expectations of interested parties that aim to highlight the importance of the SERVQUAL model, which is to evaluate the quality of the service.
The results obtained here can contribute to new research on service quality; plus, you can go deeper into the procedures used by the sample in order to check how to reach the most critical attribute: reliability, thus it is believed that it may assist other companies to achieve this goal. Finally, this work presents considerations and initial guidelines for the development of specific projects to quantify the quality of services and develop actions to reduce or even eliminate the competitive dysfunctions and it can contribute to future studies concerning new models for assessing the quality of services.
A limitation of the research that the hypotheses formulated and tested by the method described is restricted to the pharmacies surveyed should be pointed out. It starts with the premise that the answers given by the respondents to the questionnaires express the truth.
References
Amaral, M. P. H. and Vilela, M. A.P. (2008) Controle de Qualidade na Farmácia de Manipulação. Juiz de Fora: UFJF.
Babakus, E. and Boller, G. W. (1992) An empirical assessment of the SERVQUAL scale. Journal of Business Ressearch.
Barbosa, S. L. (2001) Padrões de competitividade e estratégias organizacionais no setor moveleiro do Paraná. Dissertação (mestrado em administração), Universidade Federal do Paraná, Curitiba.
Bayrataroglo, G. and Atrek, B. (2010) Testing the Superiority and Dimensionality of SERVQUAL vs. SERVPERF in Higher Education. The Quality Management Journal, Vol. 17, No. 1.
Brasil, Ministério da Saúde, Agência Nacional de Vigilância Sanitária (2007). Resolução RDC 67, de 8 de outubro de 2007. Dispõe sobre as Boas Práticas de Manipulação de Preparações magistrais e Oficinais para uso Humano em farmácias. Diário oficial da República Federativa do Brasil, DF, 9 de outubro de 2007.
Cronin, J.J. and Taylor, S.A. (1992) Measuring service quality: a reexamination and extension. Journal of Marketing.
Cròsta, V. M. D. (2000) Gerenciamento e qualidade em empresas de pequeno porte: um estudo de caso no segmento de farmácia de manipulação. Dissertação (Mestrado em Matemática), Universidade Estadual de Campinas, Instituto de Matemática, Estatística e Computação Científica. Campinas.
Ferraz, J. C., Kupfer, D. and Haguenauer, L. (1995) Made in Brazil: desafios competitivos para a Indústria. Rio de Janeiro: Campus.
Garvin, D. A. (1988) Managing Quality: The Strategic and Competitive Edge. Boston, Free Press.
Godeiro, D. P. O. (2008) A influência da cultura organizacional na adoção de práticas de qualidade seis sigma: um estudo exploratório no segmento de farmácia de manipulação do estado do Rio Grande do Norte. Dissertação (mestrado em engenharia de produção), UFRN.
Gronroos, C. (2007) Service management and marketing: customer management in service competition. New York: John Wiley.
Krugman, P. (1994) Competitiveness: a dangerous obsession. Foreign Affairs.
Ladhari, R. (2008) Alternative measures of service quality: a review. Department of Business Administration, University of Moncton. Moncton.
Ladhari, R. (2009) A review of twenty years of SERVQUAL research. International Journal of Quality and Service Sciences.
Lalls, S. (2001) Competitiveness Indices and Developing Countries: An Economic Evaluation of the Global Competitiveness. Report World Development.
Lovelock, C. and Wright E. L. (2001) Principles of Service Marketing and Management. New York: Prentice-Hall.
Normann. R. (2001) Service Management: Strategy and Leadership in Service Business. New York: Wiley.
Parasuraman, A., Zeithaml, V. A. and Berry, L. L. (1985) A conceptual model of service quality and its implications for future research. Journal of Marketing.
Parasuraman, A., Zeithaml, V. A. and Berry, L. L. (1988) A multiple-item scale for measuring consumer perceptions of service quality. Journal of Marketing.
Parasuraman, A., Zeithaml, V. A. and Berry, L. L. (1994) Alternative scales for measuring service quality: a comparative assessment based on psychometric and diagnostic criteria. New York: Journal of Retailing.
Porter M. (1998) Competitive Strategy: Techniques for Analyzing Industries and Competitors. Boston: Free Press.
Robbins S. (2011) Management. New York: Prentice-Hall.
Rossi, P. E. (2001) Análise das Estratégias Competitivas da Indústria Farmacêutica. Dissertação (Mestrado em Engenharia de Produção), Escola de Engenharia de São Carlos, USP.
Salazar, A. (2000) A avaliação da qualidade dos serviços: o caso de uma seguradora. Revista Portuguesa de Gestão.
Schneider, B. and White, S.C. (2003) Service Quality: Research Perspective. New York: SAGE Publishing.
Vergara, S. C. (2000) Projetos e Relatórios de Pesquisa em Administração. 3. ed. São Paulo, Atlas.
Yamamoto, E. Y. (2005) Disfunção competitiva uma contribuição à gestão da estratégia de serviços das clínicas oftalmológicas. Tese (Doutorado em Ciências), Universidade Federal de São Paulo.
Yu, L., Hong, Q., GU, S. et al. (2007) An epistemological critique of gap theory based library assessment: the case of SERVQUAL. Journal of Documentation.
Zaccarelli, S. B. (1996) Estratégia moderna nas empresas. São Paulo: Zarco.
Zeithaml, V.A., Parasuraman, A. and Berry, L.L. (1990) Delivering Quality Service: Balancing Customer Perceptions and Expectations. New York: The Free Press.